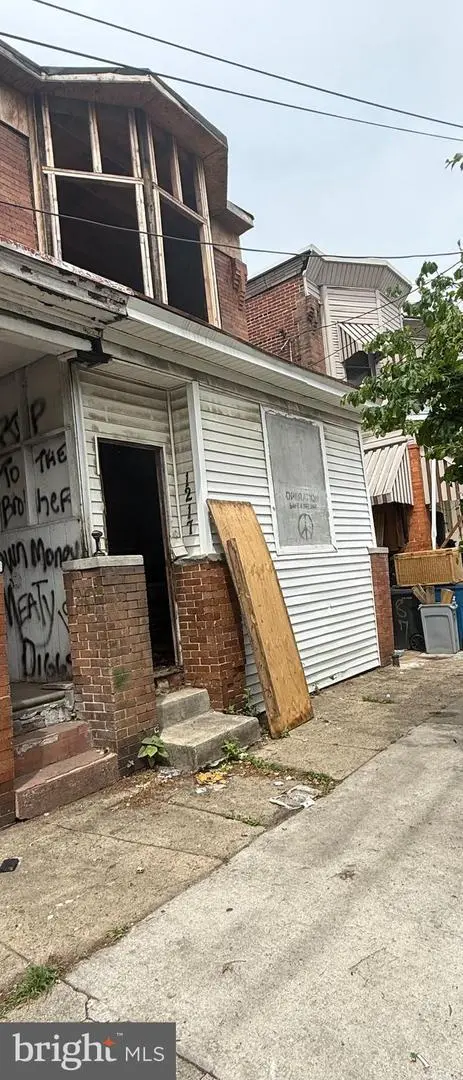
1217 Jackson St · Camden, NJ
Flood risk 1/10 · Minimal
- FEMA flood zone
- X (unshaded)
- Chance of flooding over 30 yrs
- 0.0%
- Est. flood insurance / yr
- $507 – $1,088
Fire risk 1/10 · Minimal
- Est. fire insurance / yr
- $526 – $976
Heat risk 7/10 · Major
- Hot days now (above 103°F)
- 7 days/yr
- Hot days in 30 yrs
- 15 days/yr
Wind risk 6/10 · Moderate
- Chance of severe wind over 30 yrs
- 27.0%
Air-quality risk 4/10 · Minor
- Unhealthy air days now
- 5 days/yr
- Unhealthy air days in 30 yrs
- 6 days/yr
Risk factors via First Street. Map © Google.
Why this score? — see what drove the B- grade
The composite is a weighted blend of 9 inputs, each scored 0–100. Each bar is that input's sub-score; the figure is the points it added to the 100-point composite (weight × sub-score).
- Cash flow +30.0/30.0
- 1% rule +10.0/10.0
- DSCR +10.0/10.0
- ARV discount +10.0/15.0
- Livability +3.5/5.0
- Rent growth +2.5/5.0
- Condition / age +2.5/5.0
- Schools +0.7/10.0
- Appreciation +0.0/10.0
$115,000
🖨 Deal sheet 📄 Offer letter ✓ Due diligence
Listing remarks
Investor Opportunity in Camden! Great potential for investors looking to add to their portfolio. Property is being sold As-Is. Please bring a drill or appropriate tools to access the property, as entry may require opening a secured door. Buyer to perform their own due diligence. Before showing property a Hold Harmless Agreement needs to be signed. Call ed Listing agent if you have any questions.
Key facts
- Built 1920
- Listed 19 days
Property features AI
Finance
- Financial info: Land assessed at $7,000; Improvements assessed at $30,400; Tax assessed value $37,400 (tax year 2025); Annual taxes noted
Exterior
- Parking: On-street parking
- Utilities: Public water; Public sewer
- Home design: Interior townhouse/rowhouse; Assessor reports 1,416 finished above-grade square footage
- Construction: Aluminum siding and brick exterior; Block foundation; Above-grade and below-grade structures noted; Fee simple ownership
- Exterior features: Not located in a federal flood zone; Ground rent paid annually
Interior
- Interior features: No basement; Accessibility features present
Neighborhood map
What this means for you Summary
Snapshot
- This is a 3-bed/?-bath townhouse listed at $115k.
Deal economics
- At list price, monthly cash flow is $686 ($8k/yr) — positive.
- The deal already cash-flows at list — no discount required.
- Meets the 1% rule at list price ($2k rent vs $115k).
- Recommended offer: $113k (1.5% below list) — sets the bar for market timing.
- Cap rate 13.5% vs local median 7.1% in Camden — top-decile yield for the area; either an underpriced asset or a hidden risk that comps aren't pricing in. Stress-test before assuming the spread holds.
Location & tenants
- Location reads 70/100 on livability (#262 in NJ) — a middle-class / working-renter tenant base. Strengths: amenities A+, commute A+, cost of living A; Watch: schools F, crime F, employment F.
- Camden City School District (urban): math 3% / reading 16% proficiency, ranked #472 of 472 in NJ (top 100%) — low school quality limits family demand, transient renter base, plan for 1-2y turnover; 86% free/reduced lunch — lower-income household profile, screen leases tightly.
- Market conditions: 95 active listings in the ZIP; 27 comparable units currently listed for rent nearby; rentals at typical pace (median 20d on market — plan ~3-4 weeks tenant-placement turnaround); 1,018 units permitted in Camden County in 2024 (509 in 5+ unit buildings).
Forward outlook
- Local home prices are declining (-3.0%/yr); year-one equity from $795 of loan paydown is wiped out by about $3k of value loss. Plan a longer hold.
- Camden County population projected to shrink 8% by 2050 — rents likely to lag national; underwrite the cash flow, not the appreciation.
- At projected returns (-3.0% appreciation + 3.0% rent growth), your $32k cash investment doubles in ~5 years — after that, you're playing with house money.
Negotiation context
- It's been on market 20 days — a 2% lower offer ($113k) is reasonable based on typical stale-listing flexibility.
- 7 sale attempts since 26y ago with the ask held roughly flat each time — persistent listings suggest the price (not the market) is what's stuck; bring a comps-based counter.
- Current owner paid $4k; list at $115k implies a 2775% gain — meaningful room to come down on a strong offer.
Risks & watch-outs
- Watch-outs: built in 1920 — expect roof / HVAC / electrical / plumbing capex.
- Climate carrying-cost: major wind risk, 27% chance of damaging wind over 30y; extreme-heat days projected 7→15/yr by 2055 (HVAC capex compounding) — expect insurance premiums to compound above CPI over the hold.
Questions for the listing agent
- Built in 1920 — when were the roof, HVAC, electrical panel, plumbing, and water heater last replaced?
- Is there a deadline driving the sale (1031 exchange, divorce, estate, relocation)? That informs how much negotiation room exists.
- Schools are F-rated, which usually means shorter tenancies and higher turnover. Who's the typical renter profile here, and what's been the actual vacancy rate?
- Crime grade is F in this area — have there been break-ins, vandalism, or insurance claims at this property in the last 3 years? What carrier currently insures it and at what premium?
- What's the average days-on-market for RENTAL listings here right now (not sales)? A rising rental-DOM trend means longer vacancies and softer asking-rent achievability than the comps imply.
- What's the recent tenant-quality profile in this submarket — average credit score on applications, eviction rate, late-payment / NSF rate, and stable-employment percentage? A property-management company in the area should have these aggregated.
- How much new for-sale + rental construction is in the pipeline within 1–3 miles? Heavy new supply typically softens prices + rents 12–24 months out; constrained supply supports both.
Investment metrics
- 1% rule
- 1.60% ✓
- Cap rate
- 13.45%
- Cash-on-cash
- 25.57%
- DSCR
- 2.14
- GRM
- 5.2
CMA / ARV
- ARV (on-the-fly)
- $121,776
- Comps found
- 12
Show comp detail 12 sales within ~0.75 mi
| Address | Dist | Beds/Ba | Sqft | Sold | Price | $/sf | Match |
|---|---|---|---|---|---|---|---|
| 1099 Morton St | 0.20mi | 3/1.0 | 1,431 (+1%) | 1mo | $65,000 | $45 | 88 |
| 1155 Whitman Ave | 0.26mi | 3/1.5 | 1,431 (+1%) | 2mo | $206,000 | $144 | 85 |
| 1522 S 10th St | 0.32mi | 3/1.0 | 1,429 (+1%) | 2mo | $125,000 | $87 | 82 |
| 1223 Whitman Ave | 0.24mi | 3/1.0 | 1,496 (+6%) | 1mo | $86,458 | $58 | 78 |
| 936 Mechanic St | 0.48mi | 3/1.0 | 1,408 (-1%) | 1mo | $78,750 | $56 | 76 |
| 1165 Morton St | 0.13mi | 3/1.0 | 1,557 (+10%) | 2mo | $80,000 | $51 | 76 |
| 933 Lansdowne Ave | 0.44mi | 3/1.0 | 1,372 (-3%) | 1mo | $219,000 | $160 | 74 |
| 1085 Morton St | 0.22mi | 3/1.0 | 1,280 (-10%) | 1mo | $83,000 | $65 | 73 |
| 1154 Thurman St | 0.17mi | 3/1.0 | 1,255 (-11%) | 1mo | $108,333 | $86 | 72 |
| 1352 Carl Miller Blvd | 0.22mi | 4/1.0 (+1) | 1,536 (+8%) | 1mo | $249,000 | $162 | 70 |
| 1260 Kenwood Ave | 0.56mi | 3/1.5 | 1,476 (+4%) | 2mo | $100,000 | $68 | 65 |
| 1536 Ormond Ave | 0.55mi | 3/1.5 | 1,332 (-6%) | 3mo | $245,000 | $184 | 62 |
Match score weights: distance 35% · size 25% · config 20% · recency 20%. Top-matched comps best support the ARV.
Projected returns pro-forma
-3.0% appreciation · 3.0% rent growth · sell at horizon
- IRR
- 19.2%
- Equity multiple
- 1.78×
- Total profit
- $25,081
- Equity at exit
- $17,147
- IRR
- 27.5%
- Equity multiple
- 3.43×
- Total profit
- $78,159
- Equity at exit
- $9,943
Cash invested: $32,200 (down + closing). Projections, not guarantees.
Landlord ↔ Tenant lean methodology
- Overall (STATE)
- 21 Tenant-Leaning
- State New Jersey
- 21 Tenant-Leaning · D+6
- County
- — inherits STATE
- City
- — inherits STATE
ZIP-level market 08104
- Active inventory
- 95
- Price-to-rent
- 5.2×
Monthly cashflow live
- Estimated rent
- $1,838 high interval (Pro) →
- Mortgage (P&I)
- −$603
- Tax from tax record
- −$115 /mo · $1,379/yr
- Insurance
- −$48
- HOA
- −$0
- Vacancy / Maint / Mgmt
- −$386
- Net cashflow
- $686
Break-even live
UW: 25.0% down · 7.5% · 30yr · 1.5% tax · 5.0% vac · 8.0% maint · 8.0% mgmt
Financing live
Cash to close
- Down payment
- $28,750
- Closing costs
- $3,450
- Reserves months
- —
- Total cash needed
- —
Loan-product check · same deal, 3 products live
Conventional
25% down · 7.5% · 30yr
- Down + closing
- —
- Monthly P&I
- —
- Monthly cashflow
- —
- DSCR
- —
- Eligible?
- —
Personal DTI + credit; lowest rate.
DSCR
20% down · 8.5% · 30yr
- Down + closing
- —
- Monthly P&I
- —
- Monthly cashflow
- —
- DSCR
- —
- Eligible?
- —
No personal income docs; deal must DSCR.
Hard money
10% down · 12.0% · 12mo
- Down + closing
- —
- Monthly P&I
- —
- Monthly cashflow
- —
- DSCR
- —
- Eligible?
- —
Short-term bridge; refi at stabilization.
Rent comps 27 comps
| Address | Beds | Baths | Sqft | Rent | $/sqft | DOM | Units | Dist |
|---|---|---|---|---|---|---|---|---|
| 1502 S 9th St Camden, NJ | 2.0 | 1.0 | 1050 | $1,475 | $1.40 | 19d | 1 | 0.44mi |
| 1364 Kaighn Ave Camden, NJ | 2.0 | 1.0 | 912 | $1,485 | $1.63 | 3d | 1 | 0.50mi |
| 209 Cedar Ave Oaklyn, NJ | 2.0 | 1.0 | 1400 | $1,500 | $1.07 | 16d | 1 | 0.60mi |
| 209 Cedar Ave Oaklyn, NJ | 2.0 | 1.0 | 1400 | $1,800 | $1.29 | 5d | 1 | 0.60mi |
| 1455 Wildwood Ave Camden, NJ | 3.0 | 1.5 | 1353 | $1,900 | $1.40 | 10d | 1 | 0.66mi |
| 1055 Kenwood Ave Camden, NJ | 4.0 | 1.0 | 1088 | $1,875 | $1.72 | 24d | 1 | 0.71mi |
| 1509 Park Blvd Camden, NJ | 1.0–2.0 | 1.0 | 1075 | $1,650 | $1.53 | 24d | 1 | 0.80mi |
| 457 Mechanic St Camden, NJ | 3.0 | 2.0 | 1200 | $1,950 | $1.62 | 18d | 1 | 0.97mi |
| 301 Champion Ave Oaklyn, NJ | 2.0 | 1.0 | 661 | $1,770 | $2.68 | 4d | 3 | 1.04mi |
| 221 Haddon Ave Collingswood, NJ | 4.0 | 2.0 | 1744 | $3,100 | $1.78 | 3d | 1 | 1.09mi |
| 708 Royden St Camden, NJ | 3.0 | 1.0 | 1113 | $1,595 | $1.43 | 17d | 1 | 1.10mi |
| 537 Newton Ave Camden, NJ | 2.0 | 1.0 | 1092 | $1,500 | $1.37 | 18d | 1 | 1.10mi |
| 537 Newton Ave Camden, NJ | 2.0 | 1.0 | 1092 | $1,500 | $1.37 | 12d | 1 | 1.10mi |
| 225 Haddon Ave Collingswood, NJ | 2.0 | 2.0 | 1211 | $3,372 | $2.78 | 1d | 6 | 1.11mi |
| 727 Berkley St Camden, NJ | 2.0 | 1.5 | 1008 | $1,660 | $1.65 | 24d | 1 | 1.16mi |
| 132 E Franklin Ave Unit A Collingswood, NJ | 2.0 | 1.0 | 1000 | $2,400 | $2.40 | 24d | 1 | 1.19mi |
| 2829 Idaho Rd Camden, NJ | 3.0 | 1.5 | 1048 | $1,700 | $1.62 | 24d | 1 | 1.22mi |
| 2892 N Constitution Rd Camden, NJ | 3.0 | 1.0 | 1040 | $2,000 | $1.92 | 24d | 1 | 1.23mi |
| 1220 Grant Ave Unit 2 Oaklyn, NJ | 2.0 | 1.0 | 1000 | $1,800 | $1.80 | 20d | 1 | 1.25mi |
| 430 Richey Ave Unit 1A Oaklyn, NJ | 2.0 | 1.0 | 897 | $2,100 | $2.34 | 4d | 1 | 1.27mi |
| 1034 Collings Ave Oaklyn, NJ | 2.0 | 1.0 | 1100 | $1,750 | $1.59 | 18d | 1 | 1.30mi |
| 609 Henry St Camden, NJ | 3.0 | 1.0 | 1290 | $1,600 | $1.24 | 24d | 1 | 1.32mi |
| 264 Boyd St Unit B Camden, NJ | 2.0 | 1.0 | 1616 | $1,700 | $1.05 | 24d | 1 | 1.39mi |
| 809 Eldridge Ave Unit 2 Oaklyn, NJ | 2.0 | 1.0 | 1720 | $2,050 | $1.19 | 24d | 1 | 1.40mi |
| 440 Henry St Camden, NJ | 3.0 | 1.5 | 1224 | $2,200 | $1.80 | 24d | 1 | 1.42mi |
| 3132 Independence Rd Camden, NJ | 3.0 | 1.5 | 1168 | $1,595 | $1.37 | 22d | 1 | 1.44mi |
| 1021 Monitor Rd Camden, NJ | 3.0 | 1.0 | 1012 | $1,710 | $1.69 | 24d | 1 | 1.50mi |
Listing history 14 events
-
2026-06-18days on market $115,000 Active 20 DOM
-
2026-06-17days on market $115,000 Active 19 DOM
-
2026-06-16days on market $115,000 Active 18 DOM
-
2026-06-15days on market $115,000 Active 17 DOM
-
2026-06-13days on market $115,000 Active 15 DOM
-
2026-06-13days on market $115,000 Active 14 DOM
-
2026-06-09days on market $115,000 Active 11 DOM
-
2026-06-08days on market $115,000 Active 10 DOM
-
2026-06-07days on market $115,000 Active 9 DOM
-
2026-06-04days on market $115,000 Active 6 DOM
-
2026-06-03days on market $115,000 Active 5 DOM
-
2026-06-02days on market $115,000 Active 4 DOM
-
2026-06-01days on market $115,000 Active 3 DOM
-
2026-05-31days on market $115,000 Active 2 DOM
ⓘ Source: listings_history table (triggers on properties + properties_extension) + one-shot
backfill from property_details.listing_events for pre-trigger history.
Tax reassessment forecast NJ · Partial reset (capped growth)
- Current annual tax
- $1,379 · $115/mo
- Projected year-2 tax
- $2,121 · $177/mo
- Expected delta
- +$742/yr (+$62/mo · 53.8%)
ⓘ Screening estimate from a state-policy table — verify with the county assessor before closing.
Climate risk First Street
- Flood 1/10 Low FEMA zone X (unshaded) · 0% chance over 30 yrs
- Wildfire 1/10 Low
- Heat 7/10 Severe 7 d/yr ≥103°F today · 15 d/yr by 30 yrs out
- Wind 6/10 Major 27% chance of damaging wind over 30 yrs
- Air quality 4/10 Moderate 5 unhealthy d/yr today · 6 by 30 yrs out
Nearby sold comps map
Loading sold comps map…
Walkable amenities ~0.75 mi
Loading nearby amenities…
Taxation est. · year 1
- Rental income
- $22,058
- − Mortgage interest
- −$6,442
- − Property taxes
- −$1,379
- − Insurance
- −$575
- − Repairs & maintenance
- −$1,765
- − Management
- −$1,765
- − Depreciation
- −$3,345
- Taxable income
- $6,787
- Est. tax owed @ 24.0%
- −$1,629
- After-tax cash flow
- $6,606/yr
For passive investors: Depreciation is non-cash, so a rental often shows a tax loss while cash-flowing — sheltering income. Rental losses are passive: they offset passive income freely, and up to $25,000/yr can offset ordinary (W-2) income if you actively participate and your MAGI is under $100k (phasing out to $0 by $150k); unused losses carry forward. On sale, claimed depreciation is recaptured at up to 25%, and gains may owe capital-gains tax (a 1031 exchange can defer both). Figures are a year-1 estimate at your 24.0% rate — not tax advice; consult a CPA.
Schools (NCES district)
- District
- Camden City School District
- NCES district ID
- 3402640
- Math proficiency
- 3% ▼ -6.00%
- Reading proficiency
- 16% ▬ 0.00%
- Median HH income
- $25,845
- Composite
- 6.85/100
- National rank
- #9981
- State rank
- #472 of 472 in NJ
Livability — Camden
- Score
- 70/100
- State rank
- #262
- US rank
- #7721
Category grades
Schools grade is shown separately in the Schools card above.
Census & demographics
- Census place
- Camden, NJ
- City population
- 20,865
- Population (ZIP)
- 21,508
Population outlook (Camden County) Hauer SSP2
- Today (2025)
- 507,964 people
- By 2030
- 502,182 · -1.1%
- By 2040
- 485,602 · -4.4%
- By 2050
- 465,630 · -8.3%
- By 2075
- 419,986 · -17.3%
- By 2100
- 369,492 · -27.3%
Race, ethnicity, and origin ACS 2023
- Neighborhood character
- Diverse neighborhood (Simpson 0.56)
- Race & ethnicity
- Black 53% Hispanic / Latino 40% Two or more races 9% White 2% Asian 1%
- Hispanic origin (detail)
- Mexican 2% Puerto Rican 22% Cuban 2% Dominican 9%
- Common ancestry
- Hispanic 2%
- Foreign-born
- 9% · Canada, Vietnam
- Languages at home
- 69% English-only · Spanish 29% Vietnamese 1%
Political lean MEDSL · Camden
- 2024 margin
- Strong D (+27.4) · D 63.0% · R 35.5% · Other 1.5%
- 2008→2024 swing
- -8.8pp toward R · 2008: 36.2pp · 2024: 27.4pp
- All cycles
- 2024: D+27.4 2020: D+33.5 2016: D+32.4 2012: D+36.6 2008: D+36.2
Not yet ingested
- Civics
- —
Market trends
- HPI YoY
- ▼ -123.43%
- Current HPI
- 209.3596
- Rent YoY
- —
- Metro
- —
- State GDP YoY
- ▲ 2.05%
- F500 in state
- 34
Industry mix (Fortune 500 HQ in NJ)
| Industry | F500 HQs | Revenue |
|---|---|---|
| Consumer Goods | 3 | $31B |
|
||
| Pharmaceuticals | 2 | $153B |
|
||
| Technology | 2 | $21B |
|
||
| Insurance | 2 | $20B |
|
||
| Healthcare | 2 | $19B |
|
||
| Financial Services | 1 | $70B |
|
||
Price history
+820.0% since first listed19 events — show timeline
- 2026-05-29 Listed $115,000 BRIGHT MLS
- 2024-10-30 Listing Removed — BRIGHT MLS
- 2024-10-15 Listed $35,000 BRIGHT MLS
- 2023-08-28 Pending — BRIGHT MLS
- 2023-08-28 Listing Removed — BRIGHT MLS
- 2023-08-22 Listed $24,900 BRIGHT MLS
- 2017-11-30 Sold (MLS) $4,000 TREND
- 2017-10-27 Pending — TREND
- 2017-10-01 Price Changed $4,900 TREND
- 2017-10-01 Relisted — TREND
- 2017-07-19 Delisted — TREND
- 2017-07-11 Price Changed $8,500 TREND
- 2017-07-07 Listed $10,500 TREND
- 2016-11-30 Listing Removed — BRIGHT MLS
- 2016-05-09 Listed $10,500 BRIGHT MLS
- 2001-07-09 Sold (Public Records) $45,000 Public Records
- 2000-09-30 Listing Removed — BRIGHT MLS
- 2000-06-28 Listed $65,900 BRIGHT MLS
- 1989-04-13 Sold (Public Records) $12,500 Public Records
Property tax history
+0.5%/yrLatest (2025): $1,379 · +4.1% YoY. Source: county tax records.
Cash-flow waterfall
monthlySold comps — $/sqft
last 12 mo · ≤1 miLoading sold comps…