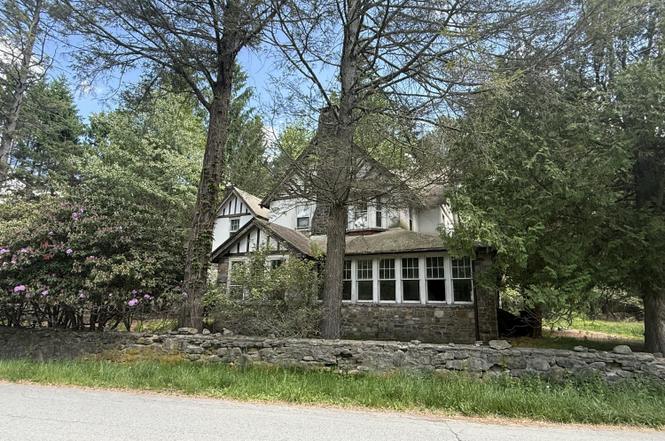
33 Knox St · Mount Pocono, PA
Flood risk 1/10 · Minimal
- FEMA flood zone
- X (unshaded)
- Chance of flooding over 30 yrs
- 0.0%
- Est. flood insurance / yr
- $507 – $1,088
Fire risk 4/10 · Minor
- Est. fire insurance / yr
- $511 – $949
Heat risk 2/10 · Minimal
- Hot days now (above 90°F)
- 7 days/yr
- Hot days in 30 yrs
- 15 days/yr
Wind risk 4/10 · Minor
- Chance of severe wind over 30 yrs
- 8.0%
Air-quality risk 2/10 · Minimal
- Unhealthy air days now
- 1 days/yr
- Unhealthy air days in 30 yrs
- 2 days/yr
Risk factors via First Street. Map © Google.
Why this score? — see what drove the A- grade
The composite is a weighted blend of 9 inputs, each scored 0–100. Each bar is that input's sub-score; the figure is the points it added to the 100-point composite (weight × sub-score).
- Cash flow +30.0/30.0
- ARV discount +15.0/15.0
- 1% rule +10.0/10.0
- DSCR +10.0/10.0
- Appreciation +5.3/10.0
- Schools +4.0/10.0
- Livability +3.9/5.0
- Rent growth +2.5/5.0
- Condition / age +2.5/5.0
$149,000
🖨 Deal sheet 📄 Offer letter ✓ Due diligence
Listing remarks
Great location!! Contractor special. 4 Bedroom 2 Baths in the Mount Pocono Borough. Public Water and Sewer. A nice sized yard, conveniently off the side streets of 611. Gorgeous stonework. This house requires a large amount of renovations. The property is being sold AS-IS and the buyer and or buyer's agent is to do their own due diligence. Cash only. Please see private remarks.
Key facts
- 0.76 acre lot
- Built 1921
- Listed 2 days
Property features AI
Finance
- Financial info: Annual tax approximately $8,647.27
Exterior
- Parking: Open parking
- Home design: Single-family residence; Residential property type
- Exterior features: Lot approximately 0.76 acres; Residential zoning
Interior
- Bedrooms: 3 full bathrooms
- Bathrooms: 3 full bathrooms
- Interior features: Unfurnished; 9 total rooms
Neighborhood map
What this means for you Summary
Snapshot
- This is a 4-bed/2.0-bath single-family listed at $149k.
Deal economics
- At list price, monthly cash flow is $1k ($14k/yr) — positive.
- The deal already cash-flows at list — no discount required.
- Meets the 1% rule at list price ($3k rent vs $149k).
- Cap rate 15.8% vs local median 5.1% in Mount Pocono — top-decile yield for the area; either an underpriced asset or a hidden risk that comps aren't pricing in. Stress-test before assuming the spread holds.
Location & tenants
- Location reads 77/100 on livability (#362 in PA, #3,166 nationally) — a middle-class / working-renter tenant base. Strengths: crime A+, cost of living A+, housing A+; Watch: schools F, commute F.
- Pocono Mountain SD (rural): math 37% / reading 55% proficiency, ranked #245 of 539 in PA (top 46%) — families likely to look elsewhere, expect single-tenant / working-renter base with shorter leases.
- Market conditions: 47 active listings in the ZIP; 1 comparable units currently listed for rent nearby; 278 units permitted in Monroe County in 2024 (52 in 5+ unit buildings).
Forward outlook
- In year one you build about $2k of equity ($1k loan paydown + $941 appreciation (0.6% local appreciation)).
- Monroe County population projected at -11% by 2050 — secular population decline; favor cash flow + early exit over multi-decade hold.
- At projected returns (0.6% appreciation + 3.0% rent growth), your $42k cash investment doubles in ~3 years — after that, you're playing with house money.
Negotiation context
- Only 3 days on market — expect competitive offers; lowballing is unlikely to land.
- 6 sale attempts since 18y ago with the ask held roughly flat each time — persistent listings suggest the price (not the market) is what's stuck; bring a comps-based counter.
Risks & watch-outs
- Watch-outs: built in 1921 — expect roof / HVAC / electrical / plumbing capex.
Questions for the listing agent
- Built in 1921 — when were the roof, HVAC, electrical panel, plumbing, and water heater last replaced?
- Is there a deadline driving the sale (1031 exchange, divorce, estate, relocation)? That informs how much negotiation room exists.
- Schools are F-rated, which usually means shorter tenancies and higher turnover. Who's the typical renter profile here, and what's been the actual vacancy rate?
- What's the average days-on-market for RENTAL listings here right now (not sales)? A rising rental-DOM trend means longer vacancies and softer asking-rent achievability than the comps imply.
- What's the recent tenant-quality profile in this submarket — average credit score on applications, eviction rate, late-payment / NSF rate, and stable-employment percentage? A property-management company in the area should have these aggregated.
- How much new for-sale + rental construction is in the pipeline within 1–3 miles? Heavy new supply typically softens prices + rents 12–24 months out; constrained supply supports both.
Investment metrics
- 1% rule
- 1.88% ✓
- Cap rate
- 15.81%
- Cash-on-cash
- 34.01%
- DSCR
- 2.51
- GRM
- 4.4
CMA / ARV
- ARV (on-the-fly)
- $270,592
- Comps found
- 9
Show comp detail 9 sales within ~0.75 mi
| Address | Dist | Beds/Ba | Sqft | Sold | Price | $/sf | Match |
|---|---|---|---|---|---|---|---|
| 22 Fairview Ave | 0.33mi | 4/1.5 | 2,490 (+3%) | 4mo | $252,500 | $101 | 75 |
| 1387 Pocono Blvd | 0.20mi | 4/2.0 | 2,241 (-7%) | 15mo | $246,900 | $110 | 66 |
| 115 Knob Rd | 0.35mi | 5/2.0 (+1) | 2,748 (+14%) | 6mo | $340,000 | $124 | 50 |
| 441 Manor View Ave | 0.71mi | 3/3.0 (-1) | 2,400 (-1%) | 12mo | $245,000 | $102 | 47 |
| 43 Reeder St | 0.54mi | 3/2.5 (-1) | 2,366 (-2%) | 22mo | $365,000 | $154 | 46 |
| 74 Center Ave | 0.61mi | 3/2.0 (-1) | 2,605 (+8%) | 10mo | $320,000 | $123 | 45 |
| 45 Church Ave Ave | 0.48mi | 4/2.5 | 2,748 (+14%) | 13mo | $400,000 | $146 | 42 |
| 40 Fairview Ave | 0.41mi | 3/1.5 (-1) | 2,130 (-12%) | 19mo | $215,000 | $101 | 38 |
| 47 Holly Forest Rd | 0.61mi | 3/2.5 (-1) | 2,236 (-8%) | 17mo | $250,000 | $112 | 38 |
Match score weights: distance 35% · size 25% · config 20% · recency 20%. Top-matched comps best support the ARV.
Projected returns pro-forma
0.63% appreciation · 3.0% rent growth · sell at horizon
- IRR
- 35.8%
- Equity multiple
- 2.81×
- Total profit
- $75,462
- Equity at exit
- $48,028
- IRR
- 38.4%
- Equity multiple
- 5.50×
- Total profit
- $187,591
- Equity at exit
- $61,685
Cash invested: $41,720 (down + closing). Projections, not guarantees.
Landlord ↔ Tenant lean methodology
- Overall (STATE)
- 62 Landlord-Friendly
- State Pennsylvania
- 62 Landlord-Friendly · EVEN
- County
- — inherits STATE
- City
- — inherits STATE
ZIP-level market 18344
- Home prices YoY
- 0.3%
- Active inventory
- 47
- Price-to-rent
- 4.4×
Monthly cashflow live
- Estimated rent
- $2,800 medium interval (Pro) →
- Mortgage (P&I)
- −$781
- Tax est. 1.5%
- −$186 /mo · $2,235/yr
- Insurance
- −$62
- HOA
- −$0
- Vacancy / Maint / Mgmt
- −$588
- Net cashflow
- $1,182
Break-even live
UW: 25.0% down · 7.5% · 30yr · 1.5% tax · 5.0% vac · 8.0% maint · 8.0% mgmt
Financing live
Cash to close
- Down payment
- $37,250
- Closing costs
- $4,470
- Reserves months
- —
- Total cash needed
- —
Loan-product check · same deal, 3 products live
Conventional
25% down · 7.5% · 30yr
- Down + closing
- —
- Monthly P&I
- —
- Monthly cashflow
- —
- DSCR
- —
- Eligible?
- —
Personal DTI + credit; lowest rate.
DSCR
20% down · 8.5% · 30yr
- Down + closing
- —
- Monthly P&I
- —
- Monthly cashflow
- —
- DSCR
- —
- Eligible?
- —
No personal income docs; deal must DSCR.
Hard money
10% down · 12.0% · 12mo
- Down + closing
- —
- Monthly P&I
- —
- Monthly cashflow
- —
- DSCR
- —
- Eligible?
- —
Short-term bridge; refi at stabilization.
Rent comps 1 comps
| Address | Beds | Baths | Sqft | Rent | $/sqft | DOM | Units | Dist |
|---|---|---|---|---|---|---|---|---|
| 5 Deerfield Dr Mt Pocono, PA | 3.0 | 2.5 | 1686 | $2,800 | $1.66 | 43d | 1 | 1.01mi |
Listing history 5 events
-
2026-06-19days on market $149,000 Active 3 DOM
-
2026-06-18days on market $149,000 Active 2 DOM
-
2026-06-17remarks 380-char remark
-
2026-06-17remarks 354-char remark
-
2026-06-17$149,000 Active 1 DOM
ⓘ Source: listings_history table (triggers on properties + properties_extension) + one-shot
backfill from property_details.listing_events for pre-trigger history.
Climate risk First Street
- Flood 1/10 Low FEMA zone X (unshaded) · 0% chance over 30 yrs
- Wildfire 4/10 Moderate
- Heat 2/10 Low 7 d/yr ≥90°F today · 15 d/yr by 30 yrs out
- Wind 4/10 Moderate 8% chance of damaging wind over 30 yrs
- Air quality 2/10 Low 1 unhealthy d/yr today · 2 by 30 yrs out
Nearby sold comps map
Loading sold comps map…
Walkable amenities ~0.75 mi
Loading nearby amenities…
Taxation est. · year 1
- Rental income
- $33,600
- − Mortgage interest
- −$8,346
- − Property taxes
- −$2,235
- − Insurance
- −$745
- − Repairs & maintenance
- −$2,688
- − Management
- −$2,688
- − Depreciation
- −$4,335
- Taxable income
- $12,563
- Est. tax owed @ 24.0%
- −$3,015
- After-tax cash flow
- $11,172/yr
For passive investors: Depreciation is non-cash, so a rental often shows a tax loss while cash-flowing — sheltering income. Rental losses are passive: they offset passive income freely, and up to $25,000/yr can offset ordinary (W-2) income if you actively participate and your MAGI is under $100k (phasing out to $0 by $150k); unused losses carry forward. On sale, claimed depreciation is recaptured at up to 25%, and gains may owe capital-gains tax (a 1031 exchange can defer both). Figures are a year-1 estimate at your 24.0% rate — not tax advice; consult a CPA.
Schools (NCES district)
- District
- Pocono Mountain SD
- NCES district ID
- 4219500
- Math proficiency
- 37% ▼ -5.00%
- Reading proficiency
- 55% ▲ 1.00%
- Median HH income
- $55,317
- Composite
- 39.91/100
- National rank
- #3856
- State rank
- #245 of 539 in PA
Livability — Mount Pocono
- Score
- 77/100
- State rank
- #362
- US rank
- #3166
Category grades
Schools grade is shown separately in the Schools card above.
Census & demographics
- Census place
- Mount Pocono, PA
- Population (ZIP)
- 3,472
Population outlook (Monroe County) Hauer SSP2
- Today (2025)
- 164,099 people
- By 2030
- 161,412 · -1.6%
- By 2040
- 154,616 · -5.8%
- By 2050
- 146,710 · -10.6%
- By 2075
- 140,830 · -14.2%
- By 2100
- 138,472 · -15.6%
Race, ethnicity, and origin ACS 2023
- Neighborhood character
- Highly diverse neighborhood (Simpson 0.70)
- Race & ethnicity
- White 47% Hispanic / Latino 22% Black 15% Asian 9% Two or more races 8%
- Hispanic origin (detail)
- Puerto Rican 7% Dominican 1%
- Common ancestry
- Romanian 3% Italian 2% Hispanic 1%
- Foreign-born
- 17% · Canada
- Languages at home
- 67% English-only · Spanish 19% Other Indo-European 7% Tagalog/Filipino 3%
Political lean MEDSL · Monroe
- 2024 margin
- Toss-up / Even · D 49.1% · R 49.9%
- 2008→2024 swing
- -17.1pp toward R · 2008: 16.3pp · 2024: -0.8pp
- All cycles
- 2024: R+0.8 2020: D+6.4 2016: D+0.3 2012: D+14.0 2008: D+16.3
Not yet ingested
- Civics
- —
Market trends
- HPI YoY
- ▲ 0.63%
- Current HPI
- 179.2541
- Rent YoY
- —
- Metro
- —
- State GDP YoY
- ▲ 1.68%
- F500 in state
- 34
Industry mix (Fortune 500 HQ in PA)
| Industry | F500 HQs | Revenue |
|---|---|---|
| Healthcare | 2 | $309B |
|
||
| Insurance | 2 | $27B |
|
||
| Telecommunications / Media | 1 | $124B |
|
||
| Industrial Distribution | 1 | $22B |
|
||
| Financial Services | 1 | $20B |
|
||
| Chemicals / Materials | 1 | $18B |
|
||
Price history
+10.4% since first listed8 events — show timeline
- 2026-05-19 Listed $149,000 PMAR
- 2025-11-15 Listing Removed — GLVRMLS
- 2011-04-11 Listed $249,000 PMAR
- 2010-11-11 Listed $329,000 PMAR
- 2009-04-03 Listed $350,000 PMAR
- 2009-04-03 Listed $350,000 GLVRMLS
- 2008-06-20 Listed $367,000 PMAR
- 1996-07-16 Sold (Public Records) $135,000 Public Records
Property tax history
+2.0%/yrLatest (2026): $8,590 · +2.9% YoY. Source: county tax records.
Cash-flow waterfall
monthlySold comps — $/sqft
last 12 mo · ≤1 miLoading sold comps…