None · Barrington, IL
Flood risk No data
- FEMA flood zone
- —
- Chance of flooding over 30 yrs
- —
- Est. flood insurance / yr
- —
Fire risk No data
- Est. fire insurance / yr
- —
Heat risk No data
- Hot days now (above threshold)
- —
- Hot days in 30 yrs
- —
Wind risk No data
- Chance of severe wind over 30 yrs
- —
Air-quality risk No data
- Unhealthy air days now
- —
- Unhealthy air days in 30 yrs
- —
Risk factors via First Street. Map © Google.
Why this score? — see what drove the D- grade
The composite is a weighted blend of 9 inputs, each scored 0–100. Each bar is that input's sub-score; the figure is the points it added to the 100-point composite (weight × sub-score).
- Cash flow +13.0/30.0
- Schools +4.7/10.0
- Condition / age +4.0/5.0
- DSCR +3.9/10.0
- Livability +3.9/5.0
- 1% rule +3.7/10.0
- Rent growth +2.5/5.0
- ARV discount +1.8/15.0
- Appreciation +0.0/10.0
$285,000
🖨 Deal sheet 📄 Offer letter ✓ Due diligence
Key facts
- Garage
- Built 1972
Property features AI
Exterior
- Parking: Includes a garage
- Utilities: Central air conditioning
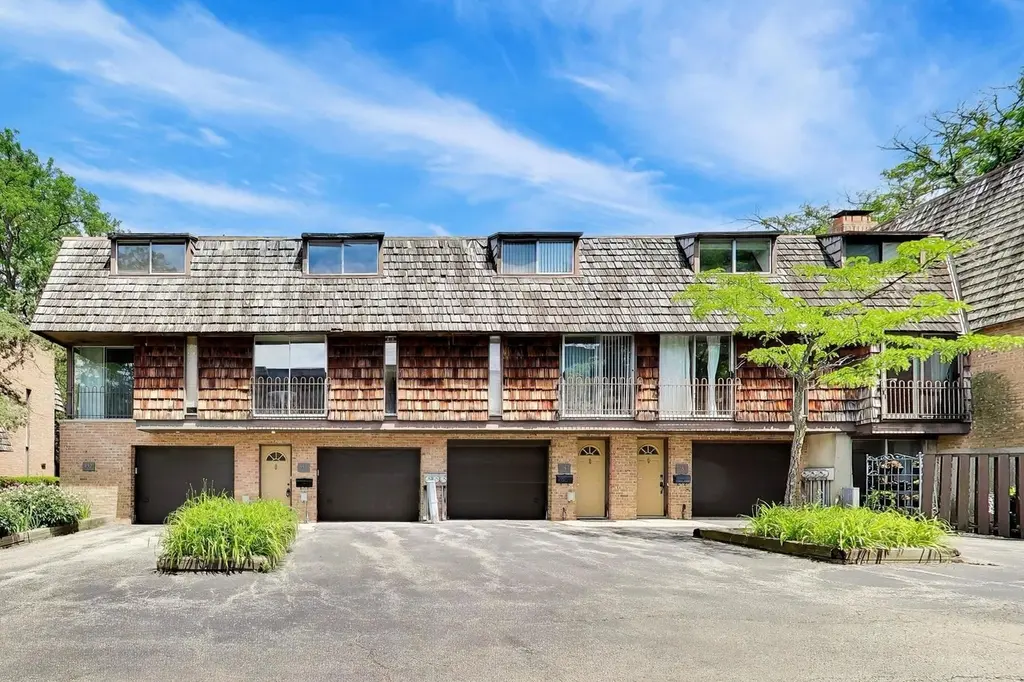
- Home design: Townhouse; 3 floors in the building
Interior
- Bedrooms: 2 bedrooms
- Bathrooms: 1.5 bathrooms
- Heating & cooling: Central air conditioning
- Interior features: Building has a fitness center; Central air conditioning
Neighborhood map
What this means for you Summary
Snapshot
- This is a 2-bed/1.5-bath townhouse listed at $285k. Condition is rated good.
Deal economics
- At list price, monthly cash flow is $-15 ($-174/yr) — negative.
- To cash-flow at today's rent, offer at most $283k (0.7% below list).
- To meet the 1% rule (rent ≥ 1% of price), the offer needs to be $247k (13.2% below list).
- Recommended offer: $247k (13.2% below list) — sets the bar for 1% rule.
- Cap rate 6.2% vs local median 2.4% in Barrington — top-decile yield for the area; either an underpriced asset or a hidden risk that comps aren't pricing in. Stress-test before assuming the spread holds.
Location & tenants
- Location reads 77/100 on livability (#156 in IL, #2,854 nationally) — a middle-class / working-renter tenant base. Strengths: crime A+, employment A+, schools A; Watch: health & safety D+, amenities D-, cost of living F.
- Barrington CUSD 220 (suburban): math 46% / reading 49% proficiency, ranked #42 of 620 in IL (top 7%) — families likely to look elsewhere, expect single-tenant / working-renter base with shorter leases; only 16% free/reduced lunch — higher-income household profile.
- Market conditions: 243 active listings in the ZIP; 17 comparable units currently listed for rent nearby; rentals at typical pace (median 21d on market — plan ~3-4 weeks tenant-placement turnaround); high-income renter base; 6,272 units permitted in Cook County in 2024 (4,658 in 5+ unit buildings).
- This rent is only 17% of the median local income ($178k/yr) — well below the 30% rent-burden line; pricing power to push rent on renewal without tenant pushback.
Forward outlook
- Local home prices are declining (-3.0%/yr); year-one equity from $2k of loan paydown is wiped out by about $9k of value loss. Plan a longer hold.
Negotiation context
- Only 4 days on market — expect competitive offers; lowballing is unlikely to land.
Questions for the listing agent
- What do current leases actually rent for vs. the listed asking? Can we see a recent rent roll and the last 12 months of T-12 income?
- Built in 1972 — when were the roof, HVAC, electrical panel, plumbing, and water heater last replaced?
- Is there a deadline driving the sale (1031 exchange, divorce, estate, relocation)? That informs how much negotiation room exists.
- Schools are A-rated — typically a magnet for longer-tenancy family renters. What's the average tenant stay here, and is there a school-zone premium baked into asking?
- The area grade is low — what's the realistic commute time and amenity access for the typical tenant pool here? Any planned neighborhood developments (good or bad) we should know about?
- What's the average days-on-market for RENTAL listings here right now (not sales)? A rising rental-DOM trend means longer vacancies and softer asking-rent achievability than the comps imply.
- What's the recent tenant-quality profile in this submarket — average credit score on applications, eviction rate, late-payment / NSF rate, and stable-employment percentage? A property-management company in the area should have these aggregated.
- How much new for-sale + rental construction is in the pipeline within 1–3 miles? Heavy new supply typically softens prices + rents 12–24 months out; constrained supply supports both.
Investment metrics
- 1% rule
- 0.87% ✗
- Cap rate
- 6.23%
- Cash-on-cash
- -0.22%
- DSCR
- 0.99
- GRM
- 9.6
CMA / ARV
- ARV (on-the-fly)
- $252,938
- Comps found
- 4
Show comp detail 4 sales within ~0.75 mi
| Address | Dist | Beds/Ba | Sqft | Sold | Price | $/sf | Match |
|---|---|---|---|---|---|---|---|
| 600 W Russell St #306 | 0.11mi | 2/1.5 | 1,160 (-7%) | 1mo | $235,000 | $203 | 82 |
| 600 W Russell St #210 | 0.11mi | 2/1.5 | 1,160 (-7%) | 2mo | $231,500 | $200 | 82 |
| 600 W Russell St #105 | 0.11mi | 2/1.5 | 1,160 (-7%) | 3mo | $229,000 | $197 | 81 |
| 600 W Russell St #101 | 0.11mi | 2/1.5 | 1,100 (-12%) | 8mo | $235,000 | $214 | 68 |
Match score weights: distance 35% · size 25% · config 20% · recency 20%. Top-matched comps best support the ARV.
Projected returns pro-forma
-3.0% appreciation · 3.0% rent growth · sell at horizon
- IRR
- -16.6%
- Equity multiple
- 0.41×
- Total profit
- $-47,069
- Equity at exit
- $42,494
- IRR
- -8.4%
- Equity multiple
- 0.47×
- Total profit
- $-42,024
- Equity at exit
- $24,642
Cash invested: $79,800 (down + closing). Projections, not guarantees.
Landlord ↔ Tenant lean methodology
- Overall (STATE)
- 43 Moderately Tenant-Leaning
- State Illinois
- 43 Moderately Tenant-Leaning · D+7
- County
- — inherits STATE
- City
- — inherits STATE
ZIP-level market 60010
- Active inventory
- 243
- Price-to-rent
- 9.6×
Monthly cashflow live
- Estimated rent
- $2,475 high interval (Pro) →
- Mortgage (P&I)
- −$1,495
- Tax est. 1.5%
- −$356 /mo · $4,275/yr
- Insurance
- −$119
- HOA
- −$0
- Vacancy / Maint / Mgmt
- −$520
- Net cashflow
- $-15
Break-even live
UW: 25.0% down · 7.5% · 30yr · 1.5% tax · 5.0% vac · 8.0% maint · 8.0% mgmt
Financing live
Cash to close
- Down payment
- $71,250
- Closing costs
- $8,550
- Reserves months
- —
- Total cash needed
- —
Loan-product check · same deal, 3 products live
Conventional
25% down · 7.5% · 30yr
- Down + closing
- —
- Monthly P&I
- —
- Monthly cashflow
- —
- DSCR
- —
- Eligible?
- —
Personal DTI + credit; lowest rate.
DSCR
20% down · 8.5% · 30yr
- Down + closing
- —
- Monthly P&I
- —
- Monthly cashflow
- —
- DSCR
- —
- Eligible?
- —
No personal income docs; deal must DSCR.
Hard money
10% down · 12.0% · 12mo
- Down + closing
- —
- Monthly P&I
- —
- Monthly cashflow
- —
- DSCR
- —
- Eligible?
- —
Short-term bridge; refi at stabilization.
Rent comps 17 comps
| Address | Beds | Baths | Sqft | Rent | $/sqft | DOM | Units | Dist |
|---|---|---|---|---|---|---|---|---|
| 600 W Russell St #210 Barrington, IL | 2.0 | 1.5 | 1160 | $2,300 | $1.98 | 24d | 1 | 0.11mi |
| 320 W Main St Unit 2 Barrington, IL | 1.0 | 1.0 | 700 | $1,700 | $2.43 | 44d | 1 | 0.24mi |
| 115 N Hager Ave Barrington, IL | 3.0 | 2.0 | 1473 | $3,400 | $2.31 | 44d | 1 | 0.29mi |
| 100 E Station St #316 Barrington, IL | 2.0 | 2.0 | 1455 | $3,000 | $2.06 | 24d | 1 | 0.42mi |
| 101 W Liberty St Barrington, IL | 1.0–2.0 | 1.0–2.0 | 991 | $3,250 | $3.28 | 1d | 16 | 0.52mi |
| 327 E Lake St Unit 327 Barrington, IL | 3.0 | 1.0 | 1000 | $2,350 | $2.35 | 5d | 1 | 0.54mi |
| 327 E Lake St Barrington, IL | 3.0 | 1.0 | 1000 | $2,350 | $2.35 | 10d | 1 | 0.54mi |
| 212 Franklin St Barrington, IL | 1.0 | 1.0 | 960 | $2,295 | $2.39 | 24d | 1 | 0.56mi |
| 212 Franklin St Barrington, IL | 1.0 | 1.0 | 960 | $2,295 | $2.39 | 44d | 1 | 0.56mi |
| 212 Franklin St Unit 2 Barrington, IL | 1.0 | 1.0 | 960 | $2,295 | $2.39 | 1d | 1 | 0.57mi |
| 336 E Russell St Unit 2 Barrington, IL | 3.0 | 2.0 | 1475 | $2,700 | $1.83 | 5d | 1 | 0.57mi |
| 342 E Russell St Unit 2 Barrington, IL | 3.0 | 1.5 | 1400 | $2,400 | $1.71 | 24d | 1 | 0.59mi |
| 510 Shorely Dr #201 Barrington, IL | 2.0 | 2.0 | 1200 | $2,490 | $2.08 | 10d | 1 | 0.78mi |
| 510 Shorely Dr #201 Barrington, IL | 2.0 | 2.0 | 1200 | $2,390 | $1.99 | 2d | 1 | 0.78mi |
| 530 Shorely Dr #104 Barrington, IL | 2.0 | 2.0 | 1100 | $2,300 | $2.09 | 44d | 1 | 0.81mi |
| 528 E Main St Barrington, IL | 2.0 | 1.5 | 1200 | $2,200 | $1.83 | 21d | 1 | 0.86mi |
| 738 Concord Ln Barrington, IL | 2.0–3.0 | 1.5 | 1695 | $2,100 | $1.24 | 1d | 9 | 0.89mi |
Listing history 3 events
-
2026-06-09days on market $285,000 Coming Soon 4 DOM
-
2026-06-08days on market $285,000 Coming Soon 3 DOM
-
2026-06-07$285,000 Coming Soon 2 DOM
ⓘ Source: listings_history table (triggers on properties + properties_extension) + one-shot
backfill from property_details.listing_events for pre-trigger history.
Nearby sold comps map
Loading sold comps map…
Walkable amenities ~0.75 mi
Loading nearby amenities…
Taxation est. · year 1
- Rental income
- $29,697
- − Mortgage interest
- −$15,964
- − Property taxes
- −$4,275
- − Insurance
- −$1,425
- − Repairs & maintenance
- −$2,376
- − Management
- −$2,376
- − Depreciation
- −$8,291
- Taxable loss
- −$5,010
- Est. tax savings @ 24.0%
- +$1,202
- After-tax cash flow
- $1,028/yr
For passive investors: Depreciation is non-cash, so a rental often shows a tax loss while cash-flowing — sheltering income. Rental losses are passive: they offset passive income freely, and up to $25,000/yr can offset ordinary (W-2) income if you actively participate and your MAGI is under $100k (phasing out to $0 by $150k); unused losses carry forward. On sale, claimed depreciation is recaptured at up to 25%, and gains may owe capital-gains tax (a 1031 exchange can defer both). Figures are a year-1 estimate at your 24.0% rate — not tax advice; consult a CPA.
Condition & rehab AI · 13 photos
This townhouse is in good condition with minimal repairs needed. It's move-in ready with a good curb appeal and fresh paint. Value-adding updates include exterior painting and cleaning gutters.
Value-add opportunities
- Both Paint exterior — Enhances curb appeal and value
- Both Clean gutters — Improves drainage and aesthetics
- Both Replace window screens — Enhances energy efficiency and safety
Renovation cost estimate screening
Value-add ROI direction
- Both Paint exterior — Enhances curb appeal and value ↑
- Both Clean gutters — Improves drainage and aesthetics ↑
- Both Replace window screens — Enhances energy efficiency and safety ↑
ⓘ Cost ranges are severity-bucket heuristics (US national rule-of-thumb). Get contractor quotes + a written scope before underwriting a rehab budget.
Schools (NCES district)
- District
- Barrington CUSD 220
- NCES district ID
- 1705050
- Math proficiency
- 46% ▼ -10.00%
- Reading proficiency
- 49% ▼ -11.00%
- Median HH income
- $114,016
- Composite
- 46.83/100
- National rank
- #2376
- State rank
- #42 of 620 in IL
Livability — Barrington
- Score
- 77/100
- State rank
- #156
- US rank
- #2854
Category grades
Schools grade is shown separately in the Schools card above.
Census & demographics
- Census place
- Barrington, IL
- County
- Lake County · 591,991 people
- City population
- 45,747
- Metro
- Chicago-Naperville-Elgin, IL-IN-WI
- Population (ZIP)
- 45,747
- Household income
- $177,566
- Rent vs Own
- Severe rent burden
- 553.0
Population outlook (Cook County) Hauer SSP2
- Today (2025)
- 5,347,519 people
- By 2030
- 5,357,703 · +0.2%
- By 2040
- 5,324,924 · -0.4%
- By 2050
- 5,230,762 · -2.2%
- By 2075
- 4,785,735 · -10.5%
- By 2100
- 4,188,836 · -21.7%
Race, ethnicity, and origin ACS 2023
- Neighborhood character
- Predominantly White (77%)
- Race & ethnicity
- White 77% Asian 14% Two or more races 5% Hispanic / Latino 4%
- Common ancestry
- Romanian 11% Slovak 2% Portuguese 2%
- Foreign-born
- 17% · South Korea, China, Canada
- Languages at home
- 79% English-only · Other Indo-European 5% Russian/Polish/Slavic 5% Other Asian/Pacific 3%
Political lean MEDSL · Cook
- 2024 margin
- Solid D (+42.0) · D 70.4% · R 28.4% · Other 1.2%
- 2008→2024 swing
- -11.4pp toward R · 2008: 53.4pp · 2024: 42.0pp
- All cycles
- 2024: D+42.0 2020: D+50.3 2016: D+53.0 2012: D+49.4 2008: D+53.4
Not yet ingested
- Civics
- —
Market trends
- HPI YoY
- ▼ -179.65%
- Current HPI
- 181.3706
- Rent YoY
- —
- Metro
- Chicago-Naperville-Elgin, IL-IN-WI
- State GDP YoY
- ▲ 1.59%
- F500 in state
- 60
Industry mix (Fortune 500 HQ in IL)
| Industry | F500 HQs | Revenue |
|---|---|---|
| Insurance | 4 | $201B |
|
||
| Consumer Goods | 4 | $87B |
|
||
| Industrial Machinery | 3 | $64B |
|
||
| Healthcare | 2 | $55B |
|
||
| Retail / Pharmacy | 1 | $148B |
|
||
| Agriculture / Food | 1 | $86B |
|
||
Cash-flow waterfall
monthlySold comps — $/sqft
last 12 mo · ≤1 miLoading sold comps…