2205 E Linden St. #30 Trlr 30 · Caldwell, ID
Flood risk 1/10 · Minimal
- FEMA flood zone
- X (unshaded)
- Chance of flooding over 30 yrs
- 0.0%
- Est. flood insurance / yr
- $507 – $1,088
Fire risk 1/10 · Minimal
- Est. fire insurance / yr
- $584 – $1,086
Heat risk 5/10 · Moderate
- Hot days now (above 98°F)
- 7 days/yr
- Hot days in 30 yrs
- 18 days/yr
Wind risk 1/10 · Minimal
- Chance of severe wind over 30 yrs
- —
Air-quality risk 7/10 · Major
- Unhealthy air days now
- 9 days/yr
- Unhealthy air days in 30 yrs
- 16 days/yr
Risk factors via First Street. Map © Google.
Why this score? — see what drove the B- grade
The composite is a weighted blend of 9 inputs, each scored 0–100. Each bar is that input's sub-score; the figure is the points it added to the 100-point composite (weight × sub-score).
- Cash flow +27.6/30.0
- 1% rule +10.0/10.0
- DSCR +9.7/10.0
- ARV discount +7.5/15.0
- Livability +3.4/5.0
- Rent growth +3.2/5.0
- Condition / age +2.5/5.0
- Schools +2.0/10.0
- Appreciation +0.0/10.0
$102,900
🖨 Deal sheet 📄 Offer letter ✓ Due diligence
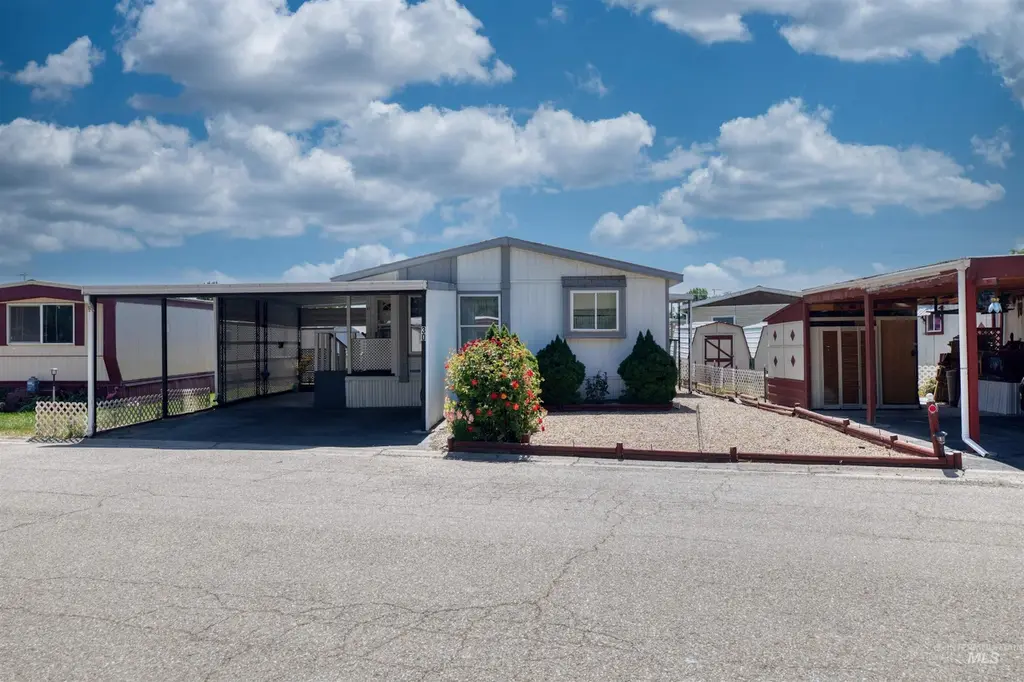
Listing remarks
Located in a wonderful 55+ community, this home is just 5 minutes from shopping, restaurants, hospitals, and freeway access. The well-maintained residence includes two storage sheds and a carport with space for two vehicles. A covered ramp and patio provide safe and easy access to the home. Inside, you'll find two generously sized rooms and two full bathrooms. The dining area opens into a spacious kitchen that offers display space for your favorite items. The kitchen also houses a built-in work desk with shelves above for additional storage or display space. A wonderful living room is adjacent to the dining area. This affordable home has a monthly space/park rent of $410, which includes wat
Key facts
- Covered ramp
- Community clubhouse
- Spacious kitchen
Tags
Property features AI
Finance
- Other: Private paved road frontage
- HOA & community: Located in Mobile Estates, an over-55 community
Exterior
- Parking: Attached garage; Carport (1 space); Finished driveway; 1 covered parking space
- Utilities: City water; Sewer connected; Cable connected; Broadband internet
- Home design: Mobile/manufactured home in a rented-lot community; Located in an over-55 mobile home park
- Construction: Built in 1993; Composition and metal roof
- Exterior features: Partial wood fencing; Storage shed; Bus service on city route
Interior
- Kitchen: Dishwasher; Disposal; Freestanding oven/range; Breakfast bar; Laminate countertops
- Bedrooms: 2 bedrooms on the main level
- Flooring: Carpet; Laminate; Vinyl
- Bathrooms: 2 bathrooms
- Heating & cooling: Electric forced-air heating; Central air conditioning
- Interior features: Master bath with double vanity; Great room; Breakfast bar; Laminate countertops; Bath in master bedroom; Accessible approach with ramp; Bathroom grab bars
- Laundry & utility: Utility room on the main level; Electric water heater
Neighborhood map
What this means for you Summary
Snapshot
- This is a 3-bed/2.0-bath manufactured listed at $103k.
Deal economics
- At list price, monthly cash flow is $306 ($4k/yr) — positive.
- The deal already cash-flows at list — no discount required.
- Meets the 1% rule at list price ($2k rent vs $103k).
- Recommended offer: $101k (1.5% below list) — sets the bar for market timing.
- Cap rate 9.9% vs local median 3.1% in Caldwell — top-decile yield for the area; either an underpriced asset or a hidden risk that comps aren't pricing in. Stress-test before assuming the spread holds.
Location & tenants
- Location reads 67/100 on livability (#88 in ID) — a middle-class / working-renter tenant base. Strengths: cost of living A+, housing A+; Watch: crime C-, employment D+, amenities F.
- Caldwell District (suburban): math 17% / reading 31% proficiency, ranked #90 of 92 in ID (top 98%) — low school quality limits family demand, transient renter base, plan for 1-2y turnover; 72% free/reduced lunch — lower-income household profile, screen leases tightly.
- Zoned schools: Lincoln Elementary School (math 17% / reading 17%, grade F, #349 of 357 statewide, top 98%, 322 students, 88% FRL); Caldwell Senior High School (math 16% / reading 38%, grade F, #131 of 169 statewide, top 77%, 1,474 students, 76% FRL).
- Market conditions: Rents rising (+2.7%/yr); 341 active listings in the ZIP; 30 comparable units currently listed for rent nearby; rentals leasing fast (median 12d on market — plan ~1-2 weeks tenant-placement turnaround); 3,620 units permitted in Canyon County in 2024 (196 in 5+ unit buildings).
Forward outlook
- Local home prices are declining (-3.0%/yr); year-one equity from $711 of loan paydown is wiped out by about $3k of value loss. Plan a longer hold.
- Canyon County population projected at +41% by 2050 — long-run rental-demand tailwind backs the buy-and-hold thesis.
- At projected returns (-3.0% appreciation + 2.7% rent growth), your $29k cash investment doubles in ~10 years — after that, you're playing with house money.
Negotiation context
- It's been on market 30 days — a 2% lower offer ($101k) is reasonable based on typical stale-listing flexibility.
Risks & watch-outs
- Watch-outs: HOA is 24% of rent.
- Climate carrying-cost: extreme-heat days projected 7→18/yr by 2055 (HVAC capex compounding) — expect insurance premiums to compound above CPI over the hold.
Questions for the listing agent
- What does the HOA fee cover, when was the last increase, and are there any pending special assessments or reserve-fund shortfalls?
- Is there a deadline driving the sale (1031 exchange, divorce, estate, relocation)? That informs how much negotiation room exists.
- Schools are D-rated, which usually means shorter tenancies and higher turnover. Who's the typical renter profile here, and what's been the actual vacancy rate?
- What's the average days-on-market for RENTAL listings here right now (not sales)? A rising rental-DOM trend means longer vacancies and softer asking-rent achievability than the comps imply.
- What's the recent tenant-quality profile in this submarket — average credit score on applications, eviction rate, late-payment / NSF rate, and stable-employment percentage? A property-management company in the area should have these aggregated.
- How much new for-sale + rental construction is in the pipeline within 1–3 miles? Heavy new supply typically softens prices + rents 12–24 months out; constrained supply supports both.
Investment metrics
- 1% rule
- 1.63% ✓
- Cap rate
- 9.87%
- Cash-on-cash
- 12.76%
- DSCR
- 1.57
- GRM
- 5.1
CMA / ARV
- ARV (on-the-fly)
- $251,940
- Comps found
- 4
Show comp detail 4 sales within ~0.75 mi
| Address | Dist | Beds/Ba | Sqft | Sold | Price | $/sf | Match |
|---|---|---|---|---|---|---|---|
| 2205 E Linden St #78 | 0.00mi | 2/2.0 (-1) | 1,152 (+1%) | 9mo | $110,000 | $95 | 86 |
| 2205 E Linden St #80 | 0.00mi | 2/2.0 (-1) | 1,080 (-5%) | 13mo | $119,900 | $111 | 75 |
| 2422 Red Robin | 0.38mi | 3/2.0 | 1,080 (-5%) | 10mo | $300,000 | $278 | 65 |
| 3003 Golden Glow Dr | 0.48mi | 3/2.0 | 1,198 (+5%) | 11mo | $265,000 | $221 | 60 |
Match score weights: distance 35% · size 25% · config 20% · recency 20%. Top-matched comps best support the ARV.
Projected returns pro-forma
-3.0% appreciation · 2.69% rent growth · sell at horizon
- IRR
- 2.3%
- Equity multiple
- 1.09×
- Total profit
- $2,533
- Equity at exit
- $15,343
- IRR
- 11.6%
- Equity multiple
- 1.91×
- Total profit
- $26,077
- Equity at exit
- $8,897
Cash invested: $28,812 (down + closing). Projections, not guarantees.
Landlord ↔ Tenant lean methodology
- Overall (STATE)
- 91 Strongly Landlord-Friendly
- State Idaho
- 91 Strongly Landlord-Friendly · R+18
- County
- — inherits STATE
- City
- — inherits STATE
ZIP-level market 83605
- Home prices YoY
- -27.0%
- Rents YoY
- 2.7%
- Active inventory
- 341
- Price-to-rent
- 5.1×
Monthly cashflow live
- Estimated rent
- $1,676 high interval (Pro) →
- Mortgage (P&I)
- −$540
- Tax from tax record
- −$26 /mo · $306/yr
- Insurance
- −$43
- HOA
- −$410
- Vacancy / Maint / Mgmt
- −$352
- Net cashflow
- $306
Break-even live
UW: 25.0% down · 7.5% · 30yr · 1.5% tax · 5.0% vac · 8.0% maint · 8.0% mgmt
Financing live
Cash to close
- Down payment
- $25,725
- Closing costs
- $3,087
- Reserves months
- —
- Total cash needed
- —
Loan-product check · same deal, 3 products live
Conventional
25% down · 7.5% · 30yr
- Down + closing
- —
- Monthly P&I
- —
- Monthly cashflow
- —
- DSCR
- —
- Eligible?
- —
Personal DTI + credit; lowest rate.
DSCR
20% down · 8.5% · 30yr
- Down + closing
- —
- Monthly P&I
- —
- Monthly cashflow
- —
- DSCR
- —
- Eligible?
- —
No personal income docs; deal must DSCR.
Hard money
10% down · 12.0% · 12mo
- Down + closing
- —
- Monthly P&I
- —
- Monthly cashflow
- —
- DSCR
- —
- Eligible?
- —
Short-term bridge; refi at stabilization.
Rent comps 30 comps
| Address | Beds | Baths | Sqft | Rent | $/sqft | DOM | Units | Dist |
|---|---|---|---|---|---|---|---|---|
| 2100 E Maple St Caldwell, ID | 1.0–3.0 | 1.0–1.5 | 930 | $1,350 | $1.45 | 3d | 1 | 0.15mi |
| 2003 E Linden St Unit 2 Caldwell, ID | 2.0 | 1.0 | 930 | $1,250 | $1.34 | 14d | 1 | 0.21mi |
| 2609 Red Robin Way Caldwell, ID | 3.0 | 2.0 | 936 | $1,650 | $1.76 | 12d | 1 | 0.38mi |
| 2110 Ison Ct Unit 1460913P Caldwell, ID | 3.0 | 2.5 | 1216 | $3,510 | $2.89 | 12d | 1 | 0.51mi |
| 2106 Ison Ct Unit 1460907P Caldwell, ID | 2.0 | 2.0 | 957 | $3,066 | $3.20 | 12d | 1 | 0.51mi |
| 3304 S Florida Ave Caldwell, ID | 3.0 | 1.0 | 1000 | $1,395 | $1.40 | 23d | 1 | 0.65mi |
| 2121 S Montana Ave Unit C Caldwell, ID | 2.0 | 2.0 | 1000 | $1,595 | $1.59 | 10d | 1 | 0.66mi |
| 3114 Iowa Ave Unit 1 Caldwell, ID | 3.0 | 1.0 | 1020 | $1,500 | $1.47 | 14d | 1 | 0.68mi |
| 1810 Dearborn St Caldwell, ID | 2.0 | 2.0 | 1436 | $1,600 | $1.11 | 14d | 1 | 0.70mi |
| 1704 Blaine St Unit B Caldwell, ID | 3.0 | 1.0 | 1274 | $1,900 | $1.49 | 3d | 1 | 0.79mi |
| 1704 Blaine St Unit A Caldwell, ID | 3.0 | 2.0 | 1469 | $2,125 | $1.45 | 14d | 1 | 0.79mi |
| 3123 Village Green St Caldwell, ID | 3.0 | 2.0 | 1216 | $1,995 | $1.64 | 3d | 1 | 0.90mi |
| 3203 Village Green St Caldwell, ID | 3.0 | 2.0 | 1200 | $1,895 | $1.58 | 23d | 1 | 0.90mi |
| 2420 Robert Ave Caldwell, ID | 3.0 | 1.0 | 1100 | $1,545 | $1.40 | 23d | 1 | 0.95mi |
| 2422 Robert Ave Caldwell, ID | 2.0 | 1.0 | 796 | $1,250 | $1.57 | 23d | 1 | 0.95mi |
| 3721 Pierre Ave Caldwell, ID | 3.0 | 2.0 | 1167 | $1,900 | $1.63 | 14d | 1 | 0.99mi |
| 3919 Thatcher Ln Caldwell, ID | 1.0–3.0 | 1.0–2.0 | 1074 | $1,895 | $1.76 | 3d | 41 | 1.02mi |
| 1305 E Belmont St Unit B Caldwell, ID | 2.0 | 1.0 | 712 | $1,100 | $1.54 | 23d | 1 | 1.17mi |
| 516 Rooster Ln Caldwell, ID | 2.0 | 2.0 | 940 | $1,450 | $1.54 | 3d | 1 | 1.19mi |
| 1513 Indian Springs St Unit N302 Caldwell, ID | 2.0 | 2.0 | 1023 | $1,550 | $1.52 | 3d | 1 | 1.19mi |
| 511 Rooster Ln Caldwell, ID | 2.0 | 2.0 | 940 | $1,450 | $1.54 | 3d | 1 | 1.21mi |
| 2720 Blackfoot Ln Caldwell, ID | 2.0 | 2.0 | 940 | $1,425 | $1.52 | 19d | 1 | 1.24mi |
| 4005 Washington Ave Caldwell, ID | 2.0 | 1.5 | 900 | $1,535 | $1.71 | 21d | 1 | 1.26mi |
| 2809 Blackfoot Ln Caldwell, ID | 2.0 | 2.0 | 966 | $1,450 | $1.50 | 3d | 1 | 1.27mi |
| 1002 Everett St Caldwell, ID | 2.0 | 1.0 | 962 | $1,125 | $1.17 | 10d | 1 | 1.29mi |
| 4612 Lexington Sky Ln Caldwell, ID | 2.0 | 2.0 | 985 | $1,445 | $1.47 | 3d | 1 | 1.40mi |
| 3810 S 10th Ave Unit 101 Caldwell, ID | 3.0 | 2.5 | 1217 | $1,795 | $1.47 | 3d | 1 | 1.47mi |
| 3906 Brian Ave Unit 206 Caldwell, ID | 2.0 | 2.0 | 990 | $1,500 | $1.52 | 3d | 1 | 1.48mi |
| 3810 S 10th Ave Unit 102 Caldwell, ID | 3.0 | 2.5 | 1214 | $1,795 | $1.48 | 23d | 1 | 1.49mi |
| 1110 S Kimball Ave Caldwell, ID | 2.0 | 1.0 | 1066 | $1,350 | $1.27 | 3d | 5 | 1.49mi |
HOA detail
- Monthly dues
- $410 · $4,920/yr
Listing history 15 events
-
2026-06-18days on market $102,900 Active 30 DOM
-
2026-06-17pricedays on market $102,900 Active 29 DOM
-
2026-06-16days on market $108,900 Active 28 DOM
-
2026-06-15days on market $108,900 Active 27 DOM
-
2026-06-13days on market $108,900 Active 25 DOM
-
2026-06-13days on market $108,900 Active 24 DOM
-
2026-06-10days on market $108,900 Active 22 DOM
-
2026-06-09days on market $108,900 Active 21 DOM
-
2026-06-08days on market $108,900 Active 20 DOM
-
2026-06-07days on market $108,900 Active 19 DOM
-
2026-06-03pricedays on market $108,900 Active 15 DOM
-
2026-06-03days on market $112,999 Active 14 DOM
-
2026-06-01days on market $112,999 Active 13 DOM
-
2026-05-31days on market $112,999 Active 12 DOM
-
2026-05-19$115,000 Active
ⓘ Source: listings_history table (triggers on properties + properties_extension) + one-shot
backfill from property_details.listing_events for pre-trigger history.
Tax reassessment forecast ID · Resets to sale price
- Current annual tax
- $306 · $26/mo
- Projected year-2 tax
- $710 · $59/mo
- Expected delta
- +$404/yr (+$34/mo · 131.9%)
ⓘ Screening estimate from a state-policy table — verify with the county assessor before closing.
Climate risk First Street
- Flood 1/10 Low FEMA zone X (unshaded) · 0% chance over 30 yrs
- Wildfire 1/10 Low
- Heat 5/10 Major 7 d/yr ≥98°F today · 18 d/yr by 30 yrs out
- Wind 1/10 Low
- Air quality 7/10 Severe 9 unhealthy d/yr today · 16 by 30 yrs out
Nearby sold comps map
Loading sold comps map…
Walkable amenities ~0.75 mi
Loading nearby amenities…
Taxation est. · year 1
- Rental income
- $20,118
- − Mortgage interest
- −$5,764
- − Property taxes
- −$306
- − Insurance
- −$514
- − Repairs & maintenance
- −$1,609
- − Management
- −$1,609
- − HOA
- −$4,920
- − Depreciation
- −$2,993
- Taxable income
- $2,401
- Est. tax owed @ 24.0%
- −$576
- After-tax cash flow
- $3,101/yr
For passive investors: Depreciation is non-cash, so a rental often shows a tax loss while cash-flowing — sheltering income. Rental losses are passive: they offset passive income freely, and up to $25,000/yr can offset ordinary (W-2) income if you actively participate and your MAGI is under $100k (phasing out to $0 by $150k); unused losses carry forward. On sale, claimed depreciation is recaptured at up to 25%, and gains may owe capital-gains tax (a 1031 exchange can defer both). Figures are a year-1 estimate at your 24.0% rate — not tax advice; consult a CPA.
Schools (NCES district)
- District
- Caldwell District
- NCES district ID
- 1600510
- Math proficiency
- 17% ▼ -11.00%
- Reading proficiency
- 31% ▼ -4.00%
- Median HH income
- $36,116
- Composite
- 19.85/100
- National rank
- #8694
- State rank
- #90 of 92 in ID
Livability — Caldwell
- Score
- 67/100
- State rank
- #88
- US rank
- #10145
Category grades
Schools grade is shown separately in the Schools card above.
Census & demographics
- Census place
- Caldwell, ID
- County
- Canyon County · 235,358 people
- City population
- 76,816
- Metro
- Boise City, ID
- Population (ZIP)
- 41,325
- Household income
- $68,427
- Rent vs Own
- Severe rent burden
- 719.0
Population outlook (Canyon County) Hauer SSP2
- Today (2025)
- 248,853 people
- By 2030
- 269,596 · +8.3%
- By 2040
- 311,081 · +25.0%
- By 2050
- 350,809 · +41.0%
- By 2075
- 441,884 · +77.6%
- By 2100
- 505,641 · +103.2%
Race, ethnicity, and origin ACS 2023
- Neighborhood character
- Diverse neighborhood (Simpson 0.56)
- Race & ethnicity
- White 51% Hispanic / Latino 42% Two or more races 15% Native American 1%
- Hispanic origin (detail)
- Mexican 36%
- Common ancestry
- Lithuanian 3% Slovak 2% Italian 2%
- Foreign-born
- 13% · Canada
- Languages at home
- 71% English-only · Spanish 27% Russian/Polish/Slavic 1%
Political lean MEDSL · Canyon
- 2024 margin
- Solid R (+46.6) · D 25.4% · R 72.0% · Other 2.5%
- 2008→2024 swing
- -11.4pp toward R · 2008: -35.2pp · 2024: -46.6pp
- All cycles
- 2024: R+46.6 2020: R+39.7 2016: R+41.8 2012: R+37.1 2008: R+35.2
Not yet ingested
- Civics
- —
Market trends
- HPI YoY
- ▼ -135.47%
- Current HPI
- 366.7896
- Rent YoY
- ▲ 2.69%
- Metro
- Boise City, ID
- State GDP YoY
- ▲ 4.51%
- F500 in state
- 6
Industry mix (Fortune 500 HQ in ID)
| Industry | F500 HQs | Revenue |
|---|---|---|
| Retail | 1 | $79B |
|
||
| Technology | 1 | $25B |
|
||
| Food / Agriculture | 1 | $6B |
|
||
Price history
1 event — show timeline
- 2026-05-19 Listed $115,000 IMLS
Property tax history
+1.2%/yrLatest (2025): $306 · +20.4% YoY. Source: county tax records.
Cash-flow waterfall
monthlySold comps — $/sqft
last 12 mo · ≤1 miLoading sold comps…