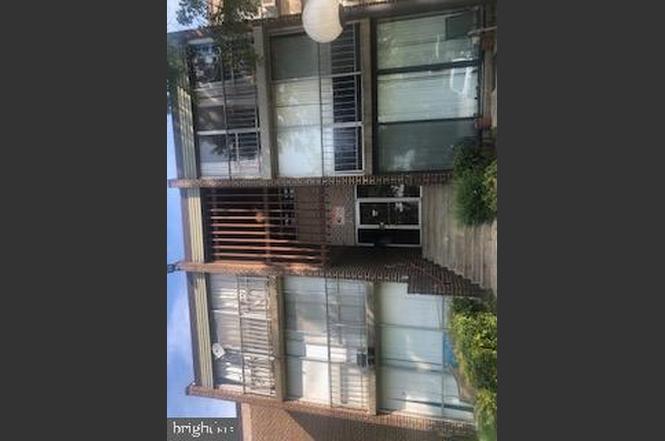
7959 Riggs Rd Unit 7959-1 · Langley Park, MD
Flood risk 1/10 · Minimal
- FEMA flood zone
- X (unshaded)
- Chance of flooding over 30 yrs
- 0.0%
- Est. flood insurance / yr
- $507 – $1,088
Fire risk 1/10 · Minimal
- Est. fire insurance / yr
- $755 – $1,403
Heat risk 7/10 · Major
- Hot days now (above 105°F)
- 7 days/yr
- Hot days in 30 yrs
- 15 days/yr
Wind risk 4/10 · Minor
- Chance of severe wind over 30 yrs
- 19.0%
Air-quality risk 4/10 · Minor
- Unhealthy air days now
- 5 days/yr
- Unhealthy air days in 30 yrs
- 6 days/yr
Risk factors via First Street. Map © Google.
Why this score? — see what drove the C- grade
The composite is a weighted blend of 9 inputs, each scored 0–100. Each bar is that input's sub-score; the figure is the points it added to the 100-point composite (weight × sub-score).
- Cash flow +18.7/30.0
- 1% rule +10.0/10.0
- ARV discount +7.5/15.0
- DSCR +5.9/10.0
- Livability +3.7/5.0
- Rent growth +2.9/5.0
- Condition / age +2.2/5.0
- Schools +1.7/10.0
- Appreciation +0.0/10.0
$75,000
🖨 Deal sheet 📄 Offer letter ✓ Due diligence
Listing remarks
Excellent Opportunity- This property needs a purchaser with vision to add his or her personal touch. Location is close to shopping, new Purple Line, Langley Park and tons of bars and restaurants. In addition, minutes from the University of Md. This is a Fannie Mae property. Call agent before showing.
Key facts
- Bars and restaurants
- New purple line
- Close to shopping
Tags
Property features AI
Finance
- Other: Improvement assessed value reported; Land assessed value reported; County tax and tax year recorded
- HOA & community: Monthly HOA fee of $847; HOA covers common area maintenance, custodial services/maintenance, exterior building maintenance, lawn maintenance, sewer, snow removal, trash, and other services; HOA amenities include an outdoor pool
Exterior
- Parking: Off-street parking; Parking lot
- Utilities: Public water; Public sewer
- Home design: Condominium ownership; Finished above-grade area recorded (788); Finished area source: Assessor; Living area source: Assessor; Year built source: Assessor; Not on tidal water; Located outside city limits; Directions: University Blvd to Riggs Rd
- Construction: Brick and block construction
- Exterior features: Community outdoor pool; Above- and below-grade other structures
Interior
- Bedrooms: 2 bedrooms on the main level
- Bathrooms: 1 full bathroom on the main level; 1 full bathroom total
- Heating & cooling: Forced air heating; Natural gas heating; Central air conditioning (electric); Natural gas hot water
- Interior features: No basement; Accessibility features present (unspecified)
Neighborhood map
What this means for you Summary
Snapshot
- This is a 2-bed/1.0-bath condo listed at $75k. Condition is rated fair.
Deal economics
- At list price, monthly cash flow is $74 ($883/yr) — positive.
- The deal already cash-flows at list — no discount required.
- Meets the 1% rule at list price ($2k rent vs $75k).
- Cap rate 7.5% vs local median 4.2% in Langley Park — top-decile yield for the area; either an underpriced asset or a hidden risk that comps aren't pricing in. Stress-test before assuming the spread holds.
Location & tenants
- Location reads 74/100 on livability (#110 in MD, #4,438 nationally) — a middle-class / working-renter tenant base. Strengths: commute A+, housing A+, health & safety A+; Watch: schools F, crime F.
- Prince George'S County Public Schools (suburban): math 8% / reading 24% proficiency, ranked #21 of 24 in MD (top 88%) — low school quality limits family demand, transient renter base, plan for 1-2y turnover.
- Market conditions: Rents rising (+1.7%/yr); 92 active listings in the ZIP; 40 comparable units currently listed for rent nearby; rentals at typical pace (median 18d on market — plan ~3-4 weeks tenant-placement turnaround); solid renter incomes; 1,481 units permitted in Prince George's County in 2024 (0 in 5+ unit buildings).
Forward outlook
- Local home prices are declining (-3.0%/yr); year-one equity from $519 of loan paydown is wiped out by about $2k of value loss. Plan a longer hold.
- Prince George's County population projected at +18% by 2050 — long-run rental-demand tailwind backs the buy-and-hold thesis.
Negotiation context
- Only 7 days on market — expect competitive offers; lowballing is unlikely to land.
Risks & watch-outs
- Watch-outs: HOA is 47% of rent.
- Climate carrying-cost: extreme-heat days projected 7→15/yr by 2055 (HVAC capex compounding) — expect insurance premiums to compound above CPI over the hold.
Questions for the listing agent
- Have any recent inspections been done? Can we get a copy of the seller's disclosures and any deferred-maintenance estimates?
- Built in 1968 — when were the roof, HVAC, electrical panel, plumbing, and water heater last replaced?
- What does the HOA fee cover, when was the last increase, and are there any pending special assessments or reserve-fund shortfalls?
- Any open or pending special assessments — roof, HVAC, plumbing, elevator, façade? What's the per-unit balance and payoff schedule, and is the seller paying it off at close or rolling it to the buyer?
- Is there a deadline driving the sale (1031 exchange, divorce, estate, relocation)? That informs how much negotiation room exists.
- Schools are F-rated, which usually means shorter tenancies and higher turnover. Who's the typical renter profile here, and what's been the actual vacancy rate?
- Crime grade is F in this area — have there been break-ins, vandalism, or insurance claims at this property in the last 3 years? What carrier currently insures it and at what premium?
- What's the average days-on-market for RENTAL listings here right now (not sales)? A rising rental-DOM trend means longer vacancies and softer asking-rent achievability than the comps imply.
- What's the recent tenant-quality profile in this submarket — average credit score on applications, eviction rate, late-payment / NSF rate, and stable-employment percentage? A property-management company in the area should have these aggregated.
- How much new apartment / multifamily construction is in the pipeline within 1–3 miles? Heavy new supply (>2% of stock underway) typically softens rents 12–24 months out; light construction supports rent growth.
Investment metrics
- 1% rule
- 2.43% ✓
- Cap rate
- 7.47%
- Cash-on-cash
- 4.20%
- DSCR
- 1.19
- GRM
- 3.4
CMA / ARV
No comps found within radius.
Projected returns pro-forma
-3.0% appreciation · 1.73% rent growth · sell at horizon
- IRR
- -12.4%
- Equity multiple
- 0.56×
- Total profit
- $-9,219
- Equity at exit
- $11,183
- IRR
- -7.6%
- Equity multiple
- 0.57×
- Total profit
- $-8,962
- Equity at exit
- $6,485
Cash invested: $21,000 (down + closing). Projections, not guarantees.
Landlord ↔ Tenant lean methodology
- Overall (STATE)
- 27 Tenant-Leaning
- State Maryland
- 27 Tenant-Leaning · D+14
- County
- — inherits STATE
- City
- — inherits STATE
ZIP-level market 20783
- Rents YoY
- 1.7%
- Active inventory
- 92
- Price-to-rent
- 3.4×
Monthly cashflow live
- Estimated rent
- $1,821 high interval (Pro) →
- Mortgage (P&I)
- −$393
- Tax est. 1.5%
- −$94 /mo · $1,125/yr
- Insurance
- −$31
- HOA
- −$847
- Vacancy / Maint / Mgmt
- −$382
- Net cashflow
- $74
Break-even live
UW: 25.0% down · 7.5% · 30yr · 1.5% tax · 5.0% vac · 8.0% maint · 8.0% mgmt
Financing live
Cash to close
- Down payment
- $18,750
- Closing costs
- $2,250
- Reserves months
- —
- Total cash needed
- —
Loan-product check · same deal, 3 products live
Conventional
25% down · 7.5% · 30yr
- Down + closing
- —
- Monthly P&I
- —
- Monthly cashflow
- —
- DSCR
- —
- Eligible?
- —
Personal DTI + credit; lowest rate.
DSCR
20% down · 8.5% · 30yr
- Down + closing
- —
- Monthly P&I
- —
- Monthly cashflow
- —
- DSCR
- —
- Eligible?
- —
No personal income docs; deal must DSCR.
Hard money
10% down · 12.0% · 12mo
- Down + closing
- —
- Monthly P&I
- —
- Monthly cashflow
- —
- DSCR
- —
- Eligible?
- —
Short-term bridge; refi at stabilization.
Rent comps 40 comps
| Address | Beds | Baths | Sqft | Rent | $/sqft | DOM | Units | Dist |
|---|---|---|---|---|---|---|---|---|
| 2200 Phelps Rd Adelphi, MD | 1.0–2.0 | 1.0 | 586 | $2,155 | $3.67 | 2d | 49 | 0.13mi |
| 1801 Jasmine Ter Hyattsville, MD | 1.0–2.0 | 1.0 | 610 | $2,307 | $3.78 | 3d | 29 | 0.17mi |
| 2213 University Blvd E Hyattsville, MD | 1.0 | 1.0 | 580 | $1,304 | $2.25 | 4d | 3 | 0.29mi |
| 7405 18th Ave Unit 108 Hyattsville, MD | 2.0 | 1.0 | 660 | $1,699 | $2.57 | 43d | 1 | 0.37mi |
| 1400 University Blvd E Hyattsville, MD | 1.0–2.0 | 1.0 | 762 | $1,888 | $2.48 | 2d | 50 | 0.40mi |
| 8100 15th Ave Hyattsville, MD | 1.0–3.0 | 1.0–1.5 | 1002 | $1,765 | $1.76 | 1d | 45 | 0.40mi |
| 7302 Riggs Rd #204 Hyattsville, MD | 2.0 | 1.0 | 530 | $1,350 | $2.55 | 43d | 1 | 0.45mi |
| 8007 14th Ave Hyattsville, MD | 1.0 | 1.0 | 579 | $1,525 | $2.63 | 2d | 2 | 0.55mi |
| 7312 15th Pl Takoma Park, MD | 2.0 | 1.0 | 966 | $2,400 | $2.48 | 15d | 1 | 0.57mi |
| 7333 New Hampshire Ave Unit 816S Takoma Park, MD | 1.0 | 1.0 | 720 | $1,800 | $2.50 | 43d | 1 | 0.69mi |
| 7333 New Hampshire Ave Unit AVE601 Takoma Park, MD | 1.0 | 1.0 | 902 | $1,850 | $2.05 | 43d | 1 | 0.69mi |
| 8111 Tahona Dr Silver Spring, MD | 1.0–2.0 | 1.0 | 775 | $1,695 | $2.19 | 1d | 7 | 0.89mi |
| 7004 Highview Ter Chillum, MD | 1.0–2.0 | 1.0 | 869 | $1,570 | $1.81 | 3d | 7 | 0.89mi |
| 1017 Merrimac Dr Silver Spring, MD | 1.0–2.0 | 1.0 | 772 | $1,927 | $2.49 | 10d | 10 | 0.92mi |
| 1120 Quebec St Silver Spring, MD | 1.0 | 1.0 | 1100 | $1,250 | $1.14 | 24d | 1 | 0.98mi |
| 1120 Quebec St Unit 1 Silver Spring, MD | 3.0 | 1.0 | 1100 | $2,550 | $2.32 | 18d | 1 | 0.98mi |
| 1207-07 Myrtle Ave Takoma Park, MD | 1.0 | 1.0 | 645 | $1,397 | $2.17 | 43d | 1 | 0.99mi |
| 8500 New Hampshire Ave Silver Spring, MD | 2.0 | 1.0 | 870 | $1,846 | $2.12 | 5d | 1 | 1.09mi |
| 3400 Dean Dr Hyattsville, MD | 1.0–2.0 | 1.0 | 700 | $1,795 | $2.56 | 3d | 1 | 1.14mi |
| 6916 New Hampshire Ave Takoma Park, MD | 3.0 | 2.0 | 1080 | $3,200 | $2.96 | 43d | 1 | 1.15mi |
| 6821 Red Top Rd Takoma Park, MD | 2.0–3.0 | 1.0–2.0 | 950 | $1,595 | $1.68 | 5d | 4 | 1.16mi |
| 951 East-West Hwy Takoma Park, MD | 1.0–2.0 | 1.0 | 775 | $1,495 | $1.93 | 10d | 2 | 1.19mi |
| 7313 Flower Ave Unit 3 Takoma Park, MD | 1.0 | 1.0 | 725 | $1,257 | $1.73 | 43d | 1 | 1.21mi |
| 6808 Red Top Rd Unit 6814-005 Takoma Park, MD | 1.0 | 1.0 | 600 | $1,325 | $2.21 | 24d | 1 | 1.23mi |
| 6808 Red Top Rd Unit 6814-006 Takoma Park, MD | 1.0 | 1.0 | 600 | $1,250 | $2.08 | 24d | 1 | 1.23mi |
| 6808 Red Top Rd Takoma Park, MD | 1.0 | 1.0 | 600 | $1,350 | $2.25 | 43d | 3 | 1.23mi |
| 6808 Red Top Rd Unit 6812-003 Takoma Park, MD | 1.0 | 1.0 | 600 | $1,450 | $2.42 | 24d | 1 | 1.23mi |
| 921 Prospect St Apt 5 Takoma Park, MD | 2.0 | 1.0 | 702 | $1,925 | $2.74 | 5d | 1 | 1.25mi |
| 790 Fairview Ave Takoma Park, MD | 1.0–2.0 | 1.0–1.5 | 894 | $1,799 | $2.01 | 43d | 3 | 1.26mi |
| 9120 Piney Branch Rd Silver Spring, MD | 1.0–3.0 | 1.0–1.5 | 703 | $1,862 | $2.65 | 2d | 35 | 1.28mi |
| 7902 Garland Ave Unit 2 Takoma Park, MD | 1.0 | 1.0 | 600 | $1,450 | $2.42 | 43d | 1 | 1.28mi |
| 702 Chaney Dr Unit 303 Takoma Park, MD | 2.0 | 1.0 | 1006 | $1,495 | $1.49 | 43d | 1 | 1.30mi |
| 702 Chaney Dr Unit 306 Takoma Park, MD | 3.0 | 1.0 | 1000 | $1,810 | $1.81 | 24d | 1 | 1.30mi |
| 8007 Garland Ave Apt 3 Takoma Park, MD | 1.0 | 1.0 | 650 | $1,450 | $2.23 | 43d | 1 | 1.31mi |
| 9200 Edwards Way Unit 1115 Hyattsville, MD | 2.0 | 1.0 | 1013 | $1,945 | $1.92 | 17d | 1 | 1.32mi |
| 9200 Edwards Way Adelphi, MD | 1.0 | 1.0 | 1012 | $1,775 | $1.75 | 10d | 2 | 1.33mi |
| 9200 Edwards Way Adelphi, MD | 1.0 | 1.0 | 1009 | $1,775 | $1.76 | 5d | 2 | 1.33mi |
| 3350 Toledo Ter Hyattsville, MD | 3.0 | 1.0–2.0 | 921 | $2,421 | $2.63 | 2d | 21 | 1.34mi |
| 3420 Toledo Ter Hyattsville, MD | 3.0 | 1.0–2.0 | 912 | $2,512 | $2.75 | 2d | 21 | 1.34mi |
| 3450 Toledo Ter Hyattsville, MD | 2.0 | 1.0–1.5 | 917 | $1,622 | $1.77 | 24d | 1 | 1.35mi |
HOA detail condo
- Monthly dues
- $847 · $10,164/yr
- Assessments
- None detected in remarks — confirm with the listing agent.
Listing history 6 events
-
2026-06-18days on market $75,000 Active 7 DOM
-
2026-06-17days on market $75,000 Active 6 DOM
-
2026-06-16days on market $75,000 Active 5 DOM
-
2026-06-15days on market $75,000 Active 4 DOM
-
2026-06-13remarks 301-char remark
-
2026-06-13$75,000 Active 2 DOM
ⓘ Source: listings_history table (triggers on properties + properties_extension) + one-shot
backfill from property_details.listing_events for pre-trigger history.
Climate risk First Street
- Flood 1/10 Low FEMA zone X (unshaded) · 0% chance over 30 yrs
- Wildfire 1/10 Low
- Heat 7/10 Severe 7 d/yr ≥105°F today · 15 d/yr by 30 yrs out
- Wind 4/10 Moderate 19% chance of damaging wind over 30 yrs
- Air quality 4/10 Moderate 5 unhealthy d/yr today · 6 by 30 yrs out
Nearby sold comps map
Loading sold comps map…
Walkable amenities ~0.75 mi
Loading nearby amenities…
Taxation est. · year 1
- Rental income
- $21,856
- − Mortgage interest
- −$4,201
- − Property taxes
- −$1,125
- − Insurance
- −$375
- − Repairs & maintenance
- −$1,748
- − Management
- −$1,748
- − HOA
- −$10,164
- − Depreciation
- −$2,182
- Taxable income
- $312
- Est. tax owed @ 24.0%
- −$75
- After-tax cash flow
- $808/yr
For passive investors: Depreciation is non-cash, so a rental often shows a tax loss while cash-flowing — sheltering income. Rental losses are passive: they offset passive income freely, and up to $25,000/yr can offset ordinary (W-2) income if you actively participate and your MAGI is under $100k (phasing out to $0 by $150k); unused losses carry forward. On sale, claimed depreciation is recaptured at up to 25%, and gains may owe capital-gains tax (a 1031 exchange can defer both). Figures are a year-1 estimate at your 24.0% rate — not tax advice; consult a CPA.
Condition & rehab AI · 7 photos
This townhouse requires moderate renovations, including painting, updating the interior walls, and landscaping. Improvements in these areas can significantly increase its resale and rental value.
Repairs flagged
- Major Painting — The paint is peeling and there are visible stains and marks on the interior walls.
- Major Landscaping — The landscaping is overgrown and in poor condition, which negatively impacts the property's curb appeal.
Value-add opportunities
- Resale Painting and updating the interior walls — Updating the interior walls with fresh paint can significantly improve the property's appearance and appeal to potential buyers.
- Rental Landscaping and yard maintenance — A well-maintained yard and landscaping can attract more tenants and improve the property's rental value.
Renovation cost estimate screening
| Repair item | Severity | Est. cost |
|---|---|---|
| Painting · The paint is peeling and there are visible stains and marks on the interior walls. | Major | $15,000–50,000 |
| Landscaping · The landscaping is overgrown and in poor condition, which negatively impacts the property's curb appeal. | Major | $15,000–50,000 |
| Total estimated repair cost · 2 items | $30,000–100,000 |
Value-add ROI direction
- Resale Painting and updating the interior walls — Updating the interior walls with fresh paint can significantly improve the property's appearance and appeal to potential buyers. ↑
- Rental Landscaping and yard maintenance — A well-maintained yard and landscaping can attract more tenants and improve the property's rental value. ↑
ⓘ Cost ranges are severity-bucket heuristics (US national rule-of-thumb). Get contractor quotes + a written scope before underwriting a rehab budget.
Schools (NCES district)
- District
- Prince George'S County Public Schools
- NCES district ID
- 2400510
- Math proficiency
- 8% ▼ -11.00%
- Reading proficiency
- 24% ▼ -9.00%
- Median HH income
- $73,967
- Composite
- 16.82/100
- National rank
- #9151
- State rank
- #21 of 24 in MD
Livability — Langley Park
- Score
- 74/100
- State rank
- #110
- US rank
- #4438
Category grades
Schools grade is shown separately in the Schools card above.
Census & demographics
- Census place
- Langley Park, MD
- County
- Prince Georges County · 919,866 people
- City population
- 50,333
- Metro
- Washington-Arlington-Alexandria, DC-VA-MD-WV
- Population (ZIP)
- 50,333
- Household income
- $86,737
- Rent vs Own
- Severe rent burden
- 2222.0
Population outlook (Prince George's County) Hauer SSP2
- Today (2025)
- 1,005,426 people
- By 2030
- 1,048,416 · +4.3%
- By 2040
- 1,123,425 · +11.7%
- By 2050
- 1,183,220 · +17.7%
- By 2075
- 1,306,202 · +29.9%
- By 2100
- 1,408,179 · +40.1%
Race, ethnicity, and origin ACS 2023
- Neighborhood character
- Predominantly Hispanic (68%)
- Race & ethnicity
- Hispanic / Latino 68% Black 22% Two or more races 9% White 5% Asian 3%
- Hispanic origin (detail)
- Mexican 2% Dominican 2%
- Common ancestry
- Hispanic 1%
- Foreign-born
- 60% · Canada, Jamaica, United Kingdom
- Languages at home
- 21% English-only · Spanish 66% French/Haitian/Cajun 5% Other Indo-European 1%
Political lean MEDSL · Prince George's
- 2024 margin
- Solid D (+75.2) · D 86.3% · R 11.2% · Other 2.5%
- 2008→2024 swing
- -3.3pp toward R · 2008: 78.5pp · 2024: 75.2pp
- All cycles
- 2024: D+75.2 2020: D+80.5 2016: D+81.0 2012: D+80.9 2008: D+78.5
Not yet ingested
- Civics
- —
Market trends
- HPI YoY
- ▼ -269.12%
- Current HPI
- 313.7836
- Rent YoY
- ▲ 1.73%
- Metro
- Washington-Arlington-Alexandria, DC-VA-MD-WV
- State GDP YoY
- ▲ 2.97%
- F500 in state
- 12
Industry mix (Fortune 500 HQ in MD)
| Industry | F500 HQs | Revenue |
|---|---|---|
| Aerospace / Defense | 1 | $71B |
|
||
| Utilities | 1 | $25B |
|
||
| Hotels | 1 | $24B |
|
||
| Consumer Goods | 1 | $7B |
|
||
| Real Estate | 1 | $6B |
|
||
| Chemicals | 1 | $2B |
|
||
Price history
1 event — show timeline
- 2026-06-11 Listed $75,000 BRIGHT MLS
Cash-flow waterfall
monthlySold comps — $/sqft
last 12 mo · ≤1 miLoading sold comps…