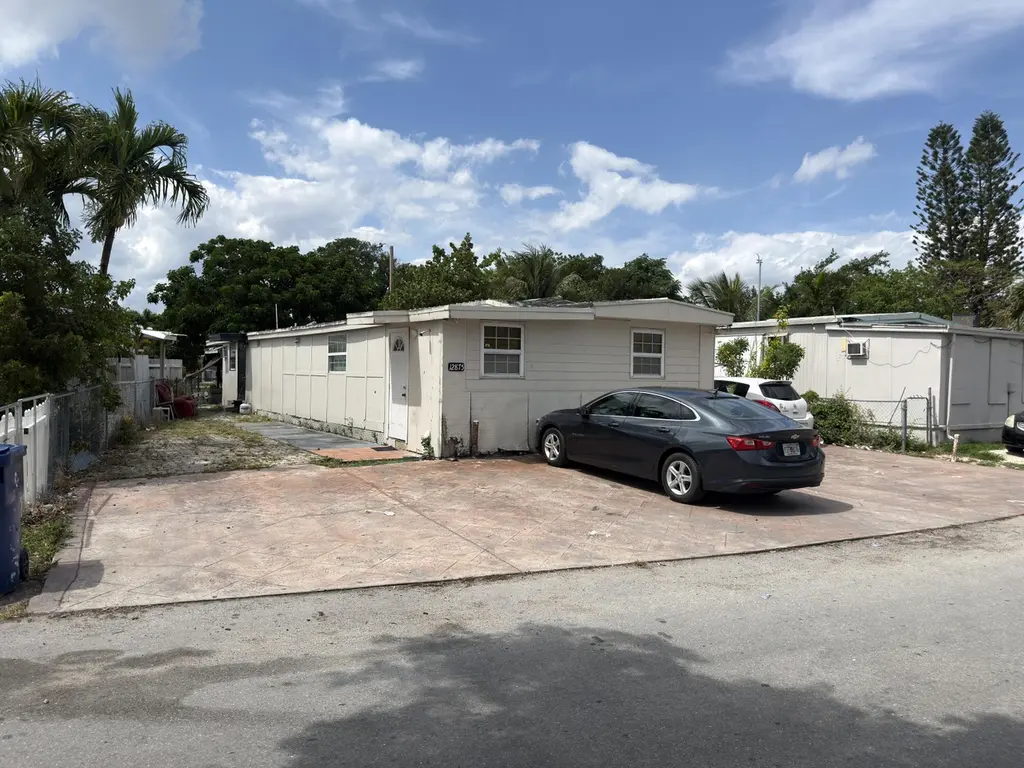
12875 SW 10th St · Tamiami, FL
Flood risk No data
- FEMA flood zone
- —
- Chance of flooding over 30 yrs
- —
- Est. flood insurance / yr
- —
Fire risk No data
- Est. fire insurance / yr
- —
Heat risk No data
- Hot days now (above threshold)
- —
- Hot days in 30 yrs
- —
Wind risk No data
- Chance of severe wind over 30 yrs
- —
Air-quality risk No data
- Unhealthy air days now
- —
- Unhealthy air days in 30 yrs
- —
Risk factors via First Street. Map © Google.
Why this score? — see what drove the B grade
The composite is a weighted blend of 9 inputs, each scored 0–100. Each bar is that input's sub-score; the figure is the points it added to the 100-point composite (weight × sub-score).
- Cash flow +30.0/30.0
- 1% rule +10.0/10.0
- DSCR +10.0/10.0
- ARV discount +7.5/15.0
- Schools +4.2/10.0
- Livability +4.0/5.0
- Rent growth +2.5/5.0
- Condition / age +2.2/5.0
- Appreciation +0.0/10.0
$135,000
🖨 Deal sheet 📄 Offer letter ✓ Due diligence
Listing remarks
Income-producing manufactured home located in University Lakes Mobile Home Park in Tamiami. Property is configured with four efficiency-style units currently generating approximately $5,000/month in rental income with tenants in place. Strong demand for affordable housing in the area provides consistent occupancy and cash flow potential. Conveniently located near major highways, shopping, dining, and employment centers. Potential portfolio opportunity: seller owns three additional manufactured homes within the same community and is open to selling all four properties as a package. Motivated seller. Land not included.
Key facts
- Manufactured home
- Affordable housing
- Shopping
Tags
Property features AI
Finance
- Other: Living area reported as 4,500 (source: other)
- Financial info: Land lease of $1,250 per month (lease expires 2027-02-28); Pets allowed with possible size limits and restrictions
Exterior
- Parking: Detached carport; Covered carport space (1); Total parking for 4 vehicles
- Utilities: Public water available; Public sewer (connected); Electricity available; Cable available
- Home design: Manufactured home; Single-story; Faces south; Resale condition
- Construction: Other construction materials; Other body type
- Exterior features: Non-waterfront property; Other roof and skirt materials
Interior
- Bedrooms: Four bedrooms on the main level
- Flooring: Laminate and other
- Bathrooms: Four full bathrooms on the main level
- Heating & cooling: Window/wall heating; Wall/window cooling units
- Interior features: Visitable accessibility; Laminate and other flooring
Neighborhood map
What this means for you Summary
Snapshot
- This is a 4-bed/4.0-bath manufactured listed at $135k. Condition is rated fair.
Deal economics
- At list price, monthly cash flow is $3k ($34k/yr) — positive.
- The deal already cash-flows at list — no discount required.
- Meets the 1% rule at list price ($5k rent vs $135k).
- Recommended offer: $131k (3.0% below list) — sets the bar for market timing.
- Cap rate 31.7% vs local median 3.4% in Tamiami — top-decile yield for the area; either an underpriced asset or a hidden risk that comps aren't pricing in. Stress-test before assuming the spread holds.
Location & tenants
- Location reads 79/100 on livability (#146 in FL, #2,197 nationally) — a middle-class / working-renter tenant base. Strengths: housing A+, health & safety A+, crime A; Watch: cost of living D, amenities F.
- Miami-Dade (suburban): math 45% / reading 54% proficiency, ranked #40 of 73 in FL (top 55%) — families likely to look elsewhere, expect single-tenant / working-renter base with shorter leases; 64% free/reduced lunch — lower-income household profile, screen leases tightly.
- Zoned schools: Zora Neale Hurston Elementary School (math 57% / reading 57%, grade C+, #781 of 2,144 statewide, top 38%, 467 students, 58% FRL); W. R. Thomas Middle School (math 51% / reading 57%, grade B-, #196 of 571 statewide, top 36%, 639 students, 64% FRL); G. Holmes Braddock Senior High (math 17% / reading 48%, grade F, #411 of 667 statewide, top 62%, 2,436 students, 57% FRL) — zoned schools at 60% FRL track the district average.
- Market conditions: 80 active listings in the ZIP; 3 comparable units currently listed for rent nearby; rentals at typical pace (median 15d on market — plan ~3-4 weeks tenant-placement turnaround); solid renter incomes; 10,051 units permitted in Miami-Dade County in 2024 (7,758 in 5+ unit buildings).
- At $4,795/mo this rent would consume 72% of the median local household income ($80k/yr) (locally 1139% of renters already pay >50% of income on rent) — very limited rent-growth headroom before tenants either downsize or default.
Forward outlook
- Local home prices are declining (-3.0%/yr); year-one equity from $933 of loan paydown is wiped out by about $4k of value loss. Plan a longer hold.
- Miami-Dade County population projected at +28% by 2050 — long-run rental-demand tailwind backs the buy-and-hold thesis.
- At projected returns (-3.0% appreciation + 3.0% rent growth), your $38k cash investment doubles in ~2 years — after that, you're playing with house money.
Negotiation context
- It's been on market 47 days — a 3% lower offer ($131k) is reasonable based on typical stale-listing flexibility.
Questions for the listing agent
- It's been on market 47 days. Have you received any prior offers? Is the seller open to a 3% concession, seller financing, or rate buy-down credit?
- Have any recent inspections been done? Can we get a copy of the seller's disclosures and any deferred-maintenance estimates?
- Is there a deadline driving the sale (1031 exchange, divorce, estate, relocation)? That informs how much negotiation room exists.
- Schools are B-rated — typically a magnet for longer-tenancy family renters. What's the average tenant stay here, and is there a school-zone premium baked into asking?
- What's the average days-on-market for RENTAL listings here right now (not sales)? A rising rental-DOM trend means longer vacancies and softer asking-rent achievability than the comps imply.
- What's the recent tenant-quality profile in this submarket — average credit score on applications, eviction rate, late-payment / NSF rate, and stable-employment percentage? A property-management company in the area should have these aggregated.
- How much new for-sale + rental construction is in the pipeline within 1–3 miles? Heavy new supply typically softens prices + rents 12–24 months out; constrained supply supports both.
Investment metrics
- 1% rule
- 3.55% ✓
- Cap rate
- 31.67%
- Cash-on-cash
- 90.64%
- DSCR
- 5.03
- GRM
- 2.3
CMA / ARV
No comps found within radius.
Projected returns pro-forma
-3.0% appreciation · 3.0% rent growth · sell at horizon
- IRR
- 91.3%
- Equity multiple
- 5.23×
- Total profit
- $160,047
- Equity at exit
- $20,129
- IRR
- 94.2%
- Equity multiple
- 10.89×
- Total profit
- $373,822
- Equity at exit
- $11,672
Cash invested: $37,800 (down + closing). Projections, not guarantees.
Landlord ↔ Tenant lean methodology
- Overall (STATE)
- 87 Strongly Landlord-Friendly
- State Florida
- 87 Strongly Landlord-Friendly · R+3
- County
- — inherits STATE
- City
- — inherits STATE
ZIP-level market 33184
- Home prices YoY
- -31.1%
- Active inventory
- 80
- Price-to-rent
- 2.3×
Monthly cashflow live
- Estimated rent
- $4,795 medium interval (Pro) →
- Mortgage (P&I)
- −$708
- Tax est. 1.5%
- −$169 /mo · $2,025/yr
- Insurance
- −$56
- HOA
- −$0
- Vacancy / Maint / Mgmt
- −$1,007
- Net cashflow
- $2,855
Break-even live
UW: 25.0% down · 7.5% · 30yr · 1.5% tax · 5.0% vac · 8.0% maint · 8.0% mgmt
Financing live
Cash to close
- Down payment
- $33,750
- Closing costs
- $4,050
- Reserves months
- —
- Total cash needed
- —
Loan-product check · same deal, 3 products live
Conventional
25% down · 7.5% · 30yr
- Down + closing
- —
- Monthly P&I
- —
- Monthly cashflow
- —
- DSCR
- —
- Eligible?
- —
Personal DTI + credit; lowest rate.
DSCR
20% down · 8.5% · 30yr
- Down + closing
- —
- Monthly P&I
- —
- Monthly cashflow
- —
- DSCR
- —
- Eligible?
- —
No personal income docs; deal must DSCR.
Hard money
10% down · 12.0% · 12mo
- Down + closing
- —
- Monthly P&I
- —
- Monthly cashflow
- —
- DSCR
- —
- Eligible?
- —
Short-term bridge; refi at stabilization.
Rent comps 3 comps
| Address | Beds | Baths | Sqft | Rent | $/sqft | DOM | Units | Dist |
|---|---|---|---|---|---|---|---|---|
| 223 NW 129th Ave Miami, FL | 5.0 | 6.5 | 4540 | $13,500 | $2.97 | 15d | 1 | 0.78mi |
| 223 NW 129th Ave Miami, FL | 5.0 | 6.5 | 4540 | $13,500 | $2.97 | 2d | 1 | 0.78mi |
| 3155 SW 132nd Ave Miami, FL | 3.0 | 3.5 | 4491 | $4,850 | $1.08 | 24d | 1 | 1.41mi |
Listing history 14 events
-
2026-06-18days on market $135,000 Active 47 DOM
-
2026-06-17days on market $135,000 Active 46 DOM
-
2026-06-16days on market $135,000 Active 45 DOM
-
2026-06-15days on market $135,000 Active 44 DOM
-
2026-06-13days on market $135,000 Active 42 DOM
-
2026-06-09days on market $135,000 Active 38 DOM
-
2026-06-08days on market $135,000 Active 37 DOM
-
2026-06-07days on market $135,000 Active 36 DOM
-
2026-06-04days on market $135,000 Active 33 DOM
-
2026-06-03days on market $135,000 Active 32 DOM
-
2026-06-02days on market $135,000 Active 31 DOM
-
2026-06-01days on market $135,000 Active 30 DOM
-
2026-05-31days on market $135,000 Active 29 DOM
-
2026-05-02$135,000 Active
ⓘ Source: listings_history table (triggers on properties + properties_extension) + one-shot
backfill from property_details.listing_events for pre-trigger history.
Nearby sold comps map
Loading sold comps map…
Walkable amenities ~0.75 mi
Loading nearby amenities…
Taxation est. · year 1
- Rental income
- $57,542
- − Mortgage interest
- −$7,562
- − Property taxes
- −$2,025
- − Insurance
- −$675
- − Repairs & maintenance
- −$4,603
- − Management
- −$4,603
- − Depreciation
- −$3,927
- Taxable income
- $34,146
- Est. tax owed @ 24.0%
- −$8,195
- After-tax cash flow
- $26,068/yr
For passive investors: Depreciation is non-cash, so a rental often shows a tax loss while cash-flowing — sheltering income. Rental losses are passive: they offset passive income freely, and up to $25,000/yr can offset ordinary (W-2) income if you actively participate and your MAGI is under $100k (phasing out to $0 by $150k); unused losses carry forward. On sale, claimed depreciation is recaptured at up to 25%, and gains may owe capital-gains tax (a 1031 exchange can defer both). Figures are a year-1 estimate at your 24.0% rate — not tax advice; consult a CPA.
Condition & rehab AI · 3 photos
This manufactured home requires moderate repairs and maintenance, with potential for significant value increase through exterior painting and roof inspection.
Repairs flagged
- Minor exterior siding — Light discoloration
- Moderate roof inspection — No visible damage, but may need inspection
Value-add opportunities
- Both paint exterior — Enhances curb appeal and value
- Both roof inspection and repair — Ensures structural integrity and prevents future issues
Renovation cost estimate screening
| Repair item | Severity | Est. cost |
|---|---|---|
| exterior siding · Light discoloration | Minor | $500–3,000 |
| roof inspection · No visible damage, but may need inspection | Moderate | $3,000–15,000 |
| Total estimated repair cost · 2 items | $3,500–18,000 |
Value-add ROI direction
- Both paint exterior — Enhances curb appeal and value ↑
- Both roof inspection and repair — Ensures structural integrity and prevents future issues ↑
ⓘ Cost ranges are severity-bucket heuristics (US national rule-of-thumb). Get contractor quotes + a written scope before underwriting a rehab budget.
Schools (NCES district)
- District
- Miami-Dade
- NCES district ID
- 1200390
- Math proficiency
- 45% ▼ -16.00%
- Reading proficiency
- 54% ▼ -5.00%
- Median HH income
- $43,928
- Composite
- 41.76/100
- National rank
- #3397
- State rank
- #40 of 73 in FL
Livability — Tamiami
- Score
- 79/100
- State rank
- #146
- US rank
- #2197
Category grades
Schools grade is shown separately in the Schools card above.
Census & demographics
- Census place
- Tamiami, FL
- County
- Miami-Dade County · 2,697,751 people
- City population
- 80,608
- Metro
- Miami-Fort Lauderdale-Pompano Beach, FL
- Population (ZIP)
- 19,859
- Household income
- $79,784
- Rent vs Own
- Severe rent burden
- 1139.0
Population outlook (Miami-Dade County) Hauer SSP2
- Today (2025)
- 3,126,439 people
- By 2030
- 3,325,765 · +6.4%
- By 2040
- 3,697,561 · +18.3%
- By 2050
- 4,012,134 · +28.3%
- By 2075
- 4,605,612 · +47.3%
- By 2100
- 4,866,598 · +55.7%
Race, ethnicity, and origin ACS 2023
- Neighborhood character
- Predominantly Hispanic (92%)
- Race & ethnicity
- Hispanic / Latino 92% Two or more races 55% White 6%
- Hispanic origin (detail)
- Mexican 2% Puerto Rican 2% Cuban 71%
- Common ancestry
- Estonian 1%
- Foreign-born
- 69% · Canada, Jamaica, Dominican Republic
- Languages at home
- 7% English-only · Spanish 91% Other Indo-European 1% Chinese 1%
Political lean MEDSL · Miami-Dade
- 2024 margin
- R (+11.4) · D 43.9% · R 55.4%
- 2008→2024 swing
- -27.6pp toward R · 2008: 16.1pp · 2024: -11.4pp
- All cycles
- 2024: R+11.4 2020: D+7.3 2016: D+29.6 2012: D+23.7 2008: D+16.1
Not yet ingested
- Civics
- —
Market trends
- HPI YoY
- ▼ -197.33%
- Current HPI
- 437.8467
- Rent YoY
- —
- Metro
- Miami-Fort Lauderdale-Pompano Beach, FL
- State GDP YoY
- ▲ 3.28%
- F500 in state
- 36
Industry mix (Fortune 500 HQ in FL)
| Industry | F500 HQs | Revenue |
|---|---|---|
| Industrial Technology | 2 | $29B |
|
||
| Insurance | 2 | $17B |
|
||
| Retail | 1 | $60B |
|
||
| Technology Distribution | 1 | $58B |
|
||
| Homebuilding | 1 | $35B |
|
||
| Technology Manufacturing | 1 | $35B |
|
||
Price history
1 event — show timeline
- 2026-05-02 Listed $135,000 Beaches MLS
Cash-flow waterfall
monthlySold comps — $/sqft
last 12 mo · ≤1 miLoading sold comps…