71 Flat Creek Rd · Maggie Valley, NC
Flood risk 8/10 · Major
- FEMA flood zone
- X (shaded)
- Chance of flooding over 30 yrs
- 0.99%
- Est. flood insurance / yr
- $473 – $860
Fire risk 4/10 · Minor
- Est. fire insurance / yr
- $906 – $1,684
Heat risk 3/10 · Minor
- Hot days now (above 93°F)
- 9 days/yr
- Hot days in 30 yrs
- 27 days/yr
Wind risk 2/10 · Minimal
- Chance of severe wind over 30 yrs
- —
Air-quality risk 3/10 · Minor
- Unhealthy air days now
- 2 days/yr
- Unhealthy air days in 30 yrs
- 2 days/yr
Risk factors via First Street. Map © Google.
Why this score? — see what drove the C grade
The composite is a weighted blend of 9 inputs, each scored 0–100. Each bar is that input's sub-score; the figure is the points it added to the 100-point composite (weight × sub-score).
- Cash flow +24.8/30.0
- DSCR +8.0/10.0
- ARV discount +7.5/15.0
- 1% rule +5.2/10.0
- Schools +4.5/10.0
- Livability +2.6/5.0
- Rent growth +2.5/5.0
- Condition / age +2.5/5.0
- Appreciation +0.0/10.0
$155,000
🖨 Deal sheet 📄 Offer letter ✓ Due diligence
Listing remarks
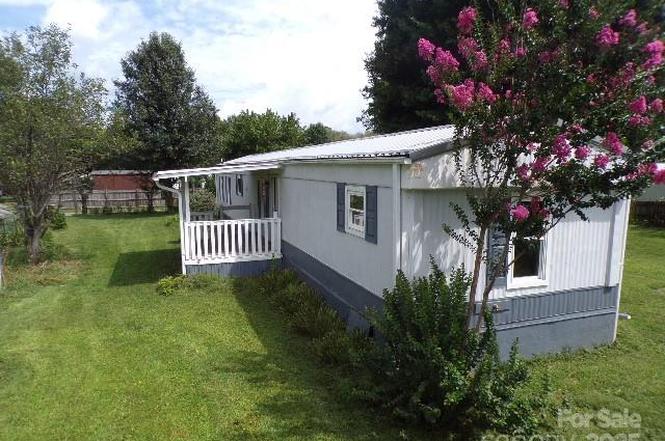
Located on a fenced half-acre lot, many attractions surround this home-; Lake Junaluska, the Great Smoky Mountains, and the Blue Ridge Parkway, to name a few. Returning to the simple way of living, this home features 2 bedrooms with en-suite bathrooms, divided by an open living room and kitchen. The specialties include a front covered porch overlooking the scenery. The enclosed rear deck consists of a ramp for easy access. Additionally, there are 4 outbuildings on the property, with one including an electrical subpanel and workbenches. The sale of the property is being made on an “As Is”, “Where "As Is", "Where Is”, "with All Faults” basis.
Key facts
- 0.5 acre lot
- Built 1993
- Listed 253 days
Property features AI
Finance
- HOA & community: No HOA
Exterior
- Parking: Attached carport; Driveway; Shared driveway; Other parking (see remarks)
- Utilities: City water; Public sewer; Electricity connected
- Home design: Manufactured singlewide home; Single-story (one level); Entry and living areas on the main level
- Construction: Manufactured construction; Aluminum exterior; Metal roof; Crawl space foundation; Built as a manufactured home
- Exterior features: Covered front and rear porches; Back yard fencing; Fenced yard; Outbuilding on the property; Gravel road access; Private maintained road
Interior
- Kitchen: Electric range
- Bedrooms: 2 bedrooms on the main level
- Bathrooms: 2 full bathrooms (main level)
- Heating & cooling: Electric heating; Forced air; Propane heating; Wall furnace; Wall-mounted cooling unit(s)
- Interior features: Walk-in closet(s); Six total rooms
- Laundry & utility: Laundry room with electric dryer hookup; Washer/Dryer included
Neighborhood map
What this means for you Summary
Snapshot
- This is a 3-bed/2.0-bath manufactured listed at $155k.
Deal economics
- At list price, monthly cash flow is $272 ($3k/yr) — positive.
- The deal already cash-flows at list — no discount required.
- Meets the 1% rule at list price ($2k rent vs $155k).
- Recommended offer: $136k (12.0% below list) — sets the bar for market timing.
- Cap rate 8.8% vs local median 2.3% in Maggie Valley — top-decile yield for the area; either an underpriced asset or a hidden risk that comps aren't pricing in. Stress-test before assuming the spread holds.
Location & tenants
- Location reads 51/100 on livability (#701 in NC) — a working-class tenant base; expect higher turnover. Strengths: housing A+, cost of living A; Watch: crime F, amenities F, commute F.
- Haywood County Schools (suburban): math 55% / reading 53% proficiency, ranked #50 of 178 in NC (top 28%) — acceptable for families but not a draw, mixed tenant base, ~2y average lease.
- Zoned schools: Jonathan Valley Elementary (math 52% / reading 47%, grade D, #417 of 1,410 statewide, top 32%, 378 students, 99% FRL); Tuscola High (math 57% / reading 60%, grade C, #235 of 535 statewide, top 45%, 917 students, 49% FRL) — zoned schools average 74% FRL vs 49% district-wide (26 pts higher); higher-poverty schools than district average — tighter screening recommended.
- Market conditions: 288 active listings in the ZIP; 537 units permitted in Haywood County in 2024 (150 in 5+ unit buildings).
Forward outlook
- Local home prices are declining (-3.0%/yr); year-one equity from $1k of loan paydown is wiped out by about $5k of value loss. Plan a longer hold.
Negotiation context
- It's been on market 253 days — a 12% lower offer ($136k) is reasonable based on typical stale-listing flexibility.
- 5 sale attempts since 4y ago; this cycle's ask has dropped $20k (11%) from the opening price — seller is motivated, your offer sets the floor, not the list.
Risks & watch-outs
- Watch-outs: flood insurance adds $56/mo.
- Climate carrying-cost: severe flood risk — expect insurance premiums to compound above CPI over the hold.
Questions for the listing agent
- It's been on market 253 days. Have you received any prior offers? Is the seller open to a 12% concession, seller financing, or rate buy-down credit?
- What's the actual annual flood-insurance premium (NFIP or private), and is the property in a SFHA with mandatory coverage?
- Why hasn't it sold? Are there any deal-killer items the seller is aware of (foundation, flood, title, zoning, code violations)?
- Is there a deadline driving the sale (1031 exchange, divorce, estate, relocation)? That informs how much negotiation room exists.
- Schools are D-rated, which usually means shorter tenancies and higher turnover. Who's the typical renter profile here, and what's been the actual vacancy rate?
- Crime grade is F in this area — have there been break-ins, vandalism, or insurance claims at this property in the last 3 years? What carrier currently insures it and at what premium?
- What's the average days-on-market for RENTAL listings here right now (not sales)? A rising rental-DOM trend means longer vacancies and softer asking-rent achievability than the comps imply.
- What's the recent tenant-quality profile in this submarket — average credit score on applications, eviction rate, late-payment / NSF rate, and stable-employment percentage? A property-management company in the area should have these aggregated.
- How much new for-sale + rental construction is in the pipeline within 1–3 miles? Heavy new supply typically softens prices + rents 12–24 months out; constrained supply supports both.
Investment metrics
- 1% rule
- 1.02% ✓
- Cap rate
- 8.83%
- Cash-on-cash
- 9.06%
- DSCR
- 1.40
- GRM
- 8.2
CMA / ARV
No comps found within radius.
Projected returns pro-forma
-3.0% appreciation · 3.0% rent growth · sell at horizon
- IRR
- -4.8%
- Equity multiple
- 0.82×
- Total profit
- $-7,829
- Equity at exit
- $23,111
- IRR
- 4.8%
- Equity multiple
- 1.35×
- Total profit
- $15,351
- Equity at exit
- $13,402
Cash invested: $43,400 (down + closing). Projections, not guarantees.
Landlord ↔ Tenant lean methodology
- Overall (STATE)
- 85 Strongly Landlord-Friendly
- State North Carolina
- 85 Strongly Landlord-Friendly · R+3
- County
- — inherits STATE
- City
- — inherits STATE
ZIP-level market 28785
- Home prices YoY
- -19.4%
- Active inventory
- 288
- Price-to-rent
- 8.2×
Monthly cashflow live
- Estimated rent
- $1,582 medium interval (Pro) →
- Mortgage (P&I)
- −$813
- Tax from tax record
- −$45 /mo · $541/yr
- Insurance
- −$65
- Flood insurance flood zone
- −$56 /mo · $666/yr
- HOA
- −$0
- Vacancy / Maint / Mgmt
- −$332
- Net cashflow
- $272
Break-even live
UW: 25.0% down · 7.5% · 30yr · 1.5% tax · 5.0% vac · 8.0% maint · 8.0% mgmt
Financing live
Cash to close
- Down payment
- $38,750
- Closing costs
- $4,650
- Reserves months
- —
- Total cash needed
- —
Loan-product check · same deal, 3 products live
Conventional
25% down · 7.5% · 30yr
- Down + closing
- —
- Monthly P&I
- —
- Monthly cashflow
- —
- DSCR
- —
- Eligible?
- —
Personal DTI + credit; lowest rate.
DSCR
20% down · 8.5% · 30yr
- Down + closing
- —
- Monthly P&I
- —
- Monthly cashflow
- —
- DSCR
- —
- Eligible?
- —
No personal income docs; deal must DSCR.
Hard money
10% down · 12.0% · 12mo
- Down + closing
- —
- Monthly P&I
- —
- Monthly cashflow
- —
- DSCR
- —
- Eligible?
- —
Short-term bridge; refi at stabilization.
Listing history 27 events
-
2026-06-18days on market $155,000 Active 253 DOM
-
2026-06-17days on market $155,000 Active 252 DOM
-
2026-06-16days on market $155,000 Active 251 DOM
-
2026-06-15days on market $155,000 Active 250 DOM
-
2026-06-14days on market $155,000 Active 248 DOM
-
2026-06-13days on market $155,000 Active 247 DOM
-
2026-06-10days on market $155,000 Active 245 DOM
-
2026-06-09days on market $155,000 Active 244 DOM
-
2026-06-08days on market $155,000 Active 243 DOM
-
2026-06-07days on market $155,000 Active 242 DOM
-
2026-06-03days on market $155,000 Active 238 DOM
-
2026-06-02days on market $155,000 Active 237 DOM
-
2026-06-01days on market $155,000 Active 236 DOM
-
2026-05-31days on market $155,000 Active 235 DOM
-
2026-05-30days on market $155,000 Active 234 DOM
-
2026-03-16price $155,000
-
2026-02-03price $165,000
-
2025-12-12status Active
-
2025-10-09status Pending
-
2025-08-05$175,000 Active
-
2023-11-02$231,000 Active
-
2022-11-23$288,000 Active
-
2022-05-18soldstatus $149,900 Closed
-
2022-05-18soldstatus $150,000
-
2022-02-07status Pending
-
2022-01-27$149,900 Active
-
2000-12-13soldstatus $38,000
ⓘ Source: listings_history table (triggers on properties + properties_extension) + one-shot
backfill from property_details.listing_events for pre-trigger history.
Tax reassessment forecast NC · Resets to sale price
- Current annual tax
- $541 · $45/mo
- Projected year-2 tax
- $1,271 · $106/mo
- Expected delta
- +$730/yr (+$61/mo · 134.8%)
ⓘ Screening estimate from a state-policy table — verify with the county assessor before closing.
Climate risk First Street
- Flood 8/10 Severe FEMA zone X (shaded) · 99% chance over 30 yrs
- Wildfire 4/10 Moderate
- Heat 3/10 Moderate 9 d/yr ≥93°F today · 27 d/yr by 30 yrs out
- Wind 2/10 Low
- Air quality 3/10 Moderate 2 unhealthy d/yr today · 2 by 30 yrs out
Nearby sold comps map
Loading sold comps map…
Walkable amenities ~0.75 mi
Loading nearby amenities…
Taxation est. · year 1
- Rental income
- $18,988
- − Mortgage interest
- −$8,682
- − Property taxes
- −$541
- − Insurance
- −$1,442
- − Repairs & maintenance
- −$1,519
- − Management
- −$1,519
- − Depreciation
- −$4,509
- Taxable income
- $775
- Est. tax owed @ 24.0%
- −$186
- After-tax cash flow
- $3,077/yr
For passive investors: Depreciation is non-cash, so a rental often shows a tax loss while cash-flowing — sheltering income. Rental losses are passive: they offset passive income freely, and up to $25,000/yr can offset ordinary (W-2) income if you actively participate and your MAGI is under $100k (phasing out to $0 by $150k); unused losses carry forward. On sale, claimed depreciation is recaptured at up to 25%, and gains may owe capital-gains tax (a 1031 exchange can defer both). Figures are a year-1 estimate at your 24.0% rate — not tax advice; consult a CPA.
Schools (NCES district)
- District
- Haywood County Schools
- NCES district ID
- 3702040
- Math proficiency
- 55% ▲ 7.00%
- Reading proficiency
- 53% ▲ 2.00%
- Median HH income
- $42,715
- Composite
- 45.42/100
- National rank
- #2623
- State rank
- #50 of 178 in NC
Livability — Maggie Valley
- Score
- 51/100
- State rank
- #701
- US rank
- #25374
Category grades
Schools grade is shown separately in the Schools card above.
Census & demographics
- Population (ZIP)
- 8,619
Population outlook (Haywood County) Hauer SSP2
- Today (2025)
- 61,607 people
- By 2030
- 62,137 · +0.9%
- By 2040
- 62,418 · +1.3%
- By 2050
- 61,578 · +-0.0%
- By 2075
- 59,137 · -4.0%
- By 2100
- 53,470 · -13.2%
Race, ethnicity, and origin ACS 2023
- Neighborhood character
- Predominantly White (94%)
- Race & ethnicity
- White 94% Two or more races 4% Hispanic / Latino 3%
- Common ancestry
- Serbian 10% Slovak 7% Italian 6%
- Foreign-born
- 2% · Canada
- Languages at home
- 97% English-only · Spanish 2% Other Indo-European 1%
Political lean MEDSL · Haywood
- 2024 margin
- Strong R (+25.1) · D 36.9% · R 62.0% · Other 1.1%
- 2008→2024 swing
- -17.4pp toward R · 2008: -7.8pp · 2024: -25.1pp
- All cycles
- 2024: R+25.1 2020: R+26.5 2016: R+28.0 2012: R+13.8 2008: R+7.8
Not yet ingested
- Civics
- —
Market trends
- HPI YoY
- ▼ -48.83%
- Current HPI
- 202.6632
- Rent YoY
- —
- Metro
- —
- State GDP YoY
- ▲ 3.28%
- F500 in state
- 26
Industry mix (Fortune 500 HQ in NC)
| Industry | F500 HQs | Revenue |
|---|---|---|
| Financial Services | 2 | $213B |
|
||
| Retail | 2 | $95B |
|
||
| Industrial Conglomerate | 1 | $38B |
|
||
| Metals / Steel | 1 | $35B |
|
||
| Utilities | 1 | $30B |
|
||
| Industrial Machinery | 1 | $19B |
|
||
Price history
+307.9% since first listed12 events — show timeline
- 2026-03-16 Price Changed $155,000 CANOPYMLS as Distributed by MLS Grid
- 2026-02-03 Price Changed $165,000 CANOPYMLS as Distributed by MLS Grid
- 2025-12-12 Relisted — CANOPYMLS as Distributed by MLS Grid
- 2025-10-09 Pending — CANOPYMLS as Distributed by MLS Grid
- 2025-08-05 Listed $175,000 CANOPYMLS as Distributed by MLS Grid
- 2023-11-02 Listed $231,000 CANOPYMLS as Distributed by MLS Grid
- 2022-11-23 Listed $288,000 CANOPYMLS as Distributed by MLS Grid
- 2022-05-18 Sold (Public Records) $150,000 Public Records
- 2022-05-18 Sold (MLS) $149,900 CANOPYMLS as Distributed by MLS Grid
- 2022-02-07 Pending — CANOPYMLS as Distributed by MLS Grid
- 2022-01-27 Listed $149,900 CANOPYMLS as Distributed by MLS Grid
- 2000-12-13 Sold (Public Records) $38,000 Public Records
Property tax history
+3.0%/yrLatest (2025): $541 · +3.4% YoY. Source: county tax records.
Cash-flow waterfall
monthlySold comps — $/sqft
last 12 mo · ≤1 miLoading sold comps…