1802 250th St · Waverly, IA
Flood risk 1/10 · Minimal
- FEMA flood zone
- X (unshaded)
- Chance of flooding over 30 yrs
- 0.0%
- Est. flood insurance / yr
- $473 – $860
Fire risk 5/10 · Moderate
- Est. fire insurance / yr
- $902 – $1,676
Heat risk 2/10 · Minimal
- Hot days now (above 101°F)
- 7 days/yr
- Hot days in 30 yrs
- 16 days/yr
Wind risk 2/10 · Minimal
- Chance of severe wind over 30 yrs
- —
Air-quality risk 1/10 · Minimal
- Unhealthy air days now
- 0 days/yr
- Unhealthy air days in 30 yrs
- 0 days/yr
Risk factors via First Street. Map © Google.
Why this score? — see what drove the D+ grade
The composite is a weighted blend of 9 inputs, each scored 0–100. Each bar is that input's sub-score; the figure is the points it added to the 100-point composite (weight × sub-score).
- Cash flow +13.9/30.0
- Schools +7.7/10.0
- ARV discount +7.5/15.0
- 1% rule +5.7/10.0
- Livability +4.3/5.0
- DSCR +4.2/10.0
- Rent growth +2.5/5.0
- Condition / age +2.5/5.0
- Appreciation +0.0/10.0
$110,000
🖨 Deal sheet 📄 Offer letter ✓ Due diligence
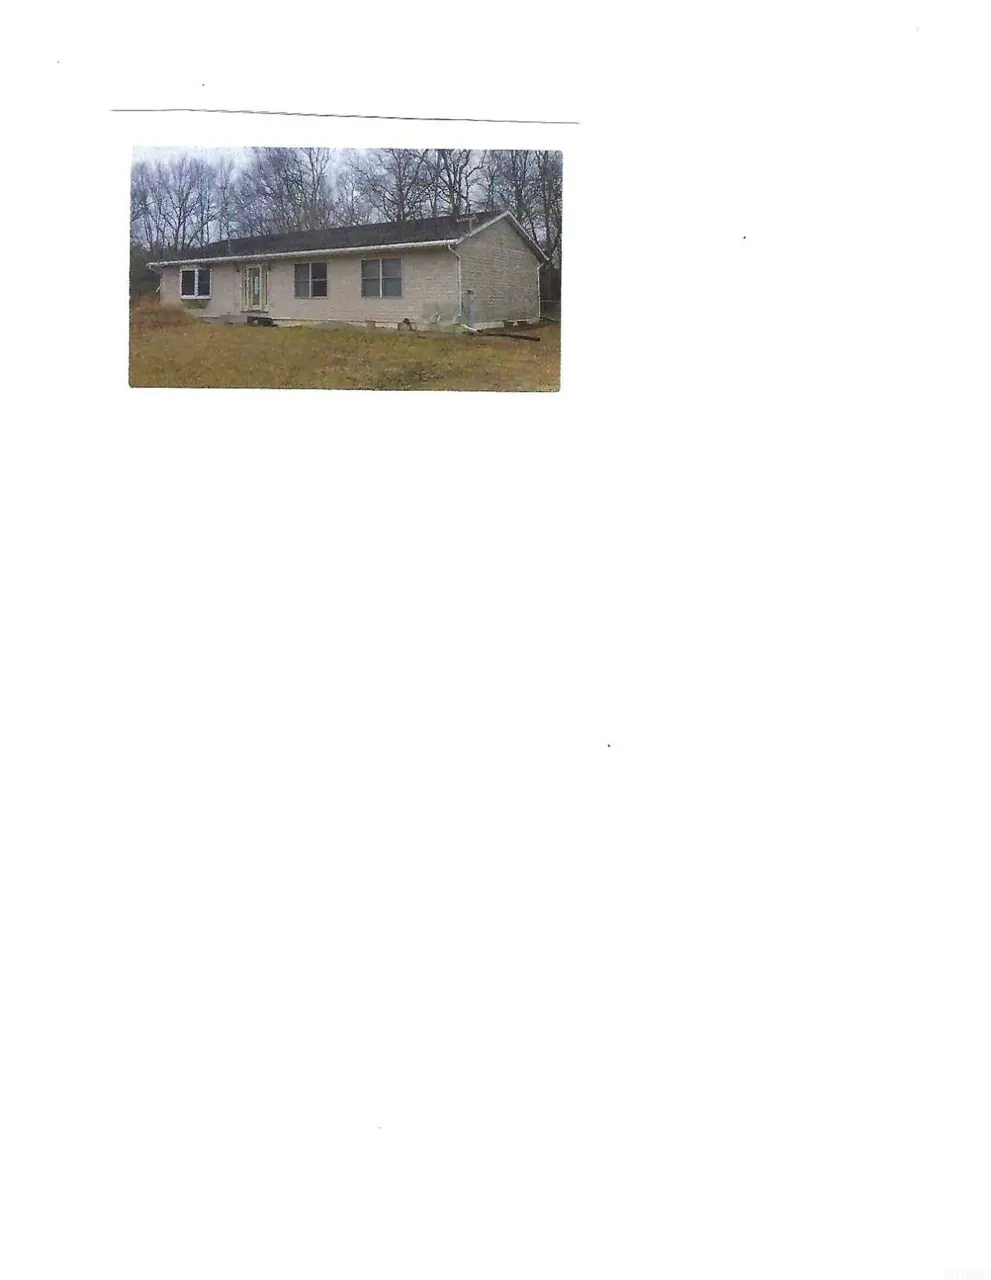
Listing remarks
Great location for these 3 bedrooms, 2 bath ranch home with 3 stall garages. Selling in the As Is Condition.
Key facts
- 1 acre lot
- Garage
- Built 2003
Neighborhood map
What this means for you Summary
Snapshot
- This is a 3-bed/2.0-bath single-family listed at $110k.
Deal economics
- At list price, monthly cash flow is $13 ($152/yr) — positive.
- The deal already cash-flows at list — no discount required.
- Meets the 1% rule at list price ($1k rent vs $110k).
- Cap rate 6.4% vs local median 2.4% in Waverly — top-decile yield for the area; either an underpriced asset or a hidden risk that comps aren't pricing in. Stress-test before assuming the spread holds.
Location & tenants
- Location reads 86/100 on livability (#12 in IA, #406 nationally) — a professional / high-income tenant draw. Strengths: cost of living A+, housing A+, health & safety A+; Watch: amenities C-, commute F.
- Denver Community School District (rural): math 91% / reading 88% proficiency, ranked #3 of 289 in IA (top 1%) — strong family-tenant draw, lease renewals of 3-5y typical; only 10% free/reduced lunch — higher-income household profile.
- Zoned schools: Denver Early Elementary School (59 students, 8% FRL); Denver Middle School (math 92% / reading 92%, grade A+, #1 of 246 statewide, top 0%, 207 students, 14% FRL); Denver Senior High School (math 92% / reading 92%, grade A+, #1 of 336 statewide, top 0%, 262 students, 12% FRL) — zoned schools at 12% FRL track the district average.
- Market conditions: 37 active listings in the ZIP; 34 units permitted in Bremer County in 2024 (0 in 5+ unit buildings).
Forward outlook
- Local home prices are declining (-3.0%/yr); year-one equity from $761 of loan paydown is wiped out by about $3k of value loss. Plan a longer hold.
- Bremer County population projected at +4% by 2050 — modest demand growth; plan on rents tracking national, not racing it.
Negotiation context
- Only 0 days on market — expect competitive offers; lowballing is unlikely to land.
Risks & watch-outs
- Watch-outs: property tax is 3.3% of price.
- Climate carrying-cost: moderate wildfire risk — expect insurance premiums to compound above CPI over the hold.
Questions for the listing agent
- Property tax is high relative to price — has the assessment been appealed recently, and will the sale trigger a re-assessment?
- Is there a deadline driving the sale (1031 exchange, divorce, estate, relocation)? That informs how much negotiation room exists.
- Schools are A-rated — typically a magnet for longer-tenancy family renters. What's the average tenant stay here, and is there a school-zone premium baked into asking?
- The area grade is low — what's the realistic commute time and amenity access for the typical tenant pool here? Any planned neighborhood developments (good or bad) we should know about?
- What's the average days-on-market for RENTAL listings here right now (not sales)? A rising rental-DOM trend means longer vacancies and softer asking-rent achievability than the comps imply.
- What's the recent tenant-quality profile in this submarket — average credit score on applications, eviction rate, late-payment / NSF rate, and stable-employment percentage? A property-management company in the area should have these aggregated.
- How much new for-sale + rental construction is in the pipeline within 1–3 miles? Heavy new supply typically softens prices + rents 12–24 months out; constrained supply supports both.
Investment metrics
- 1% rule
- 1.07% ✓
- Cap rate
- 6.43%
- Cash-on-cash
- 0.49%
- DSCR
- 1.02
- GRM
- 7.8
CMA / ARV
No comps found within radius.
Projected returns pro-forma
-3.0% appreciation · 3.0% rent growth · sell at horizon
- IRR
- -15.4%
- Equity multiple
- 0.45×
- Total profit
- $-16,902
- Equity at exit
- $16,401
- IRR
- -6.7%
- Equity multiple
- 0.57×
- Total profit
- $-13,207
- Equity at exit
- $9,511
Cash invested: $30,800 (down + closing). Projections, not guarantees.
Landlord ↔ Tenant lean methodology
- Overall (STATE)
- 83 Strongly Landlord-Friendly
- State Iowa
- 83 Strongly Landlord-Friendly · R+6
- County
- — inherits STATE
- City
- — inherits STATE
ZIP-level market 50622
- Home prices YoY
- -27.2%
- Active inventory
- 37
- Price-to-rent
- 7.8×
Monthly cashflow live
- Estimated rent
- $1,182 medium interval (Pro) →
- Mortgage (P&I)
- −$577
- Tax from tax record
- −$298 /mo · $3,580/yr
- Insurance
- −$46
- HOA
- −$0
- Vacancy / Maint / Mgmt
- −$248
- Net cashflow
- $13
Break-even live
UW: 25.0% down · 7.5% · 30yr · 1.5% tax · 5.0% vac · 8.0% maint · 8.0% mgmt
Financing live
Cash to close
- Down payment
- $27,500
- Closing costs
- $3,300
- Reserves months
- —
- Total cash needed
- —
Loan-product check · same deal, 3 products live
Conventional
25% down · 7.5% · 30yr
- Down + closing
- —
- Monthly P&I
- —
- Monthly cashflow
- —
- DSCR
- —
- Eligible?
- —
Personal DTI + credit; lowest rate.
DSCR
20% down · 8.5% · 30yr
- Down + closing
- —
- Monthly P&I
- —
- Monthly cashflow
- —
- DSCR
- —
- Eligible?
- —
No personal income docs; deal must DSCR.
Hard money
10% down · 12.0% · 12mo
- Down + closing
- —
- Monthly P&I
- —
- Monthly cashflow
- —
- DSCR
- —
- Eligible?
- —
Short-term bridge; refi at stabilization.
Listing history 2 events
-
2026-05-01$110,000
-
2026-05-01historical
ⓘ Source: listings_history table (triggers on properties + properties_extension) + one-shot
backfill from property_details.listing_events for pre-trigger history.
Tax reassessment forecast IA · Partial reset (capped growth)
- Current annual tax
- $3,580 · $298/mo
- Projected year-2 tax
- $3,580 · $298/mo
- Expected delta
- $0/yr ($0/mo · 0.0%)
ⓘ Screening estimate from a state-policy table — verify with the county assessor before closing.
Climate risk First Street
- Flood 1/10 Low FEMA zone X (unshaded) · 0% chance over 30 yrs
- Wildfire 5/10 Major
- Heat 2/10 Low 7 d/yr ≥101°F today · 16 d/yr by 30 yrs out
- Wind 2/10 Low
- Air quality 1/10 Low 0 unhealthy d/yr today · 0 by 30 yrs out
Nearby sold comps map
Loading sold comps map…
Walkable amenities ~0.75 mi
Loading nearby amenities…
Taxation est. · year 1
- Rental income
- $14,182
- − Mortgage interest
- −$6,162
- − Property taxes
- −$3,580
- − Insurance
- −$550
- − Repairs & maintenance
- −$1,135
- − Management
- −$1,135
- − Depreciation
- −$3,200
- Taxable loss
- −$1,579
- Est. tax savings @ 24.0%
- +$379
- After-tax cash flow
- $531/yr
For passive investors: Depreciation is non-cash, so a rental often shows a tax loss while cash-flowing — sheltering income. Rental losses are passive: they offset passive income freely, and up to $25,000/yr can offset ordinary (W-2) income if you actively participate and your MAGI is under $100k (phasing out to $0 by $150k); unused losses carry forward. On sale, claimed depreciation is recaptured at up to 25%, and gains may owe capital-gains tax (a 1031 exchange can defer both). Figures are a year-1 estimate at your 24.0% rate — not tax advice; consult a CPA.
Schools (NCES district)
- District
- Denver Community School District
- NCES district ID
- 1908940
- Math proficiency
- 91% ▬ 0.00%
- Reading proficiency
- 88% ▲ 1.00%
- Median HH income
- $68,456
- Composite
- 77.32/100
- National rank
- #97
- State rank
- #3 of 289 in IA
Livability — Waverly
- Score
- 86/100
- State rank
- #12
- US rank
- #406
Category grades
Schools grade is shown separately in the Schools card above.
Census & demographics
- Population (ZIP)
- 3,288
Population outlook (Bremer County) Hauer SSP2
- Today (2025)
- 25,557 people
- By 2030
- 25,842 · +1.1%
- By 2040
- 26,206 · +2.5%
- By 2050
- 26,620 · +4.2%
- By 2075
- 27,635 · +8.1%
- By 2100
- 28,760 · +12.5%
Race, ethnicity, and origin ACS 2023
- Neighborhood character
- Predominantly White (96%)
- Race & ethnicity
- White 96% Two or more races 2% Asian 1%
- Common ancestry
- Portuguese 7% Serbian 2% Lithuanian 2%
- Foreign-born
- 1% · South Korea, Canada
- Languages at home
- 96% English-only · Spanish 3%
Political lean MEDSL · Bremer
- 2024 margin
- Strong R (+22.2) · D 38.3% · R 60.5% · Other 1.3%
- 2008→2024 swing
- -31.5pp toward R · 2008: 9.3pp · 2024: -22.2pp
- All cycles
- 2024: R+22.2 2020: R+16.1 2016: R+13.9 2012: D+2.5 2008: D+9.3
Not yet ingested
- Civics
- —
Market trends
- HPI YoY
- ▼ -71.44%
- Current HPI
- 190.6781
- Rent YoY
- —
- Metro
- —
- State GDP YoY
- ▲ 2.48%
- F500 in state
- 4
Industry mix (Fortune 500 HQ in IA)
| Industry | F500 HQs | Revenue |
|---|---|---|
| Financial Services | 1 | $16B |
|
||
| Retail / Convenience | 1 | $15B |
|
||
Price history
2 events — show timeline
- 2026-05-01 Delisted — NEIRBR as distributed by MLS GRID
- 2026-05-01 Listed $110,000 NEIRBR as distributed by MLS GRID
Property tax history
+2.8%/yrLatest (2025): $3,580 · +1.4% YoY. Source: county tax records.
Cash-flow waterfall
monthlySold comps — $/sqft
last 12 mo · ≤1 miLoading sold comps…