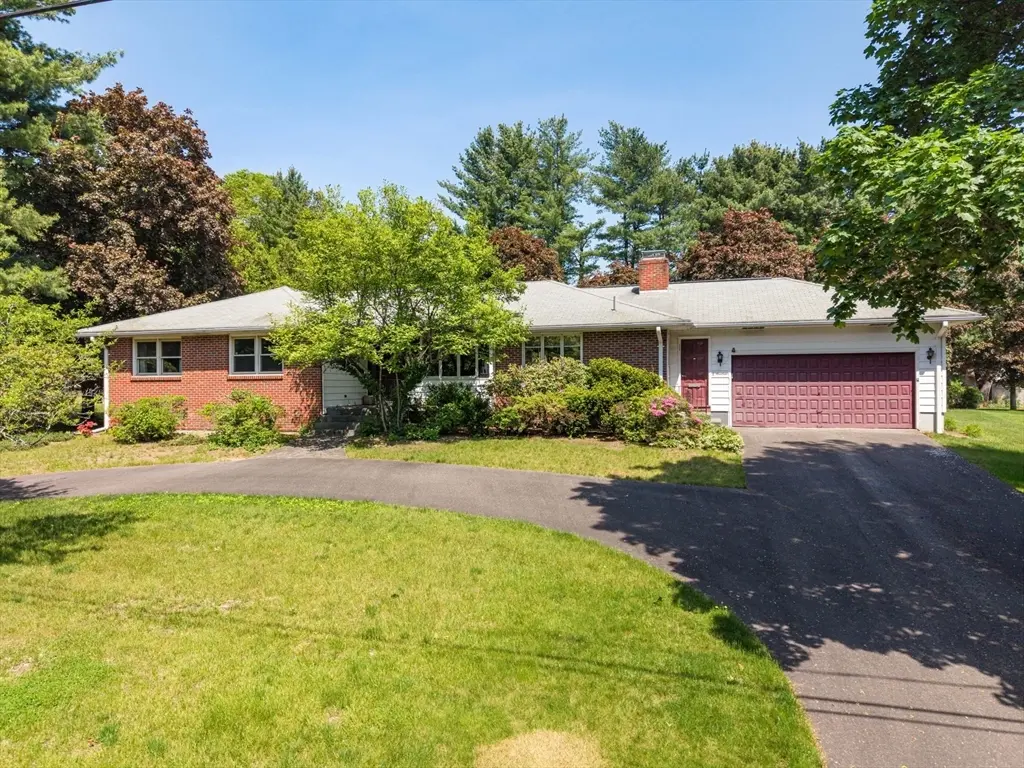
19 Williston Dr · Longmeadow, MA
Flood risk 1/10 · Minimal
- FEMA flood zone
- X (unshaded)
- Chance of flooding over 30 yrs
- 0.0%
- Est. flood insurance / yr
- $473 – $860
Fire risk 2/10 · Minimal
- Est. fire insurance / yr
- $915 – $1,699
Heat risk 4/10 · Minor
- Hot days now (above 98°F)
- 7 days/yr
- Hot days in 30 yrs
- 15 days/yr
Wind risk 6/10 · Moderate
- Chance of severe wind over 30 yrs
- 27.0%
Air-quality risk 2/10 · Minimal
- Unhealthy air days now
- 1 days/yr
- Unhealthy air days in 30 yrs
- 2 days/yr
Risk factors via First Street. Map © Google.
Why this score? — see what drove the D- grade
The composite is a weighted blend of 9 inputs, each scored 0–100. Each bar is that input's sub-score; the figure is the points it added to the 100-point composite (weight × sub-score).
- Cash flow +12.8/30.0
- Schools +5.4/10.0
- 1% rule +4.0/10.0
- Livability +4.0/5.0
- DSCR +3.8/10.0
- Rent growth +2.5/5.0
- Condition / age +2.5/5.0
- ARV discount +0.0/15.0
- Appreciation +0.0/10.0
$499,900
🖨 Deal sheet (PDF) 📄 Offer letter ✓ Due diligence
Listing remarks
LOCATION! EXCITING OPPORTUNITY! GREAT POTENTIAL! Comfortable 6 room, 3 Bedroom, 2.5 Bathroom, 2000SF Ranch, set on a half acre, level lot offers a convenient central location near Longmeadow shops, schools, fields, and town amenities. Bring your contractor, painter, and decorator to transform this wonderful home to modern-day standards! Hardwood flooring is in many rooms. Stunning blue stone fireplace accents the family room which has slider access to the deck & back yard. Entry hall opens to the dine-in kitchen with built-in hutch & to a combination Living/Formal dining room. Primary bedroom suite already has an updated tiled walk-in shower bathroom. Hall bath requires some re
Key facts
- Hardwood flooring
- Blue stone fireplace
- Dine-in kitchen
Tags
Property features AI
Finance
- HOA & community: Community offers access to public transportation, shopping, pool, tennis courts, parks, walk/jog trails, golf, medical facility, bike path, conservation area, highway access, sidewalks, nearby schools and universities, and house of worship
Exterior
- Parking: Attached 2-car garage with garage door opener; 2 covered spaces; 2 open/off-street paved parking spaces (4 total); Paved driveway
- Utilities: Public water; Public sewer; Electric with circuit breakers
- Home design: Single family residence; Brick exterior color; Approximately 2,000 above-grade finished area
- Construction: Frame construction; Shingle roof; Concrete perimeter foundation; Year built approximate (from public records)
- Exterior features: Deck; Rain gutters; Window screens; Gentle sloping lot; Paved public road frontage (publicly maintained)
Interior
- Kitchen: Custom built cabinets; Dining area and exterior access; Range; Dishwasher; Disposal; Microwave; Refrigerator
- Bedrooms: 3 main-level bedrooms; Master bedroom with walk-in closet, full bathroom, cable hookup, and mixed tile and carpet flooring
- Flooring: Hardwood flooring in main living areas and some bedrooms; Wall-to-wall carpet in select bedrooms/areas; Tile / stone ceramic flooring in bathrooms and other areas
- Bathrooms: 2 full bathrooms and 1 half bathroom; Master bathroom present; Full bathroom tiled with tub and shower and a double vanity; Remodeled tiled bathroom with shower stall
- Heating & cooling: Forced air natural gas heating; Central air conditioning
- Interior features: Entrance foyer; Custom built closets/cabinets; Window screens; 6 total rooms; Full basement with interior entry, bulkhead access, and concrete perimeter
- Laundry & utility: First-floor laundry closet with washer hookup and electric dryer hookup; Washer and dryer included; Gas water heater and water heater
Neighborhood map
What this means for you Summary
Snapshot
- This is a 3-bed/2.5-bath single-family listed at $500k.
Deal economics
- At list price, monthly cash flow is $-48 ($-571/yr) — negative.
- To cash-flow at today's rent, offer at most $491k (1.7% below list).
- To meet the 1% rule (rent ≥ 1% of price), the offer needs to be $450k (10.0% below list).
- Recommended offer: $450k (10.0% below list) — sets the bar for 1% rule.
- Cap rate 6.2% vs local median 3.6% in Longmeadow — top-decile yield for the area; either an underpriced asset or a hidden risk that comps aren't pricing in. Stress-test before assuming the spread holds.
Location & tenants
- Location reads 80/100 on livability (#38 in MA, #1,837 nationally) — a professional / high-income tenant draw. Strengths: crime A+, commute A+, employment A+; Watch: amenities F, cost of living F.
- Longmeadow (suburban): math 50% / reading 66% proficiency, ranked #63 of 302 in MA (top 21%) — acceptable for families but not a draw, mixed tenant base, ~2y average lease; only 4% free/reduced lunch — higher-income household profile.
- Zoned schools: Blueberry Hill (math 58% / reading 68%, grade B, #141 of 938 statewide, top 15%, 392 students, 0% FRL); Glenbrook Middle (math 42% / reading 63%, grade C+, #67 of 305 statewide, top 23%, 332 students, 0% FRL); Longmeadow High (math 77% / reading 82%, grade A-, #43 of 343 statewide, top 13%, 904 students, 0% FRL) — zoned schools at 0% FRL track the district average.
- Market conditions: 22 active listings in the ZIP; 1 comparable units currently listed for rent nearby; 453 units permitted in Hampden County in 2024 (116 in 5+ unit buildings).
Forward outlook
- Local home prices are declining (-3.0%/yr); year-one equity from $3k of loan paydown is wiped out by about $15k of value loss. Plan a longer hold.
- Hampden County population projected at +5% by 2050 — modest demand growth; plan on rents tracking national, not racing it.
Negotiation context
- It's been on market 29 days — a 2% lower offer ($492k) is reasonable based on typical stale-listing flexibility.
- 2 sale attempts with the ask held roughly flat each time — persistent listings suggest the price (not the market) is what's stuck; bring a comps-based counter.
- Current owner paid $162k; list at $500k implies a 208% gain — meaningful room to come down on a strong offer.
Risks & watch-outs
- Climate carrying-cost: major wind risk, 27% chance of damaging wind over 30y — expect insurance premiums to compound above CPI over the hold.
Questions for the listing agent
- What do current leases actually rent for vs. the listed asking? Can we see a recent rent roll and the last 12 months of T-12 income?
- Built in 1970 — when were the roof, HVAC, electrical panel, plumbing, and water heater last replaced?
- Is there a deadline driving the sale (1031 exchange, divorce, estate, relocation)? That informs how much negotiation room exists.
- Schools are A-rated — typically a magnet for longer-tenancy family renters. What's the average tenant stay here, and is there a school-zone premium baked into asking?
- The area grade is low — what's the realistic commute time and amenity access for the typical tenant pool here? Any planned neighborhood developments (good or bad) we should know about?
- What's the average days-on-market for RENTAL listings here right now (not sales)? A rising rental-DOM trend means longer vacancies and softer asking-rent achievability than the comps imply.
- What's the recent tenant-quality profile in this submarket — average credit score on applications, eviction rate, late-payment / NSF rate, and stable-employment percentage? A property-management company in the area should have these aggregated.
- How much new for-sale + rental construction is in the pipeline within 1–3 miles? Heavy new supply typically softens prices + rents 12–24 months out; constrained supply supports both.
Investment metrics
- 1% rule
- 0.90% ✗
- Cap rate
- 6.18%
- Cash-on-cash
- -0.41%
- DSCR
- 0.98
- GRM
- 9.3
CMA / ARV
- ARV (on-the-fly)
- $356,000
- Comps found
- 1
Show comp detail 1 sale within ~0.75 mi
| Address | Dist | Beds/Ba | Sqft | Sold | Price | $/sf | Match |
|---|---|---|---|---|---|---|---|
| 48 Schuyler | 0.67mi | 3/1.5 | 2,018 (+1%) | 12mo | $359,000 | $178 | 53 |
Match score weights: distance 35% · size 25% · config 20% · recency 20%. Top-matched comps best support the ARV.
Projected returns pro-forma
-3.0% appreciation · 3.0% rent growth · sell at horizon
- IRR
- -16.9%
- Equity multiple
- 0.40×
- Total profit
- $-83,876
- Equity at exit
- $74,537
- IRR
- -8.8%
- Equity multiple
- 0.45×
- Total profit
- $-76,294
- Equity at exit
- $43,222
Cash invested: $139,972 (down + closing). Projections, not guarantees.
Landlord ↔ Tenant lean methodology
- Overall (STATE)
- 20 Strongly Tenant-Friendly
- State Massachusetts
- 20 Strongly Tenant-Friendly · D+15
- County
- — inherits STATE
- City
- — inherits STATE
ZIP-level market 01106
- Active inventory
- 22
- Price-to-rent
- 9.3×
Monthly cashflow live
- Estimated rent
- $4,500 medium interval (Pro) →
- Mortgage (P&I)
- −$2,622
- Tax from tax record
- −$773 /mo · $9,273/yr
- Insurance
- −$208
- HOA
- −$0
- Vacancy / Maint / Mgmt
- −$945
- Net cashflow
- $-48
Break-even live
Sensitivity live
| Price | -10% $235 | -5% $94 | +0% $-48 | +5% $-189 | +10% $-331 |
|---|---|---|---|---|---|
| Rent | -10% $-403 | -5% $-225 | +0% $-48 | +5% $130 | +10% $308 |
| Rate | -1.0pp $204 | -0.5pp $80 | base $-48 | +0.5pp $-177 | +1.0pp $-309 |
UW: 25.0% down · 7.5% · 30yr · 1.5% tax · 5.0% vac · 8.0% maint · 8.0% mgmt
Financing live
Cash to close
- Down payment
- $124,975
- Closing costs
- $14,997
- Reserves months
- —
- Total cash needed
- —
Loan-product check · same deal, 3 products live
Conventional
25% down · 7.5% · 30yr
- Down + closing
- —
- Monthly P&I
- —
- Monthly cashflow
- —
- DSCR
- —
- Eligible?
- —
Personal DTI + credit; lowest rate.
DSCR
20% down · 8.5% · 30yr
- Down + closing
- —
- Monthly P&I
- —
- Monthly cashflow
- —
- DSCR
- —
- Eligible?
- —
No personal income docs; deal must DSCR.
Hard money
10% down · 12.0% · 12mo
- Down + closing
- —
- Monthly P&I
- —
- Monthly cashflow
- —
- DSCR
- —
- Eligible?
- —
Short-term bridge; refi at stabilization.
Rent comps 1 comps
| Address | Beds | Baths | Sqft | Rent | $/sqft | DOM | Units | Dist |
|---|---|---|---|---|---|---|---|---|
| 4 Broadleaf Cir Unit 4 East Longmeadow, MA | 3.0 | 3.5 | 2095 | $4,500 | $2.15 | 3d | 1 | 0.88mi |
Listing history 19 events
-
2026-06-22days on market $499,900 Active 29 DOM
-
2026-06-18days on market $499,900 Active 26 DOM
-
2026-06-17statusdays on market $499,900 Active 25 DOM
-
2026-06-16days on market $499,900 Back On Market 24 DOM
-
2026-06-15statusdays on market $499,900 Back On Market 23 DOM
-
2026-06-13days on market $499,900 Contingent 21 DOM
-
2026-06-13days on market $499,900 Contingent 20 DOM
-
2026-06-10days on market $499,900 Contingent 18 DOM
-
2026-06-09days on market $499,900 Contingent 17 DOM
-
2026-06-08days on market $499,900 Contingent 16 DOM
-
2026-06-07days on market $499,900 Contingent 15 DOM
-
2026-06-05days on market $499,900 Contingent 12 DOM
-
2026-06-03days on market $499,900 Contingent 11 DOM
-
2026-06-02days on market $499,900 Contingent 10 DOM
-
2026-06-02status $499,900 Contingent 9 DOM
-
2026-06-01days on market $499,900 Active 9 DOM
-
2026-05-31days on market $499,900 Active 8 DOM
-
2026-05-23$499,900 New
-
1985-08-01soldstatus $162,250
ⓘ Source: listings_history table (triggers on properties + properties_extension) + one-shot
backfill from property_details.listing_events for pre-trigger history.
Tax reassessment forecast MA · Partial reset (capped growth)
- Current annual tax
- $9,273 · $773/mo
- Projected year-2 tax
- $9,273 · $773/mo
- Expected delta
- $0/yr ($0/mo · 0.0%)
ⓘ Screening estimate from a state-policy table — verify with the county assessor before closing.
Climate risk First Street
- Flood 1/10 Low FEMA zone X (unshaded) · 0% chance over 30 yrs
- Wildfire 2/10 Low
- Heat 4/10 Moderate 7 d/yr ≥98°F today · 15 d/yr by 30 yrs out
- Wind 6/10 Major 27% chance of damaging wind over 30 yrs
- Air quality 2/10 Low 1 unhealthy d/yr today · 2 by 30 yrs out
Nearby sold comps map
Loading sold comps map…
Walkable amenities ~0.75 mi
Loading nearby amenities…
Taxation est. · year 1
- Rental income
- $54,000
- − Mortgage interest
- −$28,002
- − Property taxes
- −$9,273
- − Insurance
- −$2,500
- − Repairs & maintenance
- −$4,320
- − Management
- −$4,320
- − Depreciation
- −$14,543
- Taxable loss
- −$8,957
- Est. tax savings @ 24.0%
- +$2,150
- After-tax cash flow
- $1,579/yr
For passive investors: Depreciation is non-cash, so a rental often shows a tax loss while cash-flowing — sheltering income. Rental losses are passive: they offset passive income freely, and up to $25,000/yr can offset ordinary (W-2) income if you actively participate and your MAGI is under $100k (phasing out to $0 by $150k); unused losses carry forward. On sale, claimed depreciation is recaptured at up to 25%, and gains may owe capital-gains tax (a 1031 exchange can defer both). Figures are a year-1 estimate at your 24.0% rate — not tax advice; consult a CPA.
Schools (NCES district)
- District
- Longmeadow
- NCES district ID
- 2506990
- Math proficiency
- 50% ▼ -19.00%
- Reading proficiency
- 66% ▼ -6.00%
- Median HH income
- $101,874
- Composite
- 54.31/100
- National rank
- #1369
- State rank
- #63 of 302 in MA
Livability — Longmeadow
- Score
- 80/100
- State rank
- #38
- US rank
- #1837
Category grades
Schools grade is shown separately in the Schools card above.
Census & demographics
- Census place
- Longmeadow, MA
- City population
- 15,961
- Population (ZIP)
- 15,961
Population outlook (Hampden County) Hauer SSP2
- Today (2025)
- 485,646 people
- By 2030
- 491,517 · +1.2%
- By 2040
- 500,539 · +3.1%
- By 2050
- 508,827 · +4.8%
- By 2075
- 539,167 · +11.0%
- By 2100
- 545,698 · +12.4%
Race, ethnicity, and origin ACS 2023
- Neighborhood character
- Predominantly White (85%)
- Race & ethnicity
- White 85% Asian 6% Two or more races 6% Hispanic / Latino 3% Black 2%
- Common ancestry
- Romanian 8% Lithuanian 5% German 3%
- Foreign-born
- 14% · Canada, China
- Languages at home
- 86% English-only · Other Indo-European 5% Spanish 2% Russian/Polish/Slavic 2%
Political lean MEDSL · Hampden
- 2024 margin
- Lean D (+8.9) · D 53.4% · R 44.5% · Other 2.1%
- 2008→2024 swing
- -16.4pp toward R · 2008: 25.3pp · 2024: 8.9pp
- All cycles
- 2024: D+8.9 2020: D+17.7 2016: D+16.0 2012: D+25.4 2008: D+25.3
Not yet ingested
- Civics
- —
Market trends
- HPI YoY
- ▼ -511.13%
- Current HPI
- 247.1779
- Rent YoY
- —
- Metro
- —
- State GDP YoY
- ▲ 2.28%
- F500 in state
- 38
Industry mix (Fortune 500 HQ in MA)
| Industry | F500 HQs | Revenue |
|---|---|---|
| Technology | 3 | $17B |
|
||
| Insurance | 2 | $84B |
|
||
| Retail | 2 | $76B |
|
||
| Life Sciences | 1 | $43B |
|
||
| Energy Technology | 1 | $31B |
|
||
| Aerospace / Defense | 1 | $18B |
|
||
Price history
+208.1% since first listed4 events — show timeline
- 2026-06-13 Relisted — MLS PIN
- 2026-06-01 Contingent — MLS PIN
- 2026-05-23 Listed $499,900 MLS PIN
- 1985-08-01 Sold (Public Records) $162,250 Public Records
Property tax history
+3.1%/yrLatest (2023): $9,273 · +3.5% YoY. Source: county tax records.
Cash-flow waterfall
monthlySold comps — $/sqft
last 12 mo · ≤1 miLoading sold comps…