 Fourplex
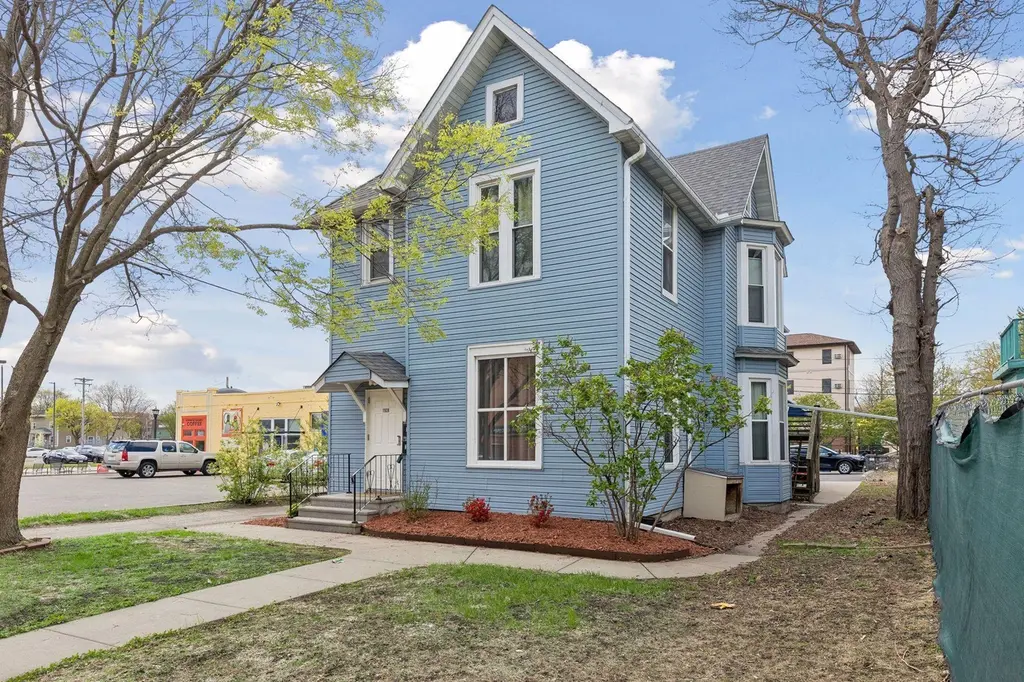
1926 15th Ave S · Minneapolis, MN
Flood risk 1/10 · Minimal
- FEMA flood zone
- X (unshaded)
- Chance of flooding over 30 yrs
- 0.0%
- Est. flood insurance / yr
- $473 – $860
Fire risk 1/10 · Minimal
- Est. fire insurance / yr
- $888 – $1,650
Heat risk 2/10 · Minimal
- Hot days now (above 99°F)
- 7 days/yr
- Hot days in 30 yrs
- 14 days/yr
Wind risk 2/10 · Minimal
- Chance of severe wind over 30 yrs
- —
Air-quality risk 2/10 · Minimal
- Unhealthy air days now
- 1 days/yr
- Unhealthy air days in 30 yrs
- 1 days/yr
Risk factors via First Street. Map © Google.
Why this score? — see what drove the B grade
The composite is a weighted blend of 9 inputs, each scored 0–100. Each bar is that input's sub-score; the figure is the points it added to the 100-point composite (weight × sub-score).
- Cash flow +30.0/30.0
- 1% rule +10.0/10.0
- DSCR +10.0/10.0
- ARV discount +9.8/15.0
- Livability +3.9/5.0
- Schools +3.5/10.0
- Rent growth +2.8/5.0
- Condition / age +2.5/5.0
- Appreciation +0.0/10.0
$449,000
🖨 Deal sheet 📄 Offer letter ✓ Due diligence
Multi-family units
County records classify this as Multi-Family (5+ Unit). Listing-text estimate: 4 units. estimate disagrees with records
5+ unit building — per-unit beds/baths from public records are typically unavailable; the breakdown below (if shown) is an estimate from the listing text.
Listing remarks
Turnkey 4-Unit in Prime Urban Corridor! Solid investment opportunity with major capital improvements already in place. This well-maintained fourplex features updated plumbing & electrical, newer windows and appliances, refreshed interiors including carpet, paint, and refinished floors. New electrical with separate panels (2020), vinyl siding (2019), windows (2014), chimney tuck-pointing with new caps (2022), new back railings (2023), and a sealed 4-stall parking lot (2025). Positioned just minutes from downtown & U. S. Bank Stadium, the U of M, light rail access, and a strong mix of retail, coffee, and daily conveniences.
Key facts
- Updated electrical
- 4 unit
- Newer windows
Tags
Property features AI
Finance
- Other: Rental license: Standard (licensed); Lot approximately 0.13 acres (dimensions 40 x 144)
- Financial info: Property contains 4 rental units; Owner pays electricity, insurance, sewer, taxes, trash collection and water; Tenants pay cable TV, electricity and gas; Gross income reported at $53,340; Net operating income reported at $36,224; Reported expenses include fuel $671, electric $693, water/sewer $4,703, insurance $4,041
Exterior
- Parking: Open parking lot
- Utilities: City water (connected); City sewer (connected); Natural gas service; Electric service by Xcel Energy
- Home design: Residential income property; Two levels; Entry facing details not provided
- Construction: Stone foundation; Asphalt roof (over 8 years old)
- Exterior features: Vinyl exterior; City street frontage with curbs, paved streets, sidewalks and storm sewer
Interior
- Kitchen: Ranges in each unit; Refrigerators in each unit
- Bedrooms: Total of 5 bedrooms across the property; Individual unit bedroom counts: three 1-bedroom units, one 2-bedroom unit
- Flooring: Hardwood floors
- Bathrooms: Full bathrooms in each unit (total matches unit counts)
- Heating & cooling: Baseboard heating; Forced air heating; Ductless mini-split cooling in at least one unit
- Interior features: Partial, unfinished basement; Hardwood floors in multiple units; Kitchen windows in multiple units; Main floor primary bedroom in some units; Walk-in closets in select units
- Laundry & utility: No on-site laundry listed
Neighborhood map
What this means for you Summary
Snapshot
- This is a 4 × 5-bed/4.0-bath units multifamily listed at $449k.
Deal economics
- At list price, monthly cash flow is $5k ($56k/yr) — positive. Per door: $1k/mo.
- The deal already cash-flows at list — no discount required.
- Meets the 1% rule at list price ($10k rent vs $449k).
- Recommended offer: $436k (3.0% below list) — sets the bar for market timing.
- Cap rate 18.7% vs local median 3.1% in Minneapolis — top-decile yield for the area; either an underpriced asset or a hidden risk that comps aren't pricing in. Stress-test before assuming the spread holds.
Location & tenants
- Location reads 78/100 on livability (#110 in MN, #2,525 nationally) — a middle-class / working-renter tenant base. Strengths: amenities A+, commute A+, housing A+; Watch: cost of living C-, crime F.
- Minneapolis Public School District (urban): math 35% / reading 46% proficiency, ranked #217 of 301 in MN (top 72%) — families likely to look elsewhere, expect single-tenant / working-renter base with shorter leases.
- Market conditions: Rents rising (+1.0%/yr); 103 active listings in the ZIP; 12 comparable units currently listed for rent nearby; rentals leasing fast (median 14d on market — plan ~1-2 weeks tenant-placement turnaround); lower-income renter base — watch delinquency; 4,651 units permitted in Hennepin County in 2024 (2,443 in 5+ unit buildings).
- At $9,748/mo this rent would consume 279% of the median local household income ($42k/yr) (locally 2999% of renters already pay >50% of income on rent) — very limited rent-growth headroom before tenants either downsize or default.
Forward outlook
- Local home prices are declining (-3.0%/yr); year-one equity from $3k of loan paydown is wiped out by about $13k of value loss. Plan a longer hold.
- Hennepin County population projected at +30% by 2050 — long-run rental-demand tailwind backs the buy-and-hold thesis.
- At projected returns (-3.0% appreciation + 1.0% rent growth), your $126k cash investment doubles in ~3 years — after that, you're playing with house money.
Negotiation context
- It's been on market 56 days — a 3% lower offer ($436k) is reasonable based on typical stale-listing flexibility.
- 7 sale attempts since 17y ago; this cycle's ask has dropped $50k (10%) from the opening price — seller is motivated, your offer sets the floor, not the list.
- Current owner paid $85k; list at $449k implies a 428% gain — meaningful room to come down on a strong offer.
Risks & watch-outs
- Watch-outs: built in 1885 — expect roof / HVAC / electrical / plumbing capex.
Questions for the listing agent
- It's been on market 56 days. Have you received any prior offers? Is the seller open to a 3% concession, seller financing, or rate buy-down credit?
- Can we see the unit-by-unit rent roll, current vacancy, and any below-market leases? What's the average tenancy length?
- What capital expenditures (roof, boiler, parking lot, exteriors) have been made in the last 5 years, and what's planned in the next 2?
- Built in 1885 — when were the roof, HVAC, electrical panel, plumbing, and water heater last replaced?
- Is there a deadline driving the sale (1031 exchange, divorce, estate, relocation)? That informs how much negotiation room exists.
- Crime grade is F in this area — have there been break-ins, vandalism, or insurance claims at this property in the last 3 years? What carrier currently insures it and at what premium?
- What's the average days-on-market for RENTAL listings here right now (not sales)? A rising rental-DOM trend means longer vacancies and softer asking-rent achievability than the comps imply.
- What's the recent tenant-quality profile in this submarket — average credit score on applications, eviction rate, late-payment / NSF rate, and stable-employment percentage? A property-management company in the area should have these aggregated.
- How much new apartment / multifamily construction is in the pipeline within 1–3 miles? Heavy new supply (>2% of stock underway) typically softens rents 12–24 months out; light construction supports rent growth.
Investment metrics
- 1% rule
- 2.17% ✓
- Cap rate
- 18.66%
- Cash-on-cash
- 44.17%
- DSCR
- 2.97
- GRM
- 3.8
CMA / ARV
- ARV (median comp)
- $473,185
- List price
- $449,000
- Delta
- -5.11%
- Verdict
- FAIR
- Comps
- 5 within 2.0 mi
Projected returns pro-forma
-3.0% appreciation · 1.0% rent growth · sell at horizon
- IRR
- 38.9%
- Equity multiple
- 2.61×
- Total profit
- $202,855
- Equity at exit
- $66,947
- IRR
- 44.3%
- Equity multiple
- 4.82×
- Total profit
- $480,845
- Equity at exit
- $38,821
Cash invested: $125,720 (down + closing). Projections, not guarantees.
Landlord ↔ Tenant lean methodology
- Overall (CITY)
- 34 Tenant-Leaning
- State Minnesota
- 46 Balanced · D+2
- County
- — inherits STATE
- City Minneapolis
- 34 Tenant-Leaning · D+50
ZIP-level market 55404
- Home prices YoY
- -33.3%
- Rents YoY
- 1.0%
- Active inventory
- 103
- Price-to-rent
- 15.4×
Monthly cashflow live
- Estimated rent
- $9,748 medium interval (Pro) →
- Mortgage (P&I)
- −$2,355
- Tax from tax record
- −$532 /mo · $6,383/yr
- Insurance
- −$187
- HOA
- −$0
- Vacancy / Maint / Mgmt
- −$2,047
- Net cashflow
- $4,627
Break-even live
4-unit breakdown (identical units grouped — click to expand)
| Units | Beds | Baths | Est. rent |
|---|---|---|---|
| 4× units | 5 | 4 | $9,748 |
| #1 | 5 | 4 | $2,437 |
| #2 | 5 | 4 | $2,437 |
| #3 | 5 | 4 | $2,437 |
| #4 | 5 | 4 | $2,437 |
| Total (4 units) | $9,748 | ||
UW: 25.0% down · 7.5% · 30yr · 1.5% tax · 5.0% vac · 8.0% maint · 8.0% mgmt
Financing live
Cash to close
- Down payment
- $112,250
- Closing costs
- $13,470
- Reserves months
- —
- Total cash needed
- —
Loan-product check · same deal, 3 products live
Conventional
25% down · 7.5% · 30yr
- Down + closing
- —
- Monthly P&I
- —
- Monthly cashflow
- —
- DSCR
- —
- Eligible?
- —
Personal DTI + credit; lowest rate.
DSCR
20% down · 8.5% · 30yr
- Down + closing
- —
- Monthly P&I
- —
- Monthly cashflow
- —
- DSCR
- —
- Eligible?
- —
No personal income docs; deal must DSCR.
Hard money
10% down · 12.0% · 12mo
- Down + closing
- —
- Monthly P&I
- —
- Monthly cashflow
- —
- DSCR
- —
- Eligible?
- —
Short-term bridge; refi at stabilization.
Rent comps 12 comps
| Address | Beds | Baths | Sqft | Rent | $/sqft | DOM | Units | Dist |
|---|---|---|---|---|---|---|---|---|
| 2121 11th Ave S Unit 2 Minneapolis, MN | 4.0 | 1.0 | 1800 | $2,450 | $1.36 | 3d | 1 | 0.24mi |
| 1900 Columbus Ave Unit 1 Minneapolis, MN | 3.0 | 1.5 | 3506 | $2,300 | $0.66 | 43d | 1 | 0.50mi |
| 212 10th Ave S Minneapolis, MN | 3.0 | 1.0–2.5 | 1490 | $8,588 | $5.76 | 1d | 10 | 0.95mi |
| 1111 3rd Ave S Unit 1511914P Minneapolis, MN | 4.0 | 1.0–2.0 | 1081 | $11,990 | $11.09 | 2d | 2 | 1.01mi |
| 220 E 27th St #1 Minneapolis, MN | 4.0 | 1.0 | 2516 | $3,100 | $1.23 | 17d | 1 | 1.12mi |
| 101 S 5th St Minneapolis, MN | 3.0 | 1.0–2.0 | 1249 | $4,049 | $3.24 | 2d | 35 | 1.26mi |
| 365 Nicollet Mall Minneapolis, MN | 3.0 | 1.0–3.5 | 1656 | $9,753 | $5.89 | 3d | 33 | 1.35mi |
| 1369 Spruce Pl Minneapolis, MN | 1.0–3.0 | 1.0–2.5 | 1396 | $6,750 | $4.83 | 2d | 24 | 1.35mi |
| 600 1/2 SE Oak St #1 Minneapolis, MN | 5.0 | 2.0 | 2679 | $3,100 | $1.16 | 17d | 1 | 1.39mi |
| 629 Oak St SE Minneapolis, MN | 5.0 | 2.0 | 2679 | $2,650 | $0.99 | 43d | 1 | 1.40mi |
| 629 Oak St SE Minneapolis, MN | 5.0 | 2.0 | 2679 | $3,100 | $1.16 | 13d | 1 | 1.40mi |
| 2217 Grand Ave S Unit 2215 Minneapolis, MN | 3.0 | 2.0 | 2000 | $2,100 | $1.05 | 43d | 1 | 1.48mi |
Listing history 36 events
-
2026-06-18days on market $449,000 Active 56 DOM
-
2026-06-18price $449,000 Active 55 DOM
-
2026-06-17days on market $484,900 Active 55 DOM
-
2026-06-16days on market $484,900 Active 54 DOM
-
2026-06-15days on market $484,900 Active 53 DOM
-
2026-06-13days on market $484,900 Active 51 DOM
-
2026-06-09days on market $484,900 Active 47 DOM
-
2026-06-08days on market $484,900 Active 46 DOM
-
2026-06-07days on market $484,900 Active 45 DOM
-
2026-06-04days on market $484,900 Active 42 DOM
-
2026-06-03days on market $484,900 Active 41 DOM
-
2026-06-02days on market $484,900 Active 40 DOM
-
2026-06-01days on market $484,900 Active 39 DOM
-
2026-05-31days on market $484,900 Active 38 DOM
-
2026-04-23$499,000 Active 636-char remark
-
2024-05-22$535,000 Active
-
2014-07-15historical
-
2014-06-27$319,000 Active
-
2013-12-19soldstatus $85,000
-
2013-12-11historical
-
2013-12-10soldstatus $85,000 Sold
-
2013-12-03status Pending
-
2013-10-11price $115,000
-
2013-09-07$134,900 Active
-
2010-03-19soldstatus $85,000
-
2010-03-12soldstatus $66,550
-
2010-03-05soldstatus $85,000
-
2010-02-09historical
-
2009-11-11$89,850
-
2009-11-11historical
-
2009-08-20$99,850
-
2009-08-18historical
-
2009-07-10$119,850
-
2007-09-24soldstatus $339,000
-
2005-10-27soldstatus $320,000
-
2003-12-16soldstatus $175,000
ⓘ Source: listings_history table (triggers on properties + properties_extension) + one-shot
backfill from property_details.listing_events for pre-trigger history.
Tax reassessment forecast MN · Partial reset (capped growth)
- Current annual tax
- $6,383 · $532/mo
- Projected year-2 tax
- $6,383 · $532/mo
- Expected delta
- $0/yr ($0/mo · 0.0%)
ⓘ Screening estimate from a state-policy table — verify with the county assessor before closing.
Climate risk First Street
- Flood 1/10 Low FEMA zone X (unshaded) · 0% chance over 30 yrs
- Wildfire 1/10 Low
- Heat 2/10 Low 7 d/yr ≥99°F today · 14 d/yr by 30 yrs out
- Wind 2/10 Low
- Air quality 2/10 Low 1 unhealthy d/yr today · 1 by 30 yrs out
Nearby sold comps map
Loading sold comps map…
Walkable amenities ~0.75 mi
Loading nearby amenities…
Taxation est. · year 1
- Rental income
- $116,976
- − Mortgage interest
- −$25,151
- − Property taxes
- −$6,383
- − Insurance
- −$2,245
- − Repairs & maintenance
- −$9,358
- − Management
- −$9,358
- − Depreciation
- −$13,062
- Taxable income
- $51,419
- Est. tax owed @ 24.0%
- −$12,341
- After-tax cash flow
- $43,187/yr
For passive investors: Depreciation is non-cash, so a rental often shows a tax loss while cash-flowing — sheltering income. Rental losses are passive: they offset passive income freely, and up to $25,000/yr can offset ordinary (W-2) income if you actively participate and your MAGI is under $100k (phasing out to $0 by $150k); unused losses carry forward. On sale, claimed depreciation is recaptured at up to 25%, and gains may owe capital-gains tax (a 1031 exchange can defer both). Figures are a year-1 estimate at your 24.0% rate — not tax advice; consult a CPA.
Schools (NCES district)
- District
- Minneapolis Public School District
- NCES district ID
- 2721240
- Math proficiency
- 35% ▼ -7.00%
- Reading proficiency
- 46% ▼ -1.00%
- Median HH income
- $50,521
- Composite
- 34.92/100
- National rank
- #5067
- State rank
- #217 of 301 in MN
Livability — Minneapolis
- Score
- 78/100
- State rank
- #110
- US rank
- #2525
Category grades
Schools grade is shown separately in the Schools card above.
Census & demographics
- Census place
- Minneapolis, MN
- County
- Hennepin County · 1,150,272 people
- City population
- 417,555
- Metro
- Minneapolis-St. Paul-Bloomington, MN-WI
- Population (ZIP)
- 28,920
- Household income
- $41,940
- Rent vs Own
- Severe rent burden
- 2999.0
Population outlook (Hennepin County) Hauer SSP2
- Today (2025)
- 1,405,227 people
- By 2030
- 1,492,650 · +6.2%
- By 2040
- 1,660,157 · +18.1%
- By 2050
- 1,823,498 · +29.8%
- By 2075
- 2,221,283 · +58.1%
- By 2100
- 2,509,976 · +78.6%
Race, ethnicity, and origin ACS 2023
- Neighborhood character
- Highly diverse neighborhood (Simpson 0.72)
- Race & ethnicity
- White 36% Black 32% Hispanic / Latino 20% Two or more races 10% Native American 5% Asian 4%
- Hispanic origin (detail)
- Mexican 8%
- Common ancestry
- Portuguese 5% Romanian 3% Lithuanian 3%
- Foreign-born
- 24% · Canada, China, United Kingdom
- Languages at home
- 63% English-only · Spanish 13% Other Asian/Pacific 2% French/Haitian/Cajun 1%
Political lean MEDSL · Hennepin
- 2024 margin
- Solid D (+42.6) · D 70.2% · R 27.5% · Other 2.3%
- 2008→2024 swing
- +14.0pp toward D · 2008: 28.6pp · 2024: 42.6pp
- All cycles
- 2024: D+42.6 2020: D+43.2 2016: D+35.3 2012: D+27.1 2008: D+28.6
Not yet ingested
- Civics
- —
Market trends
- HPI YoY
- ▼ -112.31%
- Current HPI
- 224.8886
- Rent YoY
- ▲ 1.00%
- Metro
- Minneapolis-St. Paul-Bloomington, MN-WI
- State GDP YoY
- ▲ 2.41%
- F500 in state
- 34
Industry mix (Fortune 500 HQ in MN)
| Industry | F500 HQs | Revenue |
|---|---|---|
| Healthcare | 2 | $407B |
|
||
| Retail | 2 | $150B |
|
||
| Consumer Goods | 2 | $32B |
|
||
| Industrial Machinery | 2 | $6B |
|
||
| Agriculture | 1 | $40B |
|
||
| Healthcare / Medical Devices | 1 | $32B |
|
||
Price history
+156.6% since first listed24 events — show timeline
- 2026-06-17 Price Changed $449,000 NORTHSTARMLS as Distributed by MLS Grid
- 2026-05-26 Price Changed $484,900 NORTHSTARMLS as Distributed by MLS Grid
- 2026-04-23 Listed $499,000 NORTHSTARMLS as Distributed by MLS Grid
- 2024-05-22 Listed $535,000 NORTHSTARMLS as Distributed by MLS Grid
- 2014-07-15 Listing Removed — NORTHSTARMLS as Distributed by MLS Grid
- 2014-06-27 Listed $319,000 NORTHSTARMLS as Distributed by MLS Grid
- 2013-12-19 Sold (Public Records) $85,000 Public Records
- 2013-12-11 Listing Removed — NORTHSTARMLS as Distributed by MLS Grid
- 2013-12-10 Sold (MLS) $85,000 NORTHSTARMLS as Distributed by MLS Grid
- 2013-12-03 Pending — NORTHSTARMLS as Distributed by MLS Grid
- 2013-10-11 Price Changed $115,000 NORTHSTARMLS as Distributed by MLS Grid
- 2013-09-07 Listed $134,900 NORTHSTARMLS as Distributed by MLS Grid
- 2010-03-19 Sold (Public Records) $85,000 Public Records
- 2010-03-12 Sold (Public Records) $66,550 Public Records
- 2010-03-05 Sold (MLS) $85,000 NORTHSTARMLS as Distributed by MLS Grid
- 2010-02-09 Listing Removed — NORTHSTARMLS as Distributed by MLS Grid
- 2009-11-11 Listing Removed — NORTHSTARMLS as Distributed by MLS Grid
- 2009-11-11 Listed $89,850 NORTHSTARMLS as Distributed by MLS Grid
- 2009-08-20 Listed $99,850 NORTHSTARMLS as Distributed by MLS Grid
- 2009-08-18 Listing Removed — NORTHSTARMLS as Distributed by MLS Grid
- 2009-07-10 Listed $119,850 NORTHSTARMLS as Distributed by MLS Grid
- 2007-09-24 Sold (Public Records) $339,000 Public Records
- 2005-10-27 Sold (Public Records) $320,000 Public Records
- 2003-12-16 Sold (Public Records) $175,000 Public Records
Property tax history
+3.6%/yrLatest (2025): $6,383 · +10.5% YoY. Source: county tax records.
Cash-flow waterfall
monthlySold comps — $/sqft
last 12 mo · ≤1 miLoading sold comps…