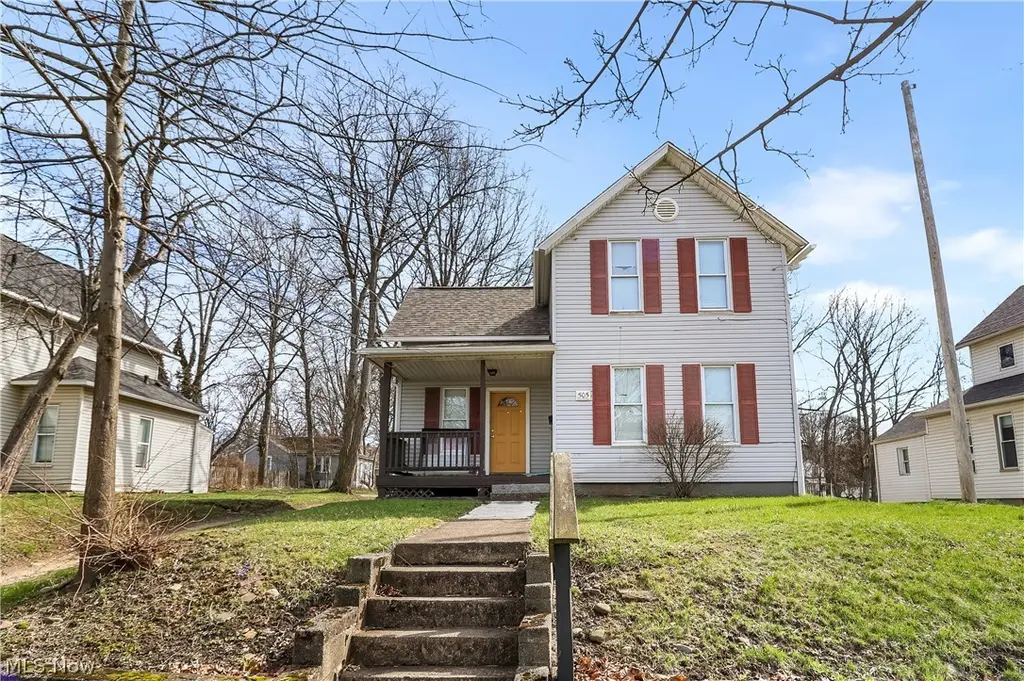
505 Brown St · Akron, OH
Flood risk 1/10 · Minimal
- FEMA flood zone
- X (unshaded)
- Chance of flooding over 30 yrs
- 0.0%
- Est. flood insurance / yr
- $473 – $860
Fire risk 1/10 · Minimal
- Est. fire insurance / yr
- $713 – $1,323
Heat risk 3/10 · Minor
- Hot days now (above 97°F)
- 7 days/yr
- Hot days in 30 yrs
- 17 days/yr
Wind risk 1/10 · Minimal
- Chance of severe wind over 30 yrs
- —
Air-quality risk 3/10 · Minor
- Unhealthy air days now
- 2 days/yr
- Unhealthy air days in 30 yrs
- 4 days/yr
Risk factors via First Street. Map © Google.
Why this score? — see what drove the D grade
The composite is a weighted blend of 9 inputs, each scored 0–100. Each bar is that input's sub-score; the figure is the points it added to the 100-point composite (weight × sub-score).
- Cash flow +19.5/30.0
- DSCR +6.2/10.0
- 1% rule +5.6/10.0
- Livability +4.0/5.0
- Rent growth +2.5/5.0
- Condition / age +2.5/5.0
- ARV discount +2.3/15.0
- Schools +2.1/10.0
- Appreciation +0.0/10.0
$118,000
🖨 Deal sheet (PDF) 📄 Offer letter ✓ Due diligence
Listing remarks MLS
This single-family home at 505 Brown St, Akron presents a fantastic opportunity for both homeowners and investors, featuring an impressive list of recent capital improvements and mechanical upgrades. The property boasts a brand-new roof (2025), a new furnace installed in 2024, and a 2023 water heater, ensuring efficiency and peace of mind for years to come. Significant infrastructure work has also been completed, including a new main sewer line to the street in 2024 and professional tree removal in 2025. The interior has been well-maintained with flooring and cabinets updated around 2020, a bathroom renovation in 2017, and a suite of newer appliances, including a 2026 range, 2025 washer, and 2022 dryer. The property includes a clear value-add improvement plan, offering the chance to build immediate equity through interior paint touch-ups, new LVP flooring, and refreshed exterior decking. This home is currently part of a strategic real estate portfolio on Brown Street and can be purchased individually or as a package deal. Combining this property with neighboring listings at 499, 511, and 517 Brown St allows an investor to instantly scale their presence in the Akron market with a concentrated group of high-potential assets. Whether you are looking for a move-in-ready residence with solid mechanicals or a high-yield addition to your rental portfolio, this property is a standout choice. Seller Financing available for the full portfolio of properties.
Key facts
- New furnace
- New water heater
- Updated flooring
Tags
Neighborhood map
What this means for you Summary
Snapshot
- This is a 4-bed/1.0-bath single-family listed at $118k.
Deal economics
- At list price, monthly cash flow is $135 ($2k/yr) — positive.
- The deal already cash-flows at list — no discount required.
- Meets the 1% rule at list price ($1k rent vs $118k).
- Recommended offer: $111k (6.0% below list) — sets the bar for market timing.
Location & tenants
- Location reads 81/100 on livability (#104 in OH, #1,591 nationally) — a professional / high-income tenant draw. Strengths: amenities A+, commute A+, cost of living A+; Watch: crime F, employment F.
- Akron City (urban): math 22% / reading 30% proficiency, ranked #602 of 656 in OH (top 92%) — low school quality limits family demand, transient renter base, plan for 1-2y turnover; 66% free/reduced lunch — lower-income household profile, screen leases tightly.
- Zoned schools: Leggett Community Learning Center (math 17% / reading 22%, grade F, #1,293 of 1,584 statewide, top 83%, 371 students, 0% FRL); Jennings Community Learning Center (math 12% / reading 18%, grade F, #627 of 654 statewide, top 96%, 757 students, 0% FRL); North High School (math 2% / reading 15%, grade F, #755 of 781 statewide, top 97%, 916 students, 0% FRL) — zoned schools average 0% FRL vs 66% district-wide (66 pts lower); this property's tenant base skews higher-income than the district average.
- Market conditions: 54 active listings in the ZIP; 40 comparable units currently listed for rent nearby; rentals at typical pace (median 25d on market — plan ~3-4 weeks tenant-placement turnaround); 48% of comp listings sitting > 30 days — soft ceiling on asking rent; lower-income renter base — watch delinquency; 1,114 units permitted in Summit County in 2024 (397 in 5+ unit buildings).
- At $1,252/mo this rent would consume 62% of the median local household income ($24k/yr) (locally 659% of renters already pay >50% of income on rent) — very limited rent-growth headroom before tenants either downsize or default.
Forward outlook
- Local home prices are declining (-3.0%/yr); year-one equity from $816 of loan paydown is wiped out by about $4k of value loss. Plan a longer hold.
- Summit County population projected to shrink 6% by 2050 — rents likely to lag national; underwrite the cash flow, not the appreciation.
Negotiation context
- It's been on market 66 days — a 6% lower offer ($111k) is reasonable based on typical stale-listing flexibility.
- Current owner paid $70k; list at $118k implies a 69% gain — meaningful room to come down on a strong offer.
Risks & watch-outs
- Watch-outs: built in 1894 — expect roof / HVAC / electrical / plumbing capex.
Questions for the listing agent
- It's been on market 66 days. Have you received any prior offers? Is the seller open to a 6% concession, seller financing, or rate buy-down credit?
- Built in 1894 — when were the roof, HVAC, electrical panel, plumbing, and water heater last replaced?
- Why hasn't it sold? Are there any deal-killer items the seller is aware of (foundation, flood, title, zoning, code violations)?
- Is there a deadline driving the sale (1031 exchange, divorce, estate, relocation)? That informs how much negotiation room exists.
- Crime grade is F in this area — have there been break-ins, vandalism, or insurance claims at this property in the last 3 years? What carrier currently insures it and at what premium?
- The area grade is low — what's the realistic commute time and amenity access for the typical tenant pool here? Any planned neighborhood developments (good or bad) we should know about?
- What's the average days-on-market for RENTAL listings here right now (not sales)? A rising rental-DOM trend means longer vacancies and softer asking-rent achievability than the comps imply.
- What's the recent tenant-quality profile in this submarket — average credit score on applications, eviction rate, late-payment / NSF rate, and stable-employment percentage? A property-management company in the area should have these aggregated.
- How much new for-sale + rental construction is in the pipeline within 1–3 miles? Heavy new supply typically softens prices + rents 12–24 months out; constrained supply supports both.
Investment metrics
- 1% rule
- 1.06% ✓
- Cap rate
- 7.66%
- Cash-on-cash
- 4.90%
- DSCR
- 1.22
- GRM
- 7.9
CMA / ARV
- ARV (median comp)
- $105,723
- List price
- $118,000
- Delta
- 11.61%
- Verdict
- OVERPRICED
- Comps
- 20 within 1.0 mi
Show comp detail 12 sales within ~0.75 mi
| Address | Dist | Beds/Ba | Sqft | Sold | Price | $/sf | Match |
|---|---|---|---|---|---|---|---|
| 591 Hedden Ave | 0.33mi | 3/1.0 (-1) | 1,224 (-1%) | 2mo | $63,500 | $52 | 76 |
| 381 Bethwayne Ct | 0.17mi | 4/1.0 | 1,152 (-7%) | 8mo | $70,000 | $61 | 73 |
| 713 Kling St | 0.37mi | 4/1.0 | 1,302 (+5%) | 5mo | $75,000 | $58 | 70 |
| 668 Sherman St | 0.43mi | 3/1.0 (-1) | 1,274 (+3%) | 4mo | $60,000 | $47 | 67 |
| 314 Sterling Ct | 0.20mi | 4/1.0 | 1,112 (-10%) | 9mo | $101,000 | $91 | 66 |
| 508 Crouse St | 0.26mi | 4/2.0 | 1,370 (+10%) | 2mo | $62,500 | $46 | 65 |
| 538 Hammel St | 0.48mi | 3/1.0 (-1) | 1,298 (+5%) | 8mo | $123,000 | $95 | 58 |
| 319 Sterling Ct | 0.21mi | 3/2.0 (-1) | 1,400 (+13%) | 5mo | $140,000 | $100 | 56 |
| 885 Brown St | 0.71mi | 4/2.0 | 1,280 (+3%) | 2mo | $93,500 | $73 | 55 |
| 70 Wise St | 0.67mi | 3/1.0 (-1) | 1,197 (-4%) | 5mo | $80,000 | $67 | 54 |
| 848 Kling St | 0.62mi | 4/2.5 | 1,160 (-6%) | 5mo | $110,000 | $95 | 50 |
| 642 Gridley Ave | 0.66mi | 4/2.0 | 1,399 (+13%) | 5mo | $45,000 | $32 | 40 |
Match score weights: distance 35% · size 25% · config 20% · recency 20%. Top-matched comps best support the ARV.
Projected returns pro-forma
-3.0% appreciation · 3.0% rent growth · sell at horizon
- IRR
- -8.6%
- Equity multiple
- 0.68×
- Total profit
- $-10,492
- Equity at exit
- $17,594
- IRR
- 0.9%
- Equity multiple
- 1.06×
- Total profit
- $2,093
- Equity at exit
- $10,202
Cash invested: $33,040 (down + closing). Projections, not guarantees.
Landlord ↔ Tenant lean methodology
- Overall (STATE)
- 73 Landlord-Friendly
- State Ohio
- 73 Landlord-Friendly · R+6
- County
- — inherits STATE
- City
- — inherits STATE
ZIP-level market 44311
- Home prices YoY
- -28.4%
- Active inventory
- 54
- Price-to-rent
- 7.9×
Monthly cashflow live
- Estimated rent
- $1,252 high interval (Pro) →
- Mortgage (P&I)
- −$619
- Tax from tax record
- −$186 /mo · $2,233/yr
- Insurance
- −$49
- HOA
- −$0
- Vacancy / Maint / Mgmt
- −$263
- Net cashflow
- $135
Break-even live
Sensitivity live
| Price | -10% $202 | -5% $168 | +0% $135 | +5% $101 | +10% $68 |
|---|---|---|---|---|---|
| Rent | -10% $36 | -5% $85 | +0% $135 | +5% $184 | +10% $234 |
| Rate | -1.0pp $194 | -0.5pp $165 | base $135 | +0.5pp $104 | +1.0pp $73 |
UW: 25.0% down · 7.5% · 30yr · 1.5% tax · 5.0% vac · 8.0% maint · 8.0% mgmt
Financing live
Cash to close
- Down payment
- $29,500
- Closing costs
- $3,540
- Reserves months
- —
- Total cash needed
- —
Loan-product check · same deal, 3 products live
Conventional
25% down · 7.5% · 30yr
- Down + closing
- —
- Monthly P&I
- —
- Monthly cashflow
- —
- DSCR
- —
- Eligible?
- —
Personal DTI + credit; lowest rate.
DSCR
20% down · 8.5% · 30yr
- Down + closing
- —
- Monthly P&I
- —
- Monthly cashflow
- —
- DSCR
- —
- Eligible?
- —
No personal income docs; deal must DSCR.
Hard money
10% down · 12.0% · 12mo
- Down + closing
- —
- Monthly P&I
- —
- Monthly cashflow
- —
- DSCR
- —
- Eligible?
- —
Short-term bridge; refi at stabilization.
Rent comps 40 comps
| Address | Beds | Baths | Sqft | Rent | $/sqft | DOM | Units | Dist |
|---|---|---|---|---|---|---|---|---|
| 418 Power St Akron, OH | 3.0 | 1.0 | 1000 | $999 | $1.00 | 25d | 1 | 0.06mi |
| 356 Rankin St Akron, OH | 4.0 | 1.5 | 1186 | $1,197 | $1.01 | 25d | 1 | 0.06mi |
| 420 Power St Akron, OH | 3.0 | 1.0 | 900 | $800 | $0.89 | 25d | 1 | 0.07mi |
| 548 Spicer St Akron, OH | 4.0 | 2.0 | 1487 | $1,100 | $0.74 | 25d | 1 | 0.12mi |
| 461 Spicer St Akron, OH | 3.0 | 2.0 | 1000 | $995 | $0.99 | 45d | 1 | 0.14mi |
| 490 Gage St Akron, OH | 4.0 | 1.0 | 1326 | $1,053 | $0.79 | 45d | 1 | 0.16mi |
| 287 Wheeler St Akron, OH | 3.0 | 1.0 | 1100 | $1,350 | $1.23 | 25d | 1 | 0.23mi |
| 566 Sumner St Akron, OH | 4.0 | 1.0 | 1170 | $1,200 | $1.03 | 45d | 1 | 0.26mi |
| 421 Allyn St Unit 2 Akron, OH | 3.0 | 1.0 | 743 | $850 | $1.14 | 45d | 1 | 0.27mi |
| 437 Sumner St Apt A Akron, OH | 3.0 | 1.5 | 750 | $1,200 | $1.60 | 25d | 1 | 0.31mi |
| 689 Kling St Akron, OH | 3.0 | 1.0 | 780 | $1,075 | $1.38 | 23d | 1 | 0.32mi |
| 374 E Voris St Akron, OH | 3.0 | 1.0 | 876 | $1,150 | $1.31 | 25d | 1 | 0.34mi |
| 600 Sherman St Akron, OH | 4.0 | 1.0–2.0 | 824 | $1,600 | $1.94 | 16d | 14 | 0.36mi |
| 406 Sumner St Akron, OH | 2.0–4.0 | 1.0–2.0 | 836 | $1,295 | $1.55 | 16d | 3 | 0.37mi |
| 344 Lease St Akron, OH | 3.0 | 1.0 | 1000 | $1,199 | $1.20 | 45d | 1 | 0.47mi |
| 796 Brown St Akron, OH | 4.0 | 2.0 | 1200 | $900 | $0.75 | 45d | 1 | 0.54mi |
| 878 Clark St Akron, OH | 3.0 | 2.0 | 1029 | $1,440 | $1.40 | 45d | 1 | 0.63mi |
| 885 Brown St Akron, OH | 4.0 | 2.0 | 1280 | $1,400 | $1.09 | 25d | 1 | 0.72mi |
| 907 Kling St Akron, OH | 3.0 | 1.0 | 1248 | $1,250 | $1.00 | 16d | 1 | 0.74mi |
| 22 E Exchange St Apt 310 Akron, OH | 3.0 | 3.0 | 1496 | $1,962 | $1.31 | 45d | 1 | 0.79mi |
| 401 S Main St Akron, OH | 4.0 | 1.0–4.0 | 814 | $1,871 | $2.30 | 16d | 54 | 0.80mi |
| 987 Boone St Akron, OH | 3.0 | 1.0 | 1248 | $1,100 | $0.88 | 25d | 1 | 0.81mi |
| 621 Hudson Ave Akron, OH | 3.0 | 1.0 | 780 | $1,100 | $1.41 | 16d | 1 | 0.95mi |
| 1071 Ackley St Akron, OH | 4.0 | 2.0 | 1164 | $1,175 | $1.01 | 45d | 1 | 0.98mi |
| 1028 Kling St Akron, OH | 4.0 | 2.0 | 1500 | $1,450 | $0.97 | 45d | 1 | 0.99mi |
| 979 Neptune Ave Akron, OH | 3.0 | 1.0 | 1248 | $1,250 | $1.00 | 25d | 1 | 0.99mi |
| 1139 Marcy St Akron, OH | 4.0 | 1.5 | 1300 | $1,300 | $1.00 | 45d | 1 | 1.00mi |
| 156 S Main St Akron, OH | 2.0–3.0 | 2.0 | 1197 | $2,985 | $2.49 | 25d | 4 | 1.03mi |
| 1036 Neptune Ave Akron, OH | 3.0 | 1.0 | 1000 | $1,350 | $1.35 | 45d | 1 | 1.09mi |
| 1040 Neptune Ave Akron, OH | 4.0 | 1.0 | 1400 | $1,300 | $0.93 | 45d | 1 | 1.10mi |
| 1125 2nd Ave Akron, OH | 3.0 | 1.0 | 1373 | $1,100 | $0.80 | 25d | 1 | 1.11mi |
| 1085 Herberich Ave Akron, OH | 4.0 | 1.0 | 1350 | $1,400 | $1.04 | 45d | 1 | 1.11mi |
| 166 Chittenden St Akron, OH | 3.0 | 1.0 | 1020 | $985 | $0.97 | 45d | 1 | 1.12mi |
| 990 Baird St Akron, OH | 3.0 | 1.0 | 1140 | $1,250 | $1.10 | 45d | 1 | 1.13mi |
| 846 Lee Dr Akron, OH | 4.0 | 1.0 | 1433 | $1,325 | $0.92 | 16d | 1 | 1.14mi |
| 846 Lee Dr Akron, OH | 4.0 | 1.5 | 1433 | $1,325 | $0.92 | 25d | 1 | 1.14mi |
| 1114 Herberich Ave Akron, OH | 4.0 | 1.0 | 1308 | $1,200 | $0.92 | 45d | 1 | 1.19mi |
| 488 Alexander St Akron, OH | 4.0 | 2.0 | 1311 | $1,350 | $1.03 | 25d | 1 | 1.22mi |
| 1102 Neptune Ave Akron, OH | 3.0 | 1.0 | 1000 | $1,200 | $1.20 | 45d | 1 | 1.22mi |
| 77 Kent Ct Akron, OH | 4.0 | 1.0 | 1300 | $1,200 | $0.92 | 45d | 1 | 1.23mi |
Listing history 17 events
-
2026-06-13days on market $118,000 Active 66 DOM
-
2026-06-10days on market $118,000 Active 64 DOM
-
2026-06-09days on market $118,000 Active 63 DOM
-
2026-06-08days on market $118,000 Active 62 DOM
-
2026-06-07days on market $118,000 Active 61 DOM
-
2026-06-05days on market $118,000 Active 58 DOM
-
2026-06-03days on market $118,000 Active 57 DOM
-
2026-06-02days on market $118,000 Active 56 DOM
-
2026-06-01days on market $118,000 Active 55 DOM
-
2026-05-31days on market $118,000 Active 54 DOM
-
2026-05-31days on market $118,000 Active 53 DOM
-
2026-04-07$118,000 Active 1471-char remark
Show marketing remark (1471 chars)
This single-family home at 505 Brown St, Akron presents a fantastic opportunity for both homeowners and investors, featuring an impressive list of recent capital improvements and mechanical upgrades. The property boasts a brand-new roof (2025), a new furnace installed in 2024, and a 2023 water heater, ensuring efficiency and peace of mind for years to come. Significant infrastructure work has also been completed, including a new main sewer line to the street in 2024 and professional tree removal in 2025. The interior has been well-maintained with flooring and cabinets updated around 2020, a bathroom renovation in 2017, and a suite of newer appliances, including a 2026 range, 2025 washer, and 2022 dryer. The property includes a clear value-add improvement plan, offering the chance to build immediate equity through interior paint touch-ups, new LVP flooring, and refreshed exterior decking. This home is currently part of a strategic real estate portfolio on Brown Street and can be purchased individually or as a package deal. Combining this property with neighboring listings at 499, 511, and 517 Brown St allows an investor to instantly scale their presence in the Akron market with a concentrated group of high-potential assets. Whether you are looking for a move-in-ready residence with solid mechanicals or a high-yield addition to your rental portfolio, this property is a standout choice. Seller Financing available for the full portfolio of properties.
-
2009-07-10soldstatus $70,000
-
2001-10-19soldstatus $63,000
-
1992-05-12soldstatus $35,000
-
1988-05-06soldstatus $45,000
-
1984-10-05soldstatus $14,250
ⓘ Source: listings_history table (triggers on properties + properties_extension) + one-shot
backfill from property_details.listing_events for pre-trigger history.
Tax reassessment forecast OH · Partial reset (capped growth)
- Current annual tax
- $2,233 · $186/mo
- Projected year-2 tax
- $2,233 · $186/mo
- Expected delta
- $0/yr ($0/mo · 0.0%)
ⓘ Screening estimate from a state-policy table — verify with the county assessor before closing.
Climate risk First Street
- Flood 1/10 Low FEMA zone X (unshaded) · 0% chance over 30 yrs
- Wildfire 1/10 Low
- Heat 3/10 Moderate 7 d/yr ≥97°F today · 17 d/yr by 30 yrs out
- Wind 1/10 Low
- Air quality 3/10 Moderate 2 unhealthy d/yr today · 4 by 30 yrs out
Nearby sold comps map
Loading sold comps map…
Walkable amenities ~0.75 mi
Loading nearby amenities…
Taxation est. · year 1
- Rental income
- $15,021
- − Mortgage interest
- −$6,610
- − Property taxes
- −$2,233
- − Insurance
- −$590
- − Repairs & maintenance
- −$1,202
- − Management
- −$1,202
- − Depreciation
- −$3,433
- Taxable loss
- −$248
- Est. tax savings @ 24.0%
- +$60
- After-tax cash flow
- $1,677/yr
For passive investors: Depreciation is non-cash, so a rental often shows a tax loss while cash-flowing — sheltering income. Rental losses are passive: they offset passive income freely, and up to $25,000/yr can offset ordinary (W-2) income if you actively participate and your MAGI is under $100k (phasing out to $0 by $150k); unused losses carry forward. On sale, claimed depreciation is recaptured at up to 25%, and gains may owe capital-gains tax (a 1031 exchange can defer both). Figures are a year-1 estimate at your 24.0% rate — not tax advice; consult a CPA.
Schools (NCES district)
- District
- Akron City
- NCES district ID
- 3904348
- Math proficiency
- 22% ▼ -17.00%
- Reading proficiency
- 30% ▼ -12.00%
- Median HH income
- $33,811
- Composite
- 21.31/100
- National rank
- #8383
- State rank
- #602 of 656 in OH
Livability — Akron
- Score
- 81/100
- State rank
- #104
- US rank
- #1591
Category grades
Schools grade is shown separately in the Schools card above.
Census & demographics
- Census place
- Akron, OH
- County
- Summit County · 440,783 people
- City population
- 174,375
- Metro
- Akron, OH
- Population (ZIP)
- 7,547
- Household income
- $24,369
- Rent vs Own
- Severe rent burden
- 659.0
Population outlook (Summit County) Hauer SSP2
- Today (2025)
- 546,583 people
- By 2030
- 544,028 · -0.5%
- By 2040
- 531,363 · -2.8%
- By 2050
- 514,923 · -5.8%
- By 2075
- 481,765 · -11.9%
- By 2100
- 432,265 · -20.9%
Race, ethnicity, and origin ACS 2023
- Neighborhood character
- Diverse neighborhood (Simpson 0.60)
- Race & ethnicity
- White 53% Black 35% Two or more races 6% Hispanic / Latino 4% Asian 3%
- Common ancestry
- Lithuanian 2% Romanian 2% Slovak 2%
- Foreign-born
- 3% · Canada, Vietnam, Philippines
- Languages at home
- 95% English-only · Spanish 2% Other Asian/Pacific 1% Other Indo-European 1%
Political lean MEDSL · Summit
- 2024 margin
- Lean D (+7.0) · D 53.0% · R 46.0%
- 2008→2024 swing
- -9.6pp toward R · 2008: 16.6pp · 2024: 7.0pp
- All cycles
- 2024: D+7.0 2020: D+9.6 2016: D+8.2 2012: D+14.8 2008: D+16.6
Not yet ingested
- Civics
- —
Market trends
- HPI YoY
- ▼ -39.01%
- Current HPI
- 98.3809
- Rent YoY
- —
- Metro
- Akron, OH
- State GDP YoY
- ▲ 1.98%
- F500 in state
- 48
Industry mix (Fortune 500 HQ in OH)
| Industry | F500 HQs | Revenue |
|---|---|---|
| Insurance | 3 | $145B |
|
||
| Industrial Machinery | 3 | $49B |
|
||
| Financial Services | 3 | $24B |
|
||
| Consumer Goods | 2 | $93B |
|
||
| Aerospace / Defense | 2 | $47B |
|
||
| Utilities | 2 | $33B |
|
||
Price history
+728.1% since first listed6 events — show timeline
- 2026-04-07 Listed $118,000 MLSNOW
- 2009-07-10 Sold (Public Records) $70,000 Public Records
- 2001-10-19 Sold (Public Records) $63,000 Public Records
- 1992-05-12 Sold (Public Records) $35,000 Public Records
- 1988-05-06 Sold (Public Records) $45,000 Public Records
- 1984-10-05 Sold (Public Records) $14,250 Public Records
Property tax history
+4.3%/yrLatest (2025): $2,233 · +0.2% YoY. Source: county tax records.
Cash-flow waterfall
monthlySold comps — $/sqft
last 12 mo · ≤1 miLoading sold comps…