 11-Plex
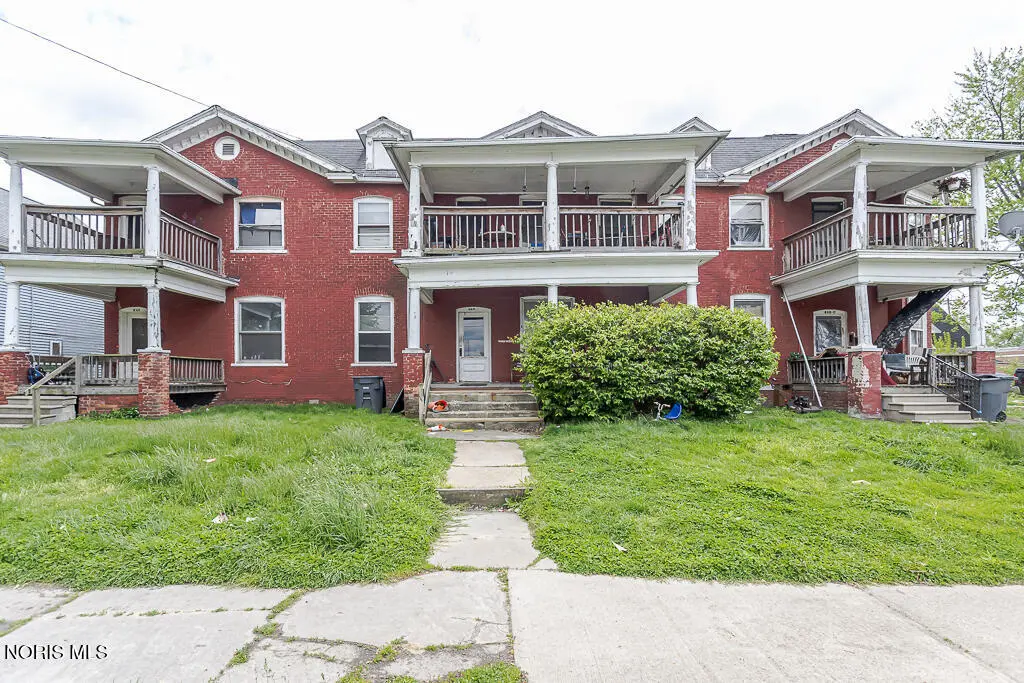
641 South Ave · Toledo, OH
Flood risk 1/10 · Minimal
- FEMA flood zone
- X (unshaded)
- Chance of flooding over 30 yrs
- 0.0%
- Est. flood insurance / yr
- $507 – $1,088
Fire risk 1/10 · Minimal
- Est. fire insurance / yr
- $713 – $1,323
Heat risk 3/10 · Minor
- Hot days now (above 100°F)
- 7 days/yr
- Hot days in 30 yrs
- 16 days/yr
Wind risk 2/10 · Minimal
- Chance of severe wind over 30 yrs
- —
Air-quality risk 2/10 · Minimal
- Unhealthy air days now
- 1 days/yr
- Unhealthy air days in 30 yrs
- 2 days/yr
Risk factors via First Street. Map © Google.
Why this score? — see what drove the B grade
The composite is a weighted blend of 9 inputs, each scored 0–100. Each bar is that input's sub-score; the figure is the points it added to the 100-point composite (weight × sub-score).
- Cash flow +30.0/30.0
- 1% rule +10.0/10.0
- DSCR +10.0/10.0
- ARV discount +7.5/15.0
- Appreciation +5.4/10.0
- Rent growth +4.5/5.0
- Livability +3.3/5.0
- Condition / age +2.5/5.0
- Schools +1.6/10.0
$265,000
🖨 Deal sheet 📄 Offer letter ✓ Due diligence
Multi-family units
County records classify this as Multi-Family (5+ Unit). Listing-text estimate: 11 units. confirmed
5+ unit building — per-unit beds/baths from public records are typically unavailable; the breakdown below (if shown) is an estimate from the listing text.
Listing remarks MLS
11-UNIT BRICK BUILDING WITH EIGHT 1-BEDROOM UNITS / TWO 2-BEDROOM UNITS / ONE STUDIO APARTMENT. ONE UNIT IS VACANT (Unit 3 - 643B). NO WRITTEN LEASES FOR ANY TENANTS. ELECTRIC UPDATED 8 YEARS AGO TO CIRCUIT BREAKERS (220 IN BSMT FOR DRYER). STEAM HEAT WITH 2 BOILER SYSTEMS (APPROX. 16 YEARS OLD). ROOF INSTALLED APPROXIMATELY 2001. SELLER PAYS ALL UTILITIES. ON-SITE CARETAKER TAKES CARE OF LAWN, SNOW, COLLECTING RENTS, REPAIRS (LIVES RENT FREE IN UNIT 4 - 643C). VACANT LOT TO THE WEST COULD BE PURCHASED FROM THE CITY AT A LOW PRICE FOR ADD'L PARKING. RENTAL INCOME COULD BE OVER $5,000/MONTH.
Key facts
- 0.28 acre lot
- Built 1922
- Listed 34 days
Property features AI
Finance
- Financial info: 11 total units (6 leased, 5 vacant)
Exterior
- Parking: Additional parking available
- Utilities: Electricity available; Natural gas connected; Public sewer; Sewer available/connected; Public water available
- Home design: Residential income property (apartment); Multi-family structure; Two levels / 2 stories
- Construction: Wood siding construction; Other foundation details; Built as multi-unit apartment (one building)
- Exterior features: Shingle roof
Interior
- Kitchen: No appliances listed
- Flooring: Other flooring
- Heating & cooling: Boiler heating; Has heating
- Interior features: Other interior features
- Laundry & utility: Other laundry features; Owner pays all utilities
Neighborhood map
What this means for you Summary
Snapshot
- This is a 11 × 1-bed/1-bath units multifamily listed at $265k.
Deal economics
- At list price, monthly cash flow is $6k ($72k/yr) — positive. Per door: $549/mo.
- The deal already cash-flows at list — no discount required.
- Meets the 1% rule at list price ($10k rent vs $265k).
- Recommended offer: $257k (3.0% below list) — sets the bar for market timing.
- Cap rate 33.6% vs local median 7.6% in Toledo — top-decile yield for the area; either an underpriced asset or a hidden risk that comps aren't pricing in. Stress-test before assuming the spread holds.
Location & tenants
- Location reads 66/100 on livability (#645 in OH) — a middle-class / working-renter tenant base. Strengths: cost of living A+, housing A+, health & safety A+; Watch: amenities C-, crime F, commute F.
- Toledo City (urban): math 15% / reading 24% proficiency, ranked #634 of 656 in OH (top 97%) — low school quality limits family demand, transient renter base, plan for 1-2y turnover; 72% free/reduced lunch — lower-income household profile, screen leases tightly.
- Zoned schools: Marshall Stemm Academy (math 2% / reading 8%, grade F, #1,554 of 1,584 statewide, top 100%, 374 students, 0% FRL); Bowsher High School (math 23% / reading 45%, grade F, #596 of 781 statewide, top 76%, 1,240 students, 49% FRL) — zoned schools average 25% FRL vs 72% district-wide (47 pts lower); this property's tenant base skews higher-income than the district average.
- Market conditions: Rents rising fast (+7.8%/yr); 99 active listings in the ZIP; lower-income renter base — watch delinquency; 415 units permitted in Lucas County in 2024 (122 in 5+ unit buildings).
- At $10,093/mo this rent would consume 286% of the median local household income ($42k/yr) (locally 1603% of renters already pay >50% of income on rent) — very limited rent-growth headroom before tenants either downsize or default.
Forward outlook
- In year one you build about $4k of equity ($2k loan paydown + $2k appreciation (0.8% local appreciation)).
- Lucas County population projected at -16% by 2050 — secular population decline; favor cash flow + early exit over multi-decade hold.
- At projected returns (0.8% appreciation + 7.8% rent growth), your $74k cash investment doubles in ~1 year — after that, you're playing with house money.
- By year 8, paydown + projected appreciation supports a ~$32k cash-out refi (75% LTV) — recoverable capital for the next deal without selling this one.
Negotiation context
- It's been on market 34 days — a 3% lower offer ($257k) is reasonable based on typical stale-listing flexibility.
- 5 sale attempts since 5y ago; this cycle's ask is 6% above the opening price — seller raised mid-cycle; expect resistance to lowballs.
Risks & watch-outs
- Watch-outs: built in 1922 — expect roof / HVAC / electrical / plumbing capex.
Questions for the listing agent
- It's been on market 34 days. Have you received any prior offers? Is the seller open to a 3% concession, seller financing, or rate buy-down credit?
- Can we see the unit-by-unit rent roll, current vacancy, and any below-market leases? What's the average tenancy length?
- What capital expenditures (roof, boiler, parking lot, exteriors) have been made in the last 5 years, and what's planned in the next 2?
- Built in 1922 — when were the roof, HVAC, electrical panel, plumbing, and water heater last replaced?
- Is there a deadline driving the sale (1031 exchange, divorce, estate, relocation)? That informs how much negotiation room exists.
- Schools are D-rated, which usually means shorter tenancies and higher turnover. Who's the typical renter profile here, and what's been the actual vacancy rate?
- Crime grade is F in this area — have there been break-ins, vandalism, or insurance claims at this property in the last 3 years? What carrier currently insures it and at what premium?
- What's the average days-on-market for RENTAL listings here right now (not sales)? A rising rental-DOM trend means longer vacancies and softer asking-rent achievability than the comps imply.
- What's the recent tenant-quality profile in this submarket — average credit score on applications, eviction rate, late-payment / NSF rate, and stable-employment percentage? A property-management company in the area should have these aggregated.
- How much new apartment / multifamily construction is in the pipeline within 1–3 miles? Heavy new supply (>2% of stock underway) typically softens rents 12–24 months out; light construction supports rent growth.
Investment metrics
- 1% rule
- 3.81% ✓
- Cap rate
- 33.62%
- Cash-on-cash
- 97.59%
- DSCR
- 5.34
- GRM
- 2.2
CMA / ARV
- ARV (median comp)
- $54,963
- List price
- $265,000
- Delta
- 382.14%
- Verdict
- OVERPRICED
- Comps
- 20 within 1.0 mi
Projected returns pro-forma
0.75% appreciation · 7.8% rent growth · sell at horizon
- IRR
- —
- Equity multiple
- 6.89×
- Total profit
- $437,389
- Equity at exit
- $87,027
- IRR
- —
- Equity multiple
- 16.55×
- Total profit
- $1,154,104
- Equity at exit
- $113,037
Cash invested: $74,200 (down + closing). Projections, not guarantees.
Landlord ↔ Tenant lean methodology
- Overall (STATE)
- 73 Landlord-Friendly
- State Ohio
- 73 Landlord-Friendly · R+6
- County
- — inherits STATE
- City
- — inherits STATE
ZIP-level market 43609
- Home prices YoY
- 0.3%
- Rents YoY
- 7.8%
- Active inventory
- 99
- Price-to-rent
- 24.1×
Monthly cashflow live
- Estimated rent
- $10,093 high interval (Pro) →
- Mortgage (P&I)
- −$1,390
- Tax from tax record
- −$439 /mo · $5,266/yr
- Insurance
- −$110
- HOA
- −$0
- Vacancy / Maint / Mgmt
- −$2,120
- Net cashflow
- $6,035
Break-even live
11-unit breakdown (identical units grouped — click to expand)
| Units | Beds | Baths | Est. rent |
|---|---|---|---|
| 11× units | 1 | 1 | $10,098 |
| #1 | 1 | 1 | $918 |
| #2 | 1 | 1 | $918 |
| #3 | 1 | 1 | $918 |
| #4 | 1 | 1 | $918 |
| #5 | 1 | 1 | $918 |
| #6 | 1 | 1 | $918 |
| #7 | 1 | 1 | $918 |
| #8 | 1 | 1 | $918 |
| #9 | 1 | 1 | $918 |
| #10 | 1 | 1 | $918 |
| #11 | 1 | 1 | $918 |
| Total (11 units) | $10,093 | ||
UW: 25.0% down · 7.5% · 30yr · 1.5% tax · 5.0% vac · 8.0% maint · 8.0% mgmt
Financing live
Cash to close
- Down payment
- $66,250
- Closing costs
- $7,950
- Reserves months
- —
- Total cash needed
- —
Loan-product check · same deal, 3 products live
Conventional
25% down · 7.5% · 30yr
- Down + closing
- —
- Monthly P&I
- —
- Monthly cashflow
- —
- DSCR
- —
- Eligible?
- —
Personal DTI + credit; lowest rate.
DSCR
20% down · 8.5% · 30yr
- Down + closing
- —
- Monthly P&I
- —
- Monthly cashflow
- —
- DSCR
- —
- Eligible?
- —
No personal income docs; deal must DSCR.
Hard money
10% down · 12.0% · 12mo
- Down + closing
- —
- Monthly P&I
- —
- Monthly cashflow
- —
- DSCR
- —
- Eligible?
- —
Short-term bridge; refi at stabilization.
Listing history 32 events
-
2026-06-18days on market $265,000 Active 34 DOM
-
2026-06-17days on market $265,000 Active 33 DOM
-
2026-06-16days on market $265,000 Active 32 DOM
-
2026-06-15days on market $265,000 Active 31 DOM
-
2026-06-14days on market $265,000 Active 29 DOM
-
2026-06-10days on market $265,000 Active 26 DOM
-
2026-06-09days on market $265,000 Active 25 DOM
-
2026-06-08days on market $265,000 Active 24 DOM
-
2026-06-07days on market $265,000 Active 23 DOM
-
2026-06-05days on market $265,000 Active 20 DOM
-
2026-06-03days on market $265,000 Active 19 DOM
-
2026-06-02days on market $265,000 Active 18 DOM
-
2026-06-01days on market $265,000 Active 17 DOM
-
2026-05-31days on market $265,000 Active 16 DOM
-
2026-05-30days on market $265,000 Active 15 DOM
-
2026-05-20price $265,000
-
2026-05-14$250,000 Active
-
2026-04-27soldstatus $252,500
-
2026-01-07historical
-
2025-11-05historical Contingent
-
2025-01-13$389,900 Active
-
2025-01-08historical
-
2022-07-21price $675
-
2021-11-15soldstatus $161,000
-
2021-11-05soldstatus $161,000 Closed 598-char remark
Show marketing remark (598 chars)
11-UNIT BRICK BUILDING WITH EIGHT 1-BEDROOM UNITS / TWO 2-BEDROOM UNITS / ONE STUDIO APARTMENT. ONE UNIT IS VACANT (Unit 3 - 643B). NO WRITTEN LEASES FOR ANY TENANTS. ELECTRIC UPDATED 8 YEARS AGO TO CIRCUIT BREAKERS (220 IN BSMT FOR DRYER). STEAM HEAT WITH 2 BOILER SYSTEMS (APPROX. 16 YEARS OLD). ROOF INSTALLED APPROXIMATELY 2001. SELLER PAYS ALL UTILITIES. ON-SITE CARETAKER TAKES CARE OF LAWN, SNOW, COLLECTING RENTS, REPAIRS (LIVES RENT FREE IN UNIT 4 - 643C). VACANT LOT TO THE WEST COULD BE PURCHASED FROM THE CITY AT A LOW PRICE FOR ADD'L PARKING. RENTAL INCOME COULD BE OVER $5,000/MONTH.
-
2021-10-12status Pending 598-char remark
Show marketing remark (598 chars)
11-UNIT BRICK BUILDING WITH EIGHT 1-BEDROOM UNITS / TWO 2-BEDROOM UNITS / ONE STUDIO APARTMENT. ONE UNIT IS VACANT (Unit 3 - 643B). NO WRITTEN LEASES FOR ANY TENANTS. ELECTRIC UPDATED 8 YEARS AGO TO CIRCUIT BREAKERS (220 IN BSMT FOR DRYER). STEAM HEAT WITH 2 BOILER SYSTEMS (APPROX. 16 YEARS OLD). ROOF INSTALLED APPROXIMATELY 2001. SELLER PAYS ALL UTILITIES. ON-SITE CARETAKER TAKES CARE OF LAWN, SNOW, COLLECTING RENTS, REPAIRS (LIVES RENT FREE IN UNIT 4 - 643C). VACANT LOT TO THE WEST COULD BE PURCHASED FROM THE CITY AT A LOW PRICE FOR ADD'L PARKING. RENTAL INCOME COULD BE OVER $5,000/MONTH.
-
2021-10-12price $161,000 598-char remark
Show marketing remark (598 chars)
11-UNIT BRICK BUILDING WITH EIGHT 1-BEDROOM UNITS / TWO 2-BEDROOM UNITS / ONE STUDIO APARTMENT. ONE UNIT IS VACANT (Unit 3 - 643B). NO WRITTEN LEASES FOR ANY TENANTS. ELECTRIC UPDATED 8 YEARS AGO TO CIRCUIT BREAKERS (220 IN BSMT FOR DRYER). STEAM HEAT WITH 2 BOILER SYSTEMS (APPROX. 16 YEARS OLD). ROOF INSTALLED APPROXIMATELY 2001. SELLER PAYS ALL UTILITIES. ON-SITE CARETAKER TAKES CARE OF LAWN, SNOW, COLLECTING RENTS, REPAIRS (LIVES RENT FREE IN UNIT 4 - 643C). VACANT LOT TO THE WEST COULD BE PURCHASED FROM THE CITY AT A LOW PRICE FOR ADD'L PARKING. RENTAL INCOME COULD BE OVER $5,000/MONTH.
-
2021-10-05$129,000 Active 598-char remark
Show marketing remark (598 chars)
11-UNIT BRICK BUILDING WITH EIGHT 1-BEDROOM UNITS / TWO 2-BEDROOM UNITS / ONE STUDIO APARTMENT. ONE UNIT IS VACANT (Unit 3 - 643B). NO WRITTEN LEASES FOR ANY TENANTS. ELECTRIC UPDATED 8 YEARS AGO TO CIRCUIT BREAKERS (220 IN BSMT FOR DRYER). STEAM HEAT WITH 2 BOILER SYSTEMS (APPROX. 16 YEARS OLD). ROOF INSTALLED APPROXIMATELY 2001. SELLER PAYS ALL UTILITIES. ON-SITE CARETAKER TAKES CARE OF LAWN, SNOW, COLLECTING RENTS, REPAIRS (LIVES RENT FREE IN UNIT 4 - 643C). VACANT LOT TO THE WEST COULD BE PURCHASED FROM THE CITY AT A LOW PRICE FOR ADD'L PARKING. RENTAL INCOME COULD BE OVER $5,000/MONTH.
-
2021-08-10status Active
-
2021-08-10historical
-
2021-07-12historical
-
2021-02-12$99,000
ⓘ Source: listings_history table (triggers on properties + properties_extension) + one-shot
backfill from property_details.listing_events for pre-trigger history.
Tax reassessment forecast OH · Partial reset (capped growth)
- Current annual tax
- $5,266 · $439/mo
- Projected year-2 tax
- $5,266 · $439/mo
- Expected delta
- $0/yr ($0/mo · 0.0%)
ⓘ Screening estimate from a state-policy table — verify with the county assessor before closing.
Climate risk First Street
- Flood 1/10 Low FEMA zone X (unshaded) · 0% chance over 30 yrs
- Wildfire 1/10 Low
- Heat 3/10 Moderate 7 d/yr ≥100°F today · 16 d/yr by 30 yrs out
- Wind 2/10 Low
- Air quality 2/10 Low 1 unhealthy d/yr today · 2 by 30 yrs out
Nearby sold comps map
Loading sold comps map…
Walkable amenities ~0.75 mi
Loading nearby amenities…
Taxation est. · year 1
- Rental income
- $121,116
- − Mortgage interest
- −$14,844
- − Property taxes
- −$5,266
- − Insurance
- −$1,325
- − Repairs & maintenance
- −$9,689
- − Management
- −$9,689
- − Depreciation
- −$7,709
- Taxable income
- $72,593
- Est. tax owed @ 24.0%
- −$17,422
- After-tax cash flow
- $54,992/yr
For passive investors: Depreciation is non-cash, so a rental often shows a tax loss while cash-flowing — sheltering income. Rental losses are passive: they offset passive income freely, and up to $25,000/yr can offset ordinary (W-2) income if you actively participate and your MAGI is under $100k (phasing out to $0 by $150k); unused losses carry forward. On sale, claimed depreciation is recaptured at up to 25%, and gains may owe capital-gains tax (a 1031 exchange can defer both). Figures are a year-1 estimate at your 24.0% rate — not tax advice; consult a CPA.
Schools (NCES district)
- District
- Toledo City
- NCES district ID
- 3904490
- Math proficiency
- 15% ▼ -16.00%
- Reading proficiency
- 24% ▼ -13.00%
- Median HH income
- $32,137
- Composite
- 15.76/100
- National rank
- #9276
- State rank
- #634 of 656 in OH
Livability — Toledo
- Score
- 66/100
- State rank
- #645
- US rank
- #11442
Category grades
Schools grade is shown separately in the Schools card above.
Census & demographics
- Census place
- Toledo, OH
- County
- Lucas County · 380,724 people
- City population
- 280,811
- Metro
- Toledo, OH
- Population (ZIP)
- 21,404
- Household income
- $42,313
- Rent vs Own
- Severe rent burden
- 1603.0
Population outlook (Lucas County) Hauer SSP2
- Today (2025)
- 420,751 people
- By 2030
- 410,187 · -2.5%
- By 2040
- 384,019 · -8.7%
- By 2050
- 355,125 · -15.6%
- By 2075
- 291,683 · -30.7%
- By 2100
- 233,670 · -44.5%
Race, ethnicity, and origin ACS 2023
- Neighborhood character
- Diverse neighborhood (Simpson 0.66)
- Race & ethnicity
- White 47% Black 29% Hispanic / Latino 17% Two or more races 9%
- Hispanic origin (detail)
- Mexican 15%
- Common ancestry
- Romanian 5% Lithuanian 2% Italian 1%
- Foreign-born
- 4% · Canada, China
- Languages at home
- 92% English-only · Spanish 5% Arabic 1% French/Haitian/Cajun 1%
Political lean MEDSL · Lucas
- 2024 margin
- D (+12.6) · D 55.8% · R 43.2%
- 2008→2024 swing
- -18.9pp toward R · 2008: 31.4pp · 2024: 12.6pp
- All cycles
- 2024: D+12.6 2020: D+16.8 2016: D+17.4 2012: D+30.4 2008: D+31.4
Not yet ingested
- Civics
- —
Market trends
- HPI YoY
- ▲ 0.75%
- Current HPI
- 235.2515
- Rent YoY
- ▲ 7.80%
- Metro
- Toledo, OH
- State GDP YoY
- ▲ 1.98%
- F500 in state
- 48
Industry mix (Fortune 500 HQ in OH)
| Industry | F500 HQs | Revenue |
|---|---|---|
| Insurance | 3 | $145B |
|
||
| Industrial Machinery | 3 | $49B |
|
||
| Financial Services | 3 | $24B |
|
||
| Consumer Goods | 2 | $93B |
|
||
| Aerospace / Defense | 2 | $47B |
|
||
| Utilities | 2 | $33B |
|
||
Price history
+167.7% since first listed17 events — show timeline
- 2026-05-20 Price Changed $265,000 NORIS
- 2026-05-14 Listed $250,000 NORIS
- 2026-04-27 Sold (Public Records) $252,500 Public Records
- 2026-01-07 Listing Removed — NORIS
- 2025-11-05 Contingent — NORIS
- 2025-01-13 Listed $389,900 NORIS
- 2025-01-08 Coming Soon — NORIS
- 2022-07-21 Price Changed $675 RENT.
- 2021-11-15 Sold (Public Records) $161,000 Public Records
- 2021-11-05 Sold (MLS) $161,000 NORIS
- 2021-10-12 Pending — NORIS
- 2021-10-12 Price Changed $161,000 NORIS
- 2021-10-05 Listed $129,000 NORIS
- 2021-08-10 Relisted — NORIS
- 2021-08-10 Listing Removed — NORIS
- 2021-07-12 Listing Removed — NORIS
- 2021-02-12 Listed $99,000 NORIS
Property tax history
+5.5%/yrLatest (2025): $5,266 · -0.4% YoY. Source: county tax records.
Cash-flow waterfall
monthlySold comps — $/sqft
last 12 mo · ≤1 miLoading sold comps…