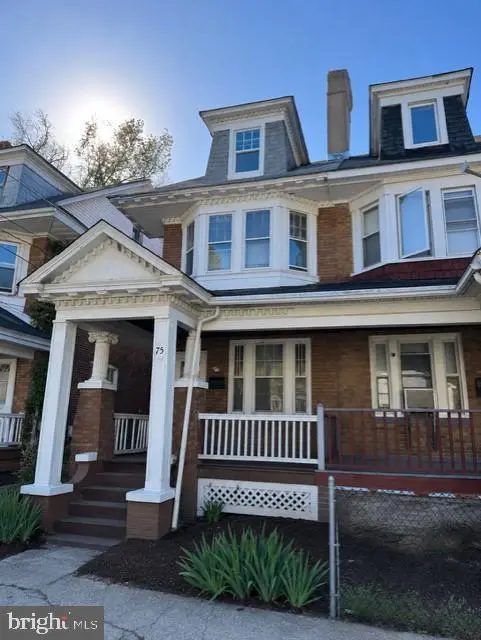
75 Bryn Mawr Ave · Trenton, NJ
Flood risk 1/10 · Minimal
- FEMA flood zone
- X (unshaded)
- Chance of flooding over 30 yrs
- 0.0%
- Est. flood insurance / yr
- $507 – $1,088
Fire risk 1/10 · Minimal
- Est. fire insurance / yr
- $526 – $976
Heat risk 6/10 · Moderate
- Hot days now (above 102°F)
- 7 days/yr
- Hot days in 30 yrs
- 15 days/yr
Wind risk 6/10 · Moderate
- Chance of severe wind over 30 yrs
- 27.0%
Air-quality risk 5/10 · Moderate
- Unhealthy air days now
- 6 days/yr
- Unhealthy air days in 30 yrs
- 8 days/yr
Risk factors via First Street. Map © Google.
Why this score? — see what drove the B- grade
The composite is a weighted blend of 9 inputs, each scored 0–100. Each bar is that input's sub-score; the figure is the points it added to the 100-point composite (weight × sub-score).
- Cash flow +30.0/30.0
- 1% rule +10.0/10.0
- DSCR +10.0/10.0
- ARV discount +7.5/15.0
- Livability +3.8/5.0
- Rent growth +3.2/5.0
- Condition / age +2.5/5.0
- Schools +0.7/10.0
- Appreciation +0.0/10.0
$131,000
🖨 Deal sheet 📄 Offer letter ✓ Due diligence
Listing remarks
Welcome to 75 Bryn Mawr Ave — a classic 1912 single-family home offering more space than meets the eye in the heart of Trenton, NJ. With 1,464 square feet of finished living space across three levels, this home features 1 bedroom, 1.5 bathrooms, plus two upper-level flex rooms — giving buyers versatility rarely found at this price point. The main level welcomes you with a spacious living area ideal for relaxing or entertaining, a functional kitchen with modern appliances and ample cabinet storage, and a convenient half bath. The second floor offers a full bedroom with natural light and closet space, and a full bathroom with tub/shower combo and vanity sink. Up a regular staircas
Key facts
- Finished attic
- Outdoor space
- Convenient location
Tags
Property features AI
Finance
- Other: Fee simple ownership; Chairlift accessibility feature
Exterior
- Utilities: Public water; Public sewer; Cable TV available; Phone service available
- Home design: Detached single-family home; Above-grade finished living space (1,464 sq ft)
- Construction: Brick construction; Brick/mortar foundation; Above-grade and below-grade structures
- Exterior features: Gutter system; Sidewalks; Street lights; Interior, level lot with rear yard
Interior
- Kitchen: Stove
- Bedrooms: Three bedrooms on the upper level
- Bathrooms: Two full bathrooms (one on main level, one on upper level)
- Heating & cooling: Radiator heating (natural gas); Window air conditioning units (electric); Natural gas hot water
- Interior features: Additional stairway; Attic; Tub with shower; Traditional floor plan; Formal separate dining room; One brick fireplace
- Laundry & utility: Laundry in basement
Neighborhood map
What this means for you Summary
Snapshot
- This is a 3-bed/2.0-bath single-family listed at $131k.
Deal economics
- At list price, monthly cash flow is $867 ($10k/yr) — positive.
- The deal already cash-flows at list — no discount required.
- Meets the 1% rule at list price ($2k rent vs $131k).
- Cap rate 14.2% vs local median 6.3% in Trenton — top-decile yield for the area; either an underpriced asset or a hidden risk that comps aren't pricing in. Stress-test before assuming the spread holds.
Location & tenants
- Location reads 76/100 on livability (#133 in NJ, #3,533 nationally) — a middle-class / working-renter tenant base. Strengths: amenities A+, commute A+, health & safety A+; Watch: schools F, crime F, employment F.
- Trenton Public School District (urban): math 2% / reading 16% proficiency, ranked #471 of 472 in NJ (top 100%) — low school quality limits family demand, transient renter base, plan for 1-2y turnover; 80% free/reduced lunch — lower-income household profile, screen leases tightly.
- Market conditions: Rents rising (+2.6%/yr); 144 active listings in the ZIP; 24 comparable units currently listed for rent nearby; rentals at typical pace (median 21d on market — plan ~3-4 weeks tenant-placement turnaround); 2,256 units permitted in Mercer County in 2024 (1,303 in 5+ unit buildings).
- At $2,367/mo this rent would consume 56% of the median local household income ($50k/yr) (locally 2116% of renters already pay >50% of income on rent) — very limited rent-growth headroom before tenants either downsize or default.
Forward outlook
- Local home prices are declining (-3.0%/yr); year-one equity from $906 of loan paydown is wiped out by about $4k of value loss. Plan a longer hold.
- Mercer County population projected at +4% by 2050 — modest demand growth; plan on rents tracking national, not racing it.
- At projected returns (-3.0% appreciation + 2.6% rent growth), your $37k cash investment doubles in ~5 years — after that, you're playing with house money.
Negotiation context
- Only 8 days on market — expect competitive offers; lowballing is unlikely to land.
- Current owner paid $36k; list at $131k implies a 264% gain — meaningful room to come down on a strong offer.
Risks & watch-outs
- Watch-outs: built in 1912 — expect roof / HVAC / electrical / plumbing capex.
- Climate carrying-cost: major wind risk, 27% chance of damaging wind over 30y; extreme-heat days projected 7→15/yr by 2055 (HVAC capex compounding) — expect insurance premiums to compound above CPI over the hold.
Questions for the listing agent
- Built in 1912 — when were the roof, HVAC, electrical panel, plumbing, and water heater last replaced?
- Is there a deadline driving the sale (1031 exchange, divorce, estate, relocation)? That informs how much negotiation room exists.
- Schools are F-rated, which usually means shorter tenancies and higher turnover. Who's the typical renter profile here, and what's been the actual vacancy rate?
- Crime grade is F in this area — have there been break-ins, vandalism, or insurance claims at this property in the last 3 years? What carrier currently insures it and at what premium?
- What's the average days-on-market for RENTAL listings here right now (not sales)? A rising rental-DOM trend means longer vacancies and softer asking-rent achievability than the comps imply.
- What's the recent tenant-quality profile in this submarket — average credit score on applications, eviction rate, late-payment / NSF rate, and stable-employment percentage? A property-management company in the area should have these aggregated.
- How much new for-sale + rental construction is in the pipeline within 1–3 miles? Heavy new supply typically softens prices + rents 12–24 months out; constrained supply supports both.
Investment metrics
- 1% rule
- 1.81% ✓
- Cap rate
- 14.23%
- Cash-on-cash
- 28.36%
- DSCR
- 2.26
- GRM
- 4.6
CMA / ARV
- ARV (on-the-fly)
- $346,968
- Comps found
- 12
Show comp detail 12 sales within ~0.75 mi
| Address | Dist | Beds/Ba | Sqft | Sold | Price | $/sf | Match |
|---|---|---|---|---|---|---|---|
| 840 Parkside Ave | 0.20mi | 3/2.5 | 1,500 (+2%) | 2mo | $400,000 | $267 | 83 |
| 111 Huff Ave | 0.25mi | 4/2.0 (+1) | 1,592 (+9%) | 1mo | $335,000 | $210 | 68 |
| 134 Oliver Ave | 0.21mi | 3/1.0 | 1,318 (-10%) | 4mo | $310,000 | $235 | 66 |
| 2 Mccarthy | 0.42mi | 3/2.0 | 1,584 (+8%) | 1mo | $375,000 | $237 | 66 |
| 803 Pennington Ave | 0.32mi | 3/1.5 | 1,248 (-15%) | 1mo | $282,500 | $226 | 58 |
| 5 Pershing Ave | 0.65mi | 2/1.5 (-1) | 1,500 (+2%) | 1mo | $385,000 | $257 | 58 |
| 257 Homecrest Ave | 0.54mi | 3/2.0 | 1,609 (+10%) | 2mo | $355,000 | $221 | 56 |
| 4 New Hillcrest Ave | 0.67mi | 4/2.0 (+1) | 1,521 (+4%) | 3mo | $385,000 | $253 | 54 |
| 525 Cleardale Ave | 0.72mi | 3/1.5 | 1,545 (+6%) | 4mo | $400,000 | $259 | 52 |
| 323 Concord Ave | 0.61mi | 4/2.0 (+1) | 1,593 (+9%) | 3mo | $258,100 | $162 | 50 |
| 42 Hazelhurst Ave | 0.71mi | 4/2.0 (+1) | 1,560 (+7%) | 3mo | $430,000 | $276 | 49 |
| 54 Kelsey Ave | 0.59mi | 4/1.0 (+1) | 1,581 (+8%) | 4mo | $166,500 | $105 | 47 |
Match score weights: distance 35% · size 25% · config 20% · recency 20%. Top-matched comps best support the ARV.
Projected returns pro-forma
-3.0% appreciation · 2.6% rent growth · sell at horizon
- IRR
- 22.2%
- Equity multiple
- 1.90×
- Total profit
- $33,134
- Equity at exit
- $19,533
- IRR
- 29.9%
- Equity multiple
- 3.63×
- Total profit
- $96,477
- Equity at exit
- $11,326
Cash invested: $36,680 (down + closing). Projections, not guarantees.
Landlord ↔ Tenant lean methodology
- Overall (STATE)
- 21 Tenant-Leaning
- State New Jersey
- 21 Tenant-Leaning · D+6
- County
- — inherits STATE
- City
- — inherits STATE
ZIP-level market 08618
- Rents YoY
- 2.6%
- Active inventory
- 144
- Price-to-rent
- 4.6×
Monthly cashflow live
- Estimated rent
- $2,367 high interval (Pro) →
- Mortgage (P&I)
- −$687
- Tax from tax record
- −$262 /mo · $3,139/yr
- Insurance
- −$55
- HOA
- −$0
- Vacancy / Maint / Mgmt
- −$497
- Net cashflow
- $867
Break-even live
UW: 25.0% down · 7.5% · 30yr · 1.5% tax · 5.0% vac · 8.0% maint · 8.0% mgmt
Financing live
Cash to close
- Down payment
- $32,750
- Closing costs
- $3,930
- Reserves months
- —
- Total cash needed
- —
Loan-product check · same deal, 3 products live
Conventional
25% down · 7.5% · 30yr
- Down + closing
- —
- Monthly P&I
- —
- Monthly cashflow
- —
- DSCR
- —
- Eligible?
- —
Personal DTI + credit; lowest rate.
DSCR
20% down · 8.5% · 30yr
- Down + closing
- —
- Monthly P&I
- —
- Monthly cashflow
- —
- DSCR
- —
- Eligible?
- —
No personal income docs; deal must DSCR.
Hard money
10% down · 12.0% · 12mo
- Down + closing
- —
- Monthly P&I
- —
- Monthly cashflow
- —
- DSCR
- —
- Eligible?
- —
Short-term bridge; refi at stabilization.
Rent comps 24 comps
| Address | Beds | Baths | Sqft | Rent | $/sqft | DOM | Units | Dist |
|---|---|---|---|---|---|---|---|---|
| 600 Artisan St Trenton, NJ | 3.0 | 2.0 | 1392 | $2,650 | $1.90 | 12d | 3 | 0.47mi |
| 600 Artisan St Unit 126 Trenton, NJ | 3.0 | 2.0 | 1392 | $2,650 | $1.90 | 20d | 1 | 0.47mi |
| 20 N Overbrook Ave Unit B Trenton, NJ | 3.0 | 1.0 | 1518 | $2,300 | $1.52 | 12d | 1 | 0.53mi |
| 319 Rutherford Ave Trenton, NJ | 4.0 | 2.0 | 1100 | $2,200 | $2.00 | 21d | 1 | 0.65mi |
| 1100 Prospect St Unit 1 Ewing Township, NJ | 3.0 | 1.0 | 1100 | $2,000 | $1.82 | 21d | 1 | 0.66mi |
| 311 Spring St Trenton, NJ | 3.0 | 1.0 | 1200 | $2,200 | $1.83 | 13d | 1 | 0.81mi |
| 307 Spring St Unit 3 Trenton, NJ | 2.0 | 1.0 | 1677 | $1,800 | $1.07 | 21d | 1 | 0.81mi |
| 307 Spring St Unit 1 Trenton, NJ | 2.0 | 1.0 | 1677 | $2,000 | $1.19 | 21d | 1 | 0.81mi |
| 307 Spring St Unit 2 Trenton, NJ | 2.0 | 1.0 | 1677 | $1,750 | $1.04 | 21d | 1 | 0.81mi |
| 186 Passaic St Trenton, NJ | 3.0 | 2.0 | 1064 | $2,400 | $2.26 | 4d | 1 | 0.86mi |
| 24 New Trent St Trenton, NJ | 3.0 | 2.0 | 1336 | $2,350 | $1.76 | 13d | 1 | 0.88mi |
| 311 Calhoun St Trenton, NJ | 4.0 | 1.0 | 1516 | $2,400 | $1.58 | 43d | 1 | 0.93mi |
| 130 W Ingham Ave Trenton, NJ | 4.0 | 1.0 | 1126 | $2,000 | $1.78 | 13d | 1 | 0.98mi |
| 92 Pennwood Dr Ewing, NJ | 4.0 | 3.0 | 1702 | $3,850 | $2.26 | 13d | 1 | 0.99mi |
| 27 Passaic St Trenton, NJ | 2.0 | 1.0 | 900 | $1,700 | $1.89 | 21d | 1 | 1.04mi |
| 8 Belvidere St Trenton, NJ | 2.0 | 1.0 | 1260 | $1,900 | $1.51 | 21d | 1 | 1.05mi |
| 21 Bellevue Ave Trenton, NJ | 3.0 | 2.0 | 1740 | $2,400 | $1.38 | 43d | 1 | 1.05mi |
| 129 Clearfield Ave Trenton, NJ | 4.0 | 1.5 | 1358 | $3,000 | $2.21 | 12d | 1 | 1.10mi |
| 34 Western Ave Ewing Township, NJ | 1.0–3.0 | 1.0–1.5 | 832 | $2,685 | $3.23 | 13d | 3 | 1.24mi |
| 134 Old Rose St Trenton, NJ | 4.0 | 2.0 | 1212 | $2,300 | $1.90 | 21d | 1 | 1.28mi |
| 77 Race St Trenton, NJ | 2.0 | 1.0 | 950 | $1,700 | $1.79 | 21d | 1 | 1.29mi |
| 125 W Farrell Ave Ewing Township, NJ | 1.0–2.0 | 1.0 | 975 | $2,460 | $2.52 | 12d | 6 | 1.39mi |
| 1314 Princeton Ave Trenton, NJ | 4.0 | 1.0 | 1092 | $2,400 | $2.20 | 13d | 1 | 1.41mi |
| 125 Olive St Trenton, NJ | 2.0–3.0 | 1.0–1.5 | 896 | $1,392 | $1.55 | 21d | 1 | 1.42mi |
Listing history 6 events
-
2026-06-10days on market $131,000 Active 8 DOM
-
2026-06-09days on market $131,000 Active 7 DOM
-
2026-06-08days on market $131,000 Active 6 DOM
-
2026-06-07days on market $131,000 Active 5 DOM
-
2026-06-03remarks 687-char remark
-
2026-06-03$131,000 Active 1 DOM
ⓘ Source: listings_history table (triggers on properties + properties_extension) + one-shot
backfill from property_details.listing_events for pre-trigger history.
Tax reassessment forecast NJ · Partial reset (capped growth)
- Current annual tax
- $3,139 · $262/mo
- Projected year-2 tax
- $3,201 · $267/mo
- Expected delta
- +$61/yr (+$5/mo · 2.0%)
ⓘ Screening estimate from a state-policy table — verify with the county assessor before closing.
Climate risk First Street
- Flood 1/10 Low FEMA zone X (unshaded) · 0% chance over 30 yrs
- Wildfire 1/10 Low
- Heat 6/10 Major 7 d/yr ≥102°F today · 15 d/yr by 30 yrs out
- Wind 6/10 Major 27% chance of damaging wind over 30 yrs
- Air quality 5/10 Major 6 unhealthy d/yr today · 8 by 30 yrs out
Nearby sold comps map
Loading sold comps map…
Walkable amenities ~0.75 mi
Loading nearby amenities…
Taxation est. · year 1
- Rental income
- $28,407
- − Mortgage interest
- −$7,338
- − Property taxes
- −$3,139
- − Insurance
- −$655
- − Repairs & maintenance
- −$2,273
- − Management
- −$2,273
- − Depreciation
- −$3,811
- Taxable income
- $8,918
- Est. tax owed @ 24.0%
- −$2,140
- After-tax cash flow
- $8,263/yr
For passive investors: Depreciation is non-cash, so a rental often shows a tax loss while cash-flowing — sheltering income. Rental losses are passive: they offset passive income freely, and up to $25,000/yr can offset ordinary (W-2) income if you actively participate and your MAGI is under $100k (phasing out to $0 by $150k); unused losses carry forward. On sale, claimed depreciation is recaptured at up to 25%, and gains may owe capital-gains tax (a 1031 exchange can defer both). Figures are a year-1 estimate at your 24.0% rate — not tax advice; consult a CPA.
Schools (NCES district)
- District
- Trenton Public School District
- NCES district ID
- 3416290
- Math proficiency
- 2% ▼ -8.00%
- Reading proficiency
- 16% ▼ -4.00%
- Median HH income
- $35,078
- Composite
- 7.31/100
- National rank
- #9956
- State rank
- #471 of 472 in NJ
Livability — Trenton
- Score
- 76/100
- State rank
- #133
- US rank
- #3533
Category grades
Schools grade is shown separately in the Schools card above.
Census & demographics
- Census place
- Trenton, NJ
- County
- Mercer County · 327,655 people
- City population
- 177,819
- Metro
- Trenton-Princeton, NJ
- Population (ZIP)
- 35,634
- Household income
- $50,390
- Rent vs Own
- Severe rent burden
- 2116.0
Population outlook (Mercer County) Hauer SSP2
- Today (2025)
- 381,395 people
- By 2030
- 384,640 · +0.9%
- By 2040
- 391,431 · +2.6%
- By 2050
- 397,845 · +4.3%
- By 2075
- 417,281 · +9.4%
- By 2100
- 420,327 · +10.2%
Race, ethnicity, and origin ACS 2023
- Neighborhood character
- Diverse neighborhood (Simpson 0.59)
- Race & ethnicity
- Black 59% White 19% Hispanic / Latino 16% Two or more races 7% Asian 3%
- Hispanic origin (detail)
- Mexican 1% Puerto Rican 6% Dominican 3%
- Common ancestry
- Romanian 2% Hispanic 1% Scotch-Irish 1%
- Foreign-born
- 14% · Canada, China, South Korea
- Languages at home
- 80% English-only · Spanish 10% Other Indo-European 3% Arabic 1%
Political lean MEDSL · Mercer
- 2024 margin
- Solid D (+33.9) · D 65.9% · R 32.0% · Other 2.1%
- 2008→2024 swing
- -2.2pp toward R · 2008: 36.1pp · 2024: 33.9pp
- All cycles
- 2024: D+33.9 2020: D+40.0 2016: D+36.2 2012: D+36.8 2008: D+36.1
Not yet ingested
- Civics
- —
Market trends
- HPI YoY
- ▼ -309.54%
- Current HPI
- 288.6841
- Rent YoY
- ▲ 2.60%
- Metro
- Trenton-Princeton, NJ
- State GDP YoY
- ▲ 2.05%
- F500 in state
- 34
Industry mix (Fortune 500 HQ in NJ)
| Industry | F500 HQs | Revenue |
|---|---|---|
| Consumer Goods | 3 | $31B |
|
||
| Pharmaceuticals | 2 | $153B |
|
||
| Technology | 2 | $21B |
|
||
| Insurance | 2 | $20B |
|
||
| Healthcare | 2 | $19B |
|
||
| Financial Services | 1 | $70B |
|
||
Price history
-22.9% since first listed3 events — show timeline
- 2026-06-02 Listed $131,000 BRIGHT MLS
- 1988-08-02 Sold (Public Records) $36,000 Public Records
- 1986-12-31 Sold (Public Records) $170,000 Public Records
Property tax history
+3.5%/yrLatest (2025): $3,139 · +1.5% YoY. Source: county tax records.
Cash-flow waterfall
monthlySold comps — $/sqft
last 12 mo · ≤1 miLoading sold comps…