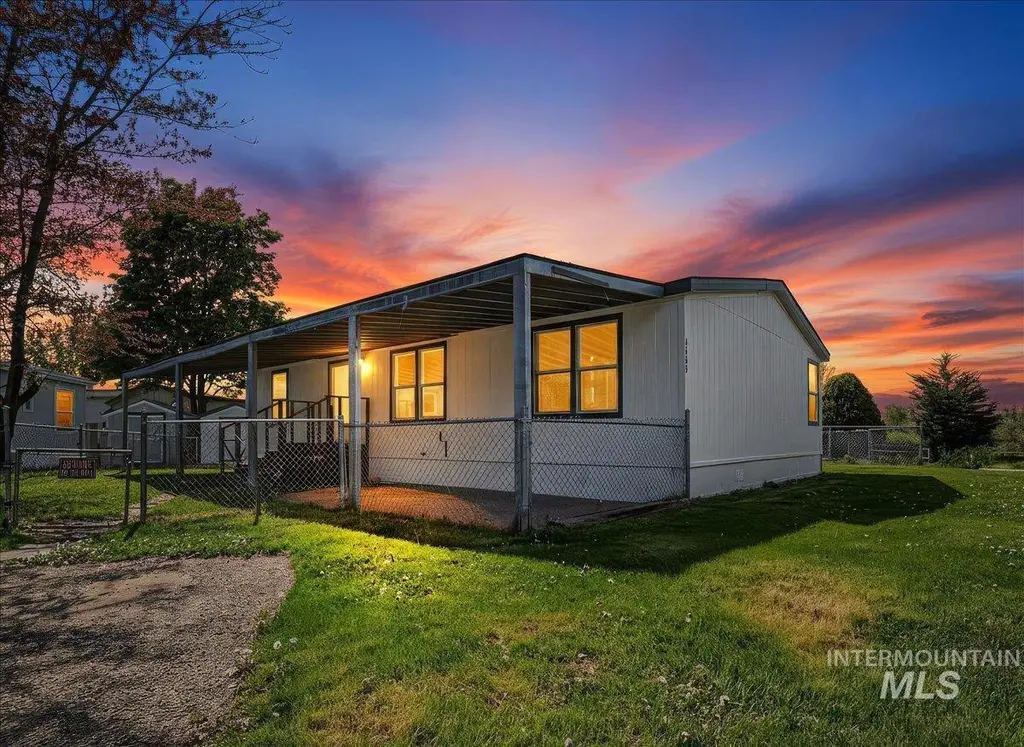
4403 High Valley Ave · Nampa, ID
Flood risk No data
- FEMA flood zone
- —
- Chance of flooding over 30 yrs
- —
- Est. flood insurance / yr
- —
Fire risk No data
- Est. fire insurance / yr
- —
Heat risk No data
- Hot days now (above threshold)
- —
- Hot days in 30 yrs
- —
Wind risk No data
- Chance of severe wind over 30 yrs
- —
Air-quality risk No data
- Unhealthy air days now
- —
- Unhealthy air days in 30 yrs
- —
Risk factors via First Street. Map © Google.
Why this score? — see what drove the B+ grade
The composite is a weighted blend of 9 inputs, each scored 0–100. Each bar is that input's sub-score; the figure is the points it added to the 100-point composite (weight × sub-score).
- Cash flow +30.0/30.0
- ARV discount +15.0/15.0
- 1% rule +10.0/10.0
- DSCR +10.0/10.0
- Livability +3.6/5.0
- Rent growth +3.4/5.0
- Schools +2.7/10.0
- Condition / age +2.5/5.0
- Appreciation +0.0/10.0
$79,900
🖨 Deal sheet 📄 Offer letter ✓ Due diligence
Listing remarks MLS
Very well kept MH in a quiet park. Split floor plan. 3 bedroom, 2 bath comfortable living rooms w/ hardwood floors. Separate eating area, plenty of kitchen cabinets. Master bedroom w/ renovated master bath w/ 2 sinks, tile tub, separate shower. Close to Hwy & shopping.
Key facts
- Functional kitchen
- Larger lot
- Outdoor space
Tags
Property features AI
Finance
- Other: Property is on a rented lot within Happy Valley subdivision
- Financial info: Financial details not provided
- HOA & community: Association fee: monthly
Exterior
- Parking: Parking details not provided
- Security: Security details not provided
- Utilities: City water service; Sewer connected
- Home design: Manufactured/mobile home (rented lot)
- Construction: Built in 1999; Composition roof
- Exterior features: Full wire fencing; Auto sprinkler system with pressurized irrigation; Paved road access; Located in a mobile home park
Interior
- Kitchen: Kitchen on main level (approx. 12 x 10); Dishwasher; Microwave; Freestanding oven/range; Refrigerator; Laminate counters
- Bedrooms: 3 bedrooms, all on the main level (Master: approx. 12 x 11; Bedroom 2: approx. 10 x 10; Bedroom 3: approx. 11 x 10)
- Flooring: Hardwood; Carpet
- Bathrooms: 2 bathrooms; Master bath with double vanity
- Heating & cooling: Electric heating; Central air conditioning
- Interior features: Primary bedroom on main level with private bath; Double vanity in bath; Walk-in closet(s); Laminate countertops; Fireplace
- Laundry & utility: Washer and dryer included; Utility room on main level (approx. 8 x 4)
Neighborhood map
What this means for you Summary
Snapshot
- This is a 3-bed/2.0-bath manufactured listed at $80k.
Deal economics
- At list price, monthly cash flow is $1k ($12k/yr) — positive.
- The deal already cash-flows at list — no discount required.
- Meets the 1% rule at list price ($2k rent vs $80k).
- Recommended offer: $78k (3.0% below list) — sets the bar for market timing.
- Cap rate 21.5% vs local median 3.2% in Nampa — top-decile yield for the area; either an underpriced asset or a hidden risk that comps aren't pricing in. Stress-test before assuming the spread holds.
Location & tenants
- Location reads 72/100 on livability (#47 in ID) — a middle-class / working-renter tenant base. Strengths: housing A+, health & safety A+, cost of living A-; Watch: employment C-, amenities F, commute F.
- Nampa School District (suburban): math 23% / reading 41% proficiency, ranked #82 of 92 in ID (top 89%) — families likely to look elsewhere, expect single-tenant / working-renter base with shorter leases.
- Zoned schools: Columbia High School (math 16% / reading 52%, grade F, #115 of 169 statewide, top 68%, 1,239 students, 39% FRL).
- Market conditions: Rents rising (+3.4%/yr); 631 active listings in the ZIP; 5 comparable units currently listed for rent nearby; rentals at typical pace (median 14d on market — plan ~3-4 weeks tenant-placement turnaround); solid renter incomes; 3,620 units permitted in Canyon County in 2024 (196 in 5+ unit buildings).
Forward outlook
- Local home prices are declining (-3.0%/yr); year-one equity from $552 of loan paydown is wiped out by about $2k of value loss. Plan a longer hold.
- Canyon County population projected at +41% by 2050 — long-run rental-demand tailwind backs the buy-and-hold thesis.
- At projected returns (-3.0% appreciation + 3.4% rent growth), your $22k cash investment doubles in ~3 years — after that, you're playing with house money.
Negotiation context
- It's been on market 35 days — a 3% lower offer ($78k) is reasonable based on typical stale-listing flexibility.
- 3 sale attempts since 5y ago with the ask held roughly flat each time — persistent listings suggest the price (not the market) is what's stuck; bring a comps-based counter.
Questions for the listing agent
- It's been on market 35 days. Have you received any prior offers? Is the seller open to a 3% concession, seller financing, or rate buy-down credit?
- Is there a deadline driving the sale (1031 exchange, divorce, estate, relocation)? That informs how much negotiation room exists.
- Schools are D-rated, which usually means shorter tenancies and higher turnover. Who's the typical renter profile here, and what's been the actual vacancy rate?
- What's the average days-on-market for RENTAL listings here right now (not sales)? A rising rental-DOM trend means longer vacancies and softer asking-rent achievability than the comps imply.
- What's the recent tenant-quality profile in this submarket — average credit score on applications, eviction rate, late-payment / NSF rate, and stable-employment percentage? A property-management company in the area should have these aggregated.
- How much new for-sale + rental construction is in the pipeline within 1–3 miles? Heavy new supply typically softens prices + rents 12–24 months out; constrained supply supports both.
Investment metrics
- 1% rule
- 2.37% ✓
- Cap rate
- 21.55%
- Cash-on-cash
- 54.47%
- DSCR
- 3.42
- GRM
- 3.5
CMA / ARV
- ARV (on-the-fly)
- $123,606
- Comps found
- 5
Show comp detail 5 sales within ~0.75 mi
| Address | Dist | Beds/Ba | Sqft | Sold | Price | $/sf | Match |
|---|---|---|---|---|---|---|---|
| 812 Garden Valley St | 0.28mi | 3/2.0 | 1,152 (+2%) | 3mo | $64,500 | $56 | 82 |
| 814 Long Valley St | 0.27mi | 3/2.0 | 1,188 (+5%) | 6mo | $149,900 | $126 | 75 |
| 823 Round Vly | 0.29mi | 3/2.0 | 1,152 (+2%) | 18mo | $125,000 | $109 | 68 |
| 817 Little Valley St | 0.24mi | 3/2.0 | 1,215 (+7%) | 17mo | $125,000 | $103 | 63 |
| 905 Long Vly | 0.31mi | 3/1.0 | 972 (-14%) | 11mo | $115,000 | $118 | 48 |
Match score weights: distance 35% · size 25% · config 20% · recency 20%. Top-matched comps best support the ARV.
Projected returns pro-forma
-3.0% appreciation · 3.44% rent growth · sell at horizon
- IRR
- 53.1%
- Equity multiple
- 3.35×
- Total profit
- $52,559
- Equity at exit
- $11,913
- IRR
- 58.5%
- Equity multiple
- 6.92×
- Total profit
- $132,477
- Equity at exit
- $6,908
Cash invested: $22,372 (down + closing). Projections, not guarantees.
Landlord ↔ Tenant lean methodology
- Overall (STATE)
- 91 Strongly Landlord-Friendly
- State Idaho
- 91 Strongly Landlord-Friendly · R+18
- County
- — inherits STATE
- City
- — inherits STATE
ZIP-level market 83687
- Home prices YoY
- -21.0%
- Rents YoY
- 3.4%
- Active inventory
- 631
- Price-to-rent
- 3.5×
Monthly cashflow live
- Estimated rent
- $1,894 high interval (Pro) →
- Mortgage (P&I)
- −$419
- Tax from tax record
- −$28 /mo · $340/yr
- Insurance
- −$33
- HOA
- −$0
- Vacancy / Maint / Mgmt
- −$398
- Net cashflow
- $1,016
Break-even live
UW: 25.0% down · 7.5% · 30yr · 1.5% tax · 5.0% vac · 8.0% maint · 8.0% mgmt
Financing live
Cash to close
- Down payment
- $19,975
- Closing costs
- $2,397
- Reserves months
- —
- Total cash needed
- —
Loan-product check · same deal, 3 products live
Conventional
25% down · 7.5% · 30yr
- Down + closing
- —
- Monthly P&I
- —
- Monthly cashflow
- —
- DSCR
- —
- Eligible?
- —
Personal DTI + credit; lowest rate.
DSCR
20% down · 8.5% · 30yr
- Down + closing
- —
- Monthly P&I
- —
- Monthly cashflow
- —
- DSCR
- —
- Eligible?
- —
No personal income docs; deal must DSCR.
Hard money
10% down · 12.0% · 12mo
- Down + closing
- —
- Monthly P&I
- —
- Monthly cashflow
- —
- DSCR
- —
- Eligible?
- —
Short-term bridge; refi at stabilization.
Rent comps 5 comps
| Address | Beds | Baths | Sqft | Rent | $/sqft | DOM | Units | Dist |
|---|---|---|---|---|---|---|---|---|
| 610 N Margot Ln , ID | 2.0 | 2.0 | 920 | $1,550 | $1.68 | 3d | 3 | 0.27mi |
| 4595 Stamm Ln Nampa, ID | 1.0–3.0 | 1.0–2.0 | 933 | $1,927 | $2.07 | 14d | 24 | 0.39mi |
| 4711 Stamm Ln Nampa, ID | 3.0 | 2.5 | 1260 | $1,950 | $1.55 | 3d | 1 | 0.46mi |
| 146 N Grant St Nampa, ID | 3.0 | 2.0 | 1100 | $1,900 | $1.73 | 21d | 1 | 1.07mi |
| 2807 Mink Pl Nampa, ID | 3.0 | 2.0 | 1246 | $1,925 | $1.54 | 21d | 1 | 1.48mi |
Listing history 15 events
-
2026-06-16statusdays on market $79,900 Pending 35 DOM
-
2026-06-15days on market $79,900 Active 34 DOM
-
2026-06-13days on market $79,900 Active 32 DOM
-
2026-06-10days on market $79,900 Active 29 DOM
-
2026-06-09days on market $79,900 Active 28 DOM
-
2026-06-08days on market $79,900 Active 27 DOM
-
2026-06-07days on market $79,900 Active 26 DOM
-
2026-06-03statusdays on market $79,900 Active 22 DOM
-
2026-05-22status Pending
-
2026-05-01$79,900 Active
-
2021-12-07soldstatus Sold 275-char remark
Show marketing remark (275 chars)
Very well kept MH in a quiet park. Split floor plan. 3 bedroom, 2 bath comfortable living rooms w/ hardwood floors. Separate eating area, plenty of kitchen cabinets. Master bedroom w/ renovated master bath w/ 2 sinks, tile tub, separate shower. Close to Hwy & shopping.
-
2021-10-28status Pending 275-char remark
Show marketing remark (275 chars)
Very well kept MH in a quiet park. Split floor plan. 3 bedroom, 2 bath comfortable living rooms w/ hardwood floors. Separate eating area, plenty of kitchen cabinets. Master bedroom w/ renovated master bath w/ 2 sinks, tile tub, separate shower. Close to Hwy & shopping.
-
2021-10-25status Active 275-char remark
Show marketing remark (275 chars)
Very well kept MH in a quiet park. Split floor plan. 3 bedroom, 2 bath comfortable living rooms w/ hardwood floors. Separate eating area, plenty of kitchen cabinets. Master bedroom w/ renovated master bath w/ 2 sinks, tile tub, separate shower. Close to Hwy & shopping.
-
2021-10-04status Pending 275-char remark
Show marketing remark (275 chars)
Very well kept MH in a quiet park. Split floor plan. 3 bedroom, 2 bath comfortable living rooms w/ hardwood floors. Separate eating area, plenty of kitchen cabinets. Master bedroom w/ renovated master bath w/ 2 sinks, tile tub, separate shower. Close to Hwy & shopping.
-
2021-09-17$129,900 Active 275-char remark
Show marketing remark (275 chars)
Very well kept MH in a quiet park. Split floor plan. 3 bedroom, 2 bath comfortable living rooms w/ hardwood floors. Separate eating area, plenty of kitchen cabinets. Master bedroom w/ renovated master bath w/ 2 sinks, tile tub, separate shower. Close to Hwy & shopping.
ⓘ Source: listings_history table (triggers on properties + properties_extension) + one-shot
backfill from property_details.listing_events for pre-trigger history.
Tax reassessment forecast ID · Resets to sale price
- Current annual tax
- $340 · $28/mo
- Projected year-2 tax
- $551 · $46/mo
- Expected delta
- +$212/yr (+$18/mo · 62.3%)
ⓘ Screening estimate from a state-policy table — verify with the county assessor before closing.
Nearby sold comps map
Loading sold comps map…
Walkable amenities ~0.75 mi
Loading nearby amenities…
Taxation est. · year 1
- Rental income
- $22,726
- − Mortgage interest
- −$4,476
- − Property taxes
- −$340
- − Insurance
- −$400
- − Repairs & maintenance
- −$1,818
- − Management
- −$1,818
- − Depreciation
- −$2,324
- Taxable income
- $11,551
- Est. tax owed @ 24.0%
- −$2,772
- After-tax cash flow
- $9,414/yr
For passive investors: Depreciation is non-cash, so a rental often shows a tax loss while cash-flowing — sheltering income. Rental losses are passive: they offset passive income freely, and up to $25,000/yr can offset ordinary (W-2) income if you actively participate and your MAGI is under $100k (phasing out to $0 by $150k); unused losses carry forward. On sale, claimed depreciation is recaptured at up to 25%, and gains may owe capital-gains tax (a 1031 exchange can defer both). Figures are a year-1 estimate at your 24.0% rate — not tax advice; consult a CPA.
Schools (NCES district)
- District
- Nampa School District
- NCES district ID
- 1602340
- Math proficiency
- 23% ▼ -13.00%
- Reading proficiency
- 41% ▼ -9.00%
- Median HH income
- $43,576
- Composite
- 27.18/100
- National rank
- #7022
- State rank
- #82 of 92 in ID
Livability — Nampa
- Score
- 72/100
- State rank
- #47
- US rank
- #6250
Category grades
Schools grade is shown separately in the Schools card above.
Census & demographics
- Census place
- Nampa, ID
- County
- Canyon County · 235,358 people
- City population
- 142,249
- Metro
- Boise City, ID
- Population (ZIP)
- 43,135
- Household income
- $76,682
- Rent vs Own
- Severe rent burden
- 683.0
Population outlook (Canyon County) Hauer SSP2
- Today (2025)
- 248,853 people
- By 2030
- 269,596 · +8.3%
- By 2040
- 311,081 · +25.0%
- By 2050
- 350,809 · +41.0%
- By 2075
- 441,884 · +77.6%
- By 2100
- 505,641 · +103.2%
Race, ethnicity, and origin ACS 2023
- Neighborhood character
- Predominantly White (71%)
- Race & ethnicity
- White 71% Hispanic / Latino 21% Two or more races 11% Black 2% Native American 1%
- Hispanic origin (detail)
- Mexican 18%
- Common ancestry
- Italian 4% Slovak 3% Lithuanian 2%
- Foreign-born
- 7% · Canada
- Languages at home
- 85% English-only · Spanish 12% Russian/Polish/Slavic 1%
Political lean MEDSL · Canyon
- 2024 margin
- Solid R (+46.6) · D 25.4% · R 72.0% · Other 2.5%
- 2008→2024 swing
- -11.4pp toward R · 2008: -35.2pp · 2024: -46.6pp
- All cycles
- 2024: R+46.6 2020: R+39.7 2016: R+41.8 2012: R+37.1 2008: R+35.2
Not yet ingested
- Civics
- —
Market trends
- HPI YoY
- ▼ -103.50%
- Current HPI
- 388.8148
- Rent YoY
- ▲ 3.44%
- Metro
- Boise City, ID
- State GDP YoY
- ▲ 4.51%
- F500 in state
- 6
Industry mix (Fortune 500 HQ in ID)
| Industry | F500 HQs | Revenue |
|---|---|---|
| Retail | 1 | $79B |
|
||
| Technology | 1 | $25B |
|
||
| Food / Agriculture | 1 | $6B |
|
||
Price history
-38.5% since first listed7 events — show timeline
- 2026-05-22 Pending — IMLS
- 2026-05-01 Listed $79,900 IMLS
- 2021-12-07 Sold (MLS) — IMLS
- 2021-10-28 Pending — IMLS
- 2021-10-25 Relisted — IMLS
- 2021-10-04 Pending — IMLS
- 2021-09-17 Listed $129,900 IMLS
Property tax history
-4.4%/yrLatest (2025): $340 · -11.9% YoY. Source: county tax records.
Cash-flow waterfall
monthlySold comps — $/sqft
last 12 mo · ≤1 miLoading sold comps…