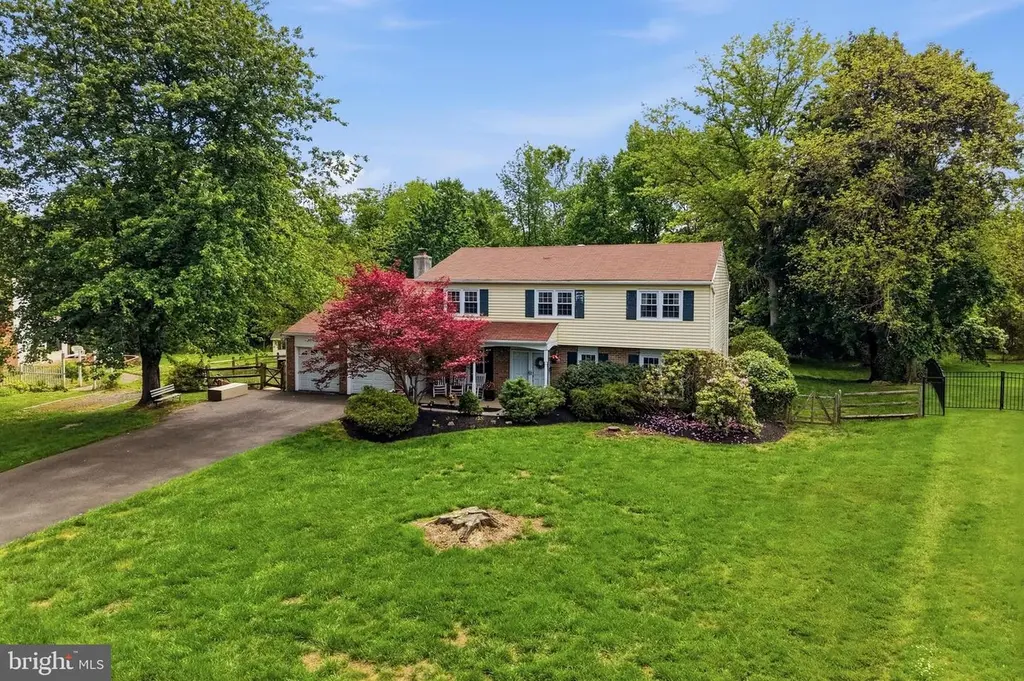
18 W Elizabeth Ln · Richboro, PA
Flood risk 1/10 · Minimal
- FEMA flood zone
- X (unshaded)
- Chance of flooding over 30 yrs
- 0.0%
- Est. flood insurance / yr
- $507 – $1,088
Fire risk 1/10 · Minimal
- Est. fire insurance / yr
- $511 – $949
Heat risk 5/10 · Moderate
- Hot days now (above 101°F)
- 7 days/yr
- Hot days in 30 yrs
- 15 days/yr
Wind risk 6/10 · Moderate
- Chance of severe wind over 30 yrs
- 27.0%
Air-quality risk 5/10 · Moderate
- Unhealthy air days now
- 6 days/yr
- Unhealthy air days in 30 yrs
- 8 days/yr
Risk factors via First Street. Map © Google.
Why this score? — see what drove the D grade
The composite is a weighted blend of 9 inputs, each scored 0–100. Each bar is that input's sub-score; the figure is the points it added to the 100-point composite (weight × sub-score).
- ARV discount +12.0/15.0
- Cash flow +11.7/30.0
- Schools +5.8/10.0
- Livability +3.8/5.0
- DSCR +3.4/10.0
- 1% rule +3.1/10.0
- Rent growth +2.5/5.0
- Condition / age +2.5/5.0
- Appreciation +0.0/10.0
$625,000
🖨 Deal sheet (PDF) 📄 Offer letter ✓ Due diligence
Listing remarks MLS
Very Large Toll Brothers Built Andover Model Situated On Private One Acre Lot, Brand New High Efficiency Heat Pump, Master Bedroom Suite With Sitting Room, Large Walk In Attic, New Stove, Disposal, Dishwasher, Large Kitchen With Breakfast Room Full Wall Brick Fp, Beautiful Sample Cond. This Won't Last!
Key facts
- 0.44 acre lot
- 2 garage spots
- Built 1976
Property features AI
Exterior
- Parking: Attached 2-car garage with opener, inside access and additional storage area; Driveway with about 6 spaces; On-street parking; Total of approximately 8 garage/parking spaces
- Utilities: Public water; Public sewer; 200+ amp electric service with circuit breakers; Electric hot water
- Home design: Detached single-family home; Level entry to main floor; Multiple access exits; Estimated lot dimensions 78' x 245'
- Construction: Frame construction; Slab foundation; Energy-efficient windows; Built (year source: Assessor)
- Exterior features: Exterior lighting including flood lights; Backs to trees; Cleared and landscaped grounds; Level, private rear yard
Interior
- Kitchen: Built-in microwave; Dishwasher; Electric oven/range; Refrigerator; Pantry; Eat-in layout
- Bedrooms: Four bedrooms on the first upper level
- Flooring: Carpet
- Bathrooms: Two full bathrooms on the upper level; Two full bathrooms total; One half bathroom on the main level; One half bathroom total
- Heating & cooling: Heat pump with electric backup; Electric heating fuel; Central air conditioning
- Interior features: Open and traditional floor plan elements; Formal separate dining room; Dining area; Eat-in kitchen; Pantry; Chair railings; Ceiling fans; Walk-in closets; Master bathroom; Stall shower and tub/shower; Attic with house fan; Attic access; Carpeted areas
- Laundry & utility: Washer and dryer; Main-floor laundry
Neighborhood map
What this means for you Summary
Snapshot
- This is a 4-bed/2.5-bath single-family listed at $625k.
Deal economics
- At list price, monthly cash flow is $-186 ($-2k/yr) — negative.
- To cash-flow at today's rent, offer at most $592k (5.2% below list).
- To meet the 1% rule (rent ≥ 1% of price), the offer needs to be $508k (18.7% below list).
- Recommended offer: $508k (18.7% below list) — sets the bar for 1% rule.
- Cap rate 5.9% vs local median 2.7% in Richboro — top-decile yield for the area; either an underpriced asset or a hidden risk that comps aren't pricing in. Stress-test before assuming the spread holds.
Location & tenants
- Location reads 75/100 on livability (#459 in PA, #4,183 nationally) — a middle-class / working-renter tenant base. Strengths: schools A+, crime A+, employment A+; Watch: amenities F, commute F, cost of living F.
- Council Rock SD (suburban): math 56% / reading 68% proficiency, ranked #36 of 539 in PA (top 7%) — acceptable for families but not a draw, mixed tenant base, ~2y average lease; only 5% free/reduced lunch — higher-income household profile.
- Market conditions: 33 active listings in the ZIP; 2 comparable units currently listed for rent nearby; 663 units permitted in Bucks County in 2024 (106 in 5+ unit buildings).
Forward outlook
- Local home prices are declining (-3.0%/yr); year-one equity from $4k of loan paydown is wiped out by about $19k of value loss. Plan a longer hold.
- Bucks County population projected to shrink 7% by 2050 — rents likely to lag national; underwrite the cash flow, not the appreciation.
Negotiation context
- Only 2 days on market — expect competitive offers; lowballing is unlikely to land.
- Current owner paid $210k; list at $625k implies a 198% gain — meaningful room to come down on a strong offer.
Risks & watch-outs
- Climate carrying-cost: major wind risk, 27% chance of damaging wind over 30y; extreme-heat days projected 7→15/yr by 2055 (HVAC capex compounding) — expect insurance premiums to compound above CPI over the hold.
Questions for the listing agent
- What do current leases actually rent for vs. the listed asking? Can we see a recent rent roll and the last 12 months of T-12 income?
- Built in 1976 — when were the roof, HVAC, electrical panel, plumbing, and water heater last replaced?
- Is there a deadline driving the sale (1031 exchange, divorce, estate, relocation)? That informs how much negotiation room exists.
- Schools are A-rated — typically a magnet for longer-tenancy family renters. What's the average tenant stay here, and is there a school-zone premium baked into asking?
- The area grade is low — what's the realistic commute time and amenity access for the typical tenant pool here? Any planned neighborhood developments (good or bad) we should know about?
- What's the average days-on-market for RENTAL listings here right now (not sales)? A rising rental-DOM trend means longer vacancies and softer asking-rent achievability than the comps imply.
- What's the recent tenant-quality profile in this submarket — average credit score on applications, eviction rate, late-payment / NSF rate, and stable-employment percentage? A property-management company in the area should have these aggregated.
- How much new for-sale + rental construction is in the pipeline within 1–3 miles? Heavy new supply typically softens prices + rents 12–24 months out; constrained supply supports both.
Investment metrics
- 1% rule
- 0.81% ✗
- Cap rate
- 5.94%
- Cash-on-cash
- -1.27%
- DSCR
- 0.94
- GRM
- 10.2
CMA / ARV
- ARV (on-the-fly)
- $694,436
- Comps found
- 12
Show comp detail 12 sales within ~0.75 mi
| Address | Dist | Beds/Ba | Sqft | Sold | Price | $/sf | Match |
|---|---|---|---|---|---|---|---|
| 10 W Elizabeth Ln | 0.02mi | 4/2.5 | 2,624 (-4%) | 2mo | $650,000 | $248 | 90 |
| 16 Rucker Rd | 0.26mi | 4/2.5 | 2,750 (+1%) | 1mo | $885,000 | $322 | 86 |
| 31 E Julianna Dr | 0.27mi | 4/2.5 | 2,693 (-2%) | 2mo | $800,000 | $297 | 84 |
| 7 Candace Ct | 0.13mi | 4/3.0 | 3,094 (+13%) | 2mo | $925,000 | $299 | 69 |
| 165 W Julianna Dr | 0.51mi | 4/2.5 | 2,524 (-8%) | 1mo | $700,000 | $277 | 63 |
| 9 Renee Cir | 0.55mi | 4/2.5 | 3,050 (+12%) | 0mo | $735,000 | $241 | 55 |
| 62 W Pickering Bnd | 0.73mi | 4/2.5 | 2,590 (-5%) | 3mo | $659,000 | $254 | 55 |
| 79 W Buttonwood Dr | 0.72mi | 4/2.5 | 2,975 (+9%) | 2mo | $665,000 | $224 | 50 |
| 60 Joshua | 0.66mi | 4/3.0 | 2,474 (-10%) | 2mo | $585,000 | $236 | 50 |
| 44 Hickory Dr | 0.73mi | 4/2.5 | 3,000 (+10%) | 0mo | $615,000 | $205 | 49 |
| 111 W Buttonwood Dr | 0.67mi | 3/2.5 (-1) | 2,500 (-9%) | 2mo | $650,000 | $260 | 48 |
| 50 Mohawk Dr | 0.72mi | 4/3.5 | 3,000 (+10%) | 7mo | $755,000 | $252 | 40 |
Match score weights: distance 35% · size 25% · config 20% · recency 20%. Top-matched comps best support the ARV.
Projected returns pro-forma
-3.0% appreciation · 3.0% rent growth · sell at horizon
- IRR
- -18.4%
- Equity multiple
- 0.35×
- Total profit
- $-113,099
- Equity at exit
- $93,190
- IRR
- -10.7%
- Equity multiple
- 0.35×
- Total profit
- $-113,695
- Equity at exit
- $54,039
Cash invested: $175,000 (down + closing). Projections, not guarantees.
Landlord ↔ Tenant lean methodology
- Overall (STATE)
- 62 Landlord-Friendly
- State Pennsylvania
- 62 Landlord-Friendly · EVEN
- County
- — inherits STATE
- City
- — inherits STATE
ZIP-level market 18954
- Active inventory
- 33
- Price-to-rent
- 10.2×
Monthly cashflow live
- Estimated rent
- $5,084 medium interval (Pro) →
- Mortgage (P&I)
- −$3,278
- Tax from tax record
- −$664 /mo · $7,972/yr
- Insurance
- −$260
- HOA
- −$0
- Vacancy / Maint / Mgmt
- −$1,068
- Net cashflow
- $-186
Break-even live
Sensitivity live
| Price | -10% $168 | -5% $-9 | +0% $-186 | +5% $-363 | +10% $-539 |
|---|---|---|---|---|---|
| Rent | -10% $-587 | -5% $-387 | +0% $-186 | +5% $15 | +10% $216 |
| Rate | -1.0pp $129 | -0.5pp $-27 | base $-186 | +0.5pp $-348 | +1.0pp $-512 |
UW: 25.0% down · 7.5% · 30yr · 1.5% tax · 5.0% vac · 8.0% maint · 8.0% mgmt
Financing live
Cash to close
- Down payment
- $156,250
- Closing costs
- $18,750
- Reserves months
- —
- Total cash needed
- —
Loan-product check · same deal, 3 products live
Conventional
25% down · 7.5% · 30yr
- Down + closing
- —
- Monthly P&I
- —
- Monthly cashflow
- —
- DSCR
- —
- Eligible?
- —
Personal DTI + credit; lowest rate.
DSCR
20% down · 8.5% · 30yr
- Down + closing
- —
- Monthly P&I
- —
- Monthly cashflow
- —
- DSCR
- —
- Eligible?
- —
No personal income docs; deal must DSCR.
Hard money
10% down · 12.0% · 12mo
- Down + closing
- —
- Monthly P&I
- —
- Monthly cashflow
- —
- DSCR
- —
- Eligible?
- —
Short-term bridge; refi at stabilization.
Rent comps 2 comps
| Address | Beds | Baths | Sqft | Rent | $/sqft | DOM | Units | Dist |
|---|---|---|---|---|---|---|---|---|
| 56 W Windrose Dr Richboro, PA | 4.0 | 2.5 | 3241 | $6,000 | $1.85 | 1d | 1 | 0.42mi |
| 2 Merry Dell Dr Southampton, PA | 4.0 | 2.5 | 2708 | $4,000 | $1.48 | 1d | 1 | 0.58mi |
Listing history 12 events
-
2026-06-07statusdays on market $625,000 Pending 2 DOM
-
2026-06-04statusdays on market $625,000 Active 1 DOM
-
2026-06-03days on market $625,000 Coming Soon 6 DOM
-
2026-06-02days on market $625,000 Coming Soon 5 DOM
-
2026-06-01days on market $625,000 Coming Soon 4 DOM
-
2026-05-31days on market $625,000 Coming Soon 3 DOM
-
2026-05-28historical $625,000
-
1995-08-29soldstatus $210,000
-
1995-08-24soldstatus $210,000 303-char remark
Show marketing remark (303 chars)
Very Large Toll Brothers Built Andover Model Situated On Private One Acre Lot, Brand New High Efficiency Heat Pump, Master Bedroom Suite With Sitting Room, Large Walk In Attic, New Stove, Disposal, Dishwasher, Large Kitchen With Breakfast Room Full Wall Brick Fp, Beautiful Sample Cond. This Won't Last!
-
1995-07-20historical 303-char remark
Show marketing remark (303 chars)
Very Large Toll Brothers Built Andover Model Situated On Private One Acre Lot, Brand New High Efficiency Heat Pump, Master Bedroom Suite With Sitting Room, Large Walk In Attic, New Stove, Disposal, Dishwasher, Large Kitchen With Breakfast Room Full Wall Brick Fp, Beautiful Sample Cond. This Won't Last!
-
1995-07-09$210,000 303-char remark
Show marketing remark (303 chars)
Very Large Toll Brothers Built Andover Model Situated On Private One Acre Lot, Brand New High Efficiency Heat Pump, Master Bedroom Suite With Sitting Room, Large Walk In Attic, New Stove, Disposal, Dishwasher, Large Kitchen With Breakfast Room Full Wall Brick Fp, Beautiful Sample Cond. This Won't Last!
-
1991-04-29soldstatus $201,500
ⓘ Source: listings_history table (triggers on properties + properties_extension) + one-shot
backfill from property_details.listing_events for pre-trigger history.
Tax reassessment forecast PA · Partial reset (capped growth)
- Current annual tax
- $7,972 · $664/mo
- Projected year-2 tax
- $8,924 · $744/mo
- Expected delta
- +$951/yr (+$79/mo · 11.9%)
ⓘ Screening estimate from a state-policy table — verify with the county assessor before closing.
Climate risk First Street
- Flood 1/10 Low FEMA zone X (unshaded) · 0% chance over 30 yrs
- Wildfire 1/10 Low
- Heat 5/10 Major 7 d/yr ≥101°F today · 15 d/yr by 30 yrs out
- Wind 6/10 Major 27% chance of damaging wind over 30 yrs
- Air quality 5/10 Major 6 unhealthy d/yr today · 8 by 30 yrs out
Nearby sold comps map
Loading sold comps map…
Walkable amenities ~0.75 mi
Loading nearby amenities…
Taxation est. · year 1
- Rental income
- $61,012
- − Mortgage interest
- −$35,010
- − Property taxes
- −$7,972
- − Insurance
- −$3,125
- − Repairs & maintenance
- −$4,881
- − Management
- −$4,881
- − Depreciation
- −$18,182
- Taxable loss
- −$13,039
- Est. tax savings @ 24.0%
- +$3,129
- After-tax cash flow
- $901/yr
For passive investors: Depreciation is non-cash, so a rental often shows a tax loss while cash-flowing — sheltering income. Rental losses are passive: they offset passive income freely, and up to $25,000/yr can offset ordinary (W-2) income if you actively participate and your MAGI is under $100k (phasing out to $0 by $150k); unused losses carry forward. On sale, claimed depreciation is recaptured at up to 25%, and gains may owe capital-gains tax (a 1031 exchange can defer both). Figures are a year-1 estimate at your 24.0% rate — not tax advice; consult a CPA.
Schools (NCES district)
- District
- Council Rock SD
- NCES district ID
- 4206960
- Math proficiency
- 56% ▼ -12.00%
- Reading proficiency
- 68% ▼ -13.00%
- Median HH income
- $110,567
- Composite
- 58.48/100
- National rank
- #1000
- State rank
- #36 of 539 in PA
Livability — Richboro
- Score
- 75/100
- State rank
- #459
- US rank
- #4183
Category grades
Schools grade is shown separately in the Schools card above.
Census & demographics
- Census place
- Richboro, PA
- City population
- 10,864
- Population (ZIP)
- 10,864
Population outlook (Bucks County) Hauer SSP2
- Today (2025)
- 630,973 people
- By 2030
- 627,093 · -0.6%
- By 2040
- 609,680 · -3.4%
- By 2050
- 584,225 · -7.4%
- By 2075
- 539,840 · -14.4%
- By 2100
- 483,970 · -23.3%
Race, ethnicity, and origin ACS 2023
- Neighborhood character
- Predominantly White (83%)
- Race & ethnicity
- White 83% Two or more races 5% Hispanic / Latino 4% Asian 4% Black 2%
- Common ancestry
- Scotch-Irish 9% Romanian 7% Subsaharan African 2%
- Foreign-born
- 12% · Canada, South Korea
- Languages at home
- 83% English-only · Russian/Polish/Slavic 11% Spanish 3% Other Indo-European 1%
Political lean MEDSL · Bucks
- 2024 margin
- Toss-up / Even · D 49.5% · R 49.5%
- 2008→2024 swing
- -8.7pp toward R · 2008: 8.7pp · 2024: -0.1pp
- All cycles
- 2024: R+0.1 2020: D+4.4 2016: D+0.6 2012: D+1.2 2008: D+8.7
Not yet ingested
- Civics
- —
Market trends
- HPI YoY
- ▼ -325.74%
- Current HPI
- 283.3196
- Rent YoY
- —
- Metro
- —
- State GDP YoY
- ▲ 1.68%
- F500 in state
- 34
Industry mix (Fortune 500 HQ in PA)
| Industry | F500 HQs | Revenue |
|---|---|---|
| Healthcare | 2 | $309B |
|
||
| Insurance | 2 | $27B |
|
||
| Telecommunications / Media | 1 | $124B |
|
||
| Industrial Distribution | 1 | $22B |
|
||
| Financial Services | 1 | $20B |
|
||
| Chemicals / Materials | 1 | $18B |
|
||
Price history
+210.2% since first listed6 events — show timeline
- 2026-05-28 Coming Soon $625,000 BRIGHT MLS
- 1995-08-29 Sold (Public Records) $210,000 Public Records
- 1995-08-24 Sold (MLS) $210,000 BRIGHT MLS
- 1995-07-20 Listing Removed — BRIGHT MLS
- 1995-07-09 Listed $210,000 BRIGHT MLS
- 1991-04-29 Sold (Public Records) $201,500 Public Records
Property tax history
+2.4%/yrLatest (2026): $7,972 · +4.5% YoY. Source: county tax records.
Cash-flow waterfall
monthlySold comps — $/sqft
last 12 mo · ≤1 miLoading sold comps…