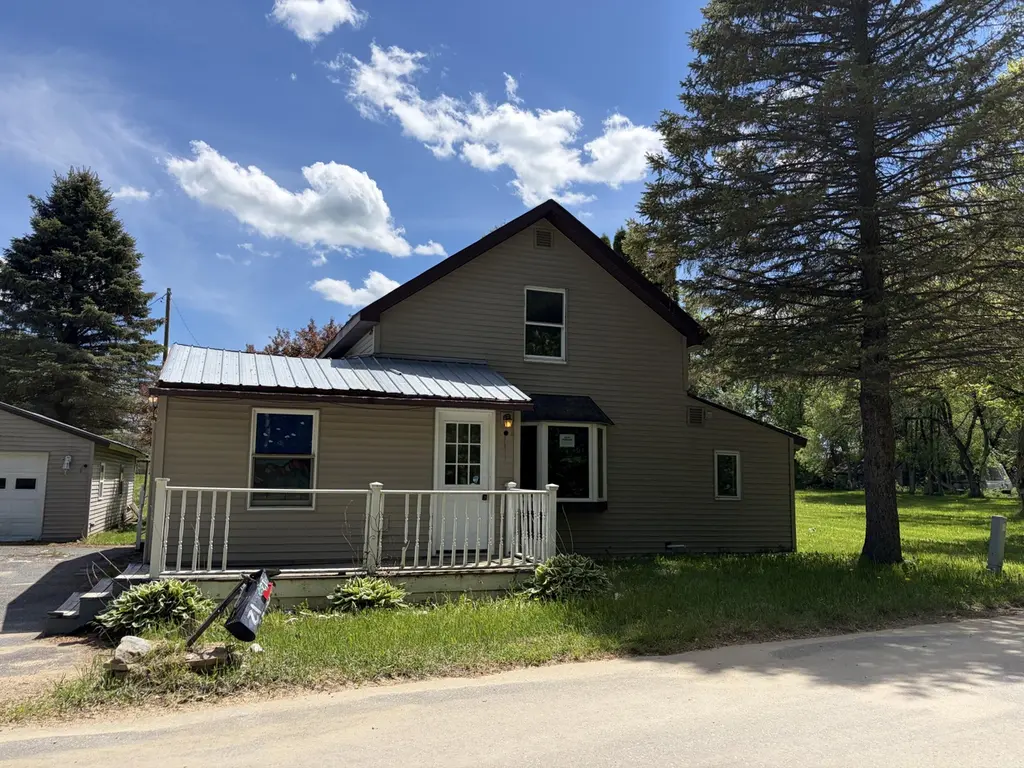
12 Railroad St · Altona, NY
Flood risk 1/10 · Minimal
- FEMA flood zone
- X (unshaded)
- Chance of flooding over 30 yrs
- 0.0%
- Est. flood insurance / yr
- $473 – $860
Fire risk 2/10 · Minimal
- Est. fire insurance / yr
- $691 – $1,283
Heat risk 2/10 · Minimal
- Hot days now (above 92°F)
- 7 days/yr
- Hot days in 30 yrs
- 16 days/yr
Wind risk 1/10 · Minimal
- Chance of severe wind over 30 yrs
- 0.0%
Air-quality risk 2/10 · Minimal
- Unhealthy air days now
- 0 days/yr
- Unhealthy air days in 30 yrs
- 1 days/yr
Risk factors via First Street. Map © Google.
Why this score? — see what drove the C grade
The composite is a weighted blend of 9 inputs, each scored 0–100. Each bar is that input's sub-score; the figure is the points it added to the 100-point composite (weight × sub-score).
- Cash flow +17.4/30.0
- Appreciation +8.2/10.0
- ARV discount +7.5/15.0
- 1% rule +5.9/10.0
- DSCR +5.4/10.0
- Schools +4.1/10.0
- Livability +2.6/5.0
- Rent growth +2.5/5.0
- Condition / age +2.5/5.0
$99,900
🖨 Deal sheet 📄 Offer letter ✓ Due diligence
Listing remarks MLS
Great home for a first time home buyer. Recently renovated and located on a quiet street. Large yard. Enjoy quiet country living while taking advantage of the low taxes.
Key facts
- Quiet street
- Metal roof
- Wood stove
Tags
Property features AI
Exterior
- Parking: Driveway; Garage faces the front; Has garage
- Utilities: Private water source; 100 amp electric service; Electricity connected; Sewer: unknown
- Home design: Single-family residence; One and one-half stories; Vinyl siding; Metal roof
- Construction: Vinyl siding construction; Metal roof; Year built not provided
- Exterior features: Front porch; Level lot; Paved road access; Garage(s) on property
Interior
- Kitchen: Dishwasher; Electric range; Refrigerator
- Bedrooms: 6 total rooms (bedroom count not specified)
- Flooring: Carpet; Laminate; Vinyl; Wood
- Bathrooms: 2 full bathrooms
- Heating & cooling: Hot water heating (oil); Ceiling fans; No central air listed
- Interior features: Ceiling fans; Therapeutic whirlpool
- Laundry & utility: Basement with interior entry and sump pump (unfinished)
Neighborhood map
What this means for you Summary
Snapshot
- This is a 3-bed/2.0-bath single-family listed at $100k.
Deal economics
- At list price, monthly cash flow is $76 ($909/yr) — positive.
- The deal already cash-flows at list — no discount required.
- Meets the 1% rule at list price ($1k rent vs $100k).
- Recommended offer: $98k (1.5% below list) — sets the bar for market timing.
Location & tenants
- Location reads 51/100 on livability (#1,166 in NY) — a working-class tenant base; expect higher turnover. Strengths: cost of living A+, crime A; Watch: health & safety C-, schools F, amenities F.
- Northern Adirondack Central School District (rural): math 47% / reading 49% proficiency, ranked #430 of 590 in NY (top 73%) — families likely to look elsewhere, expect single-tenant / working-renter base with shorter leases.
- Market conditions: 19 active listings in the ZIP; 192 units permitted in Clinton County in 2024 (64 in 5+ unit buildings).
Forward outlook
- In year one you build about $7k of equity ($691 loan paydown + $6k appreciation (6.5% local appreciation)).
- Clinton County population projected at -16% by 2050 — secular population decline; favor cash flow + early exit over multi-decade hold.
- At projected returns (6.5% appreciation + 3.0% rent growth), your $28k cash investment doubles in ~4 years — after that, you're playing with house money.
- By year 5, paydown + projected appreciation supports a ~$32k cash-out refi (75% LTV) — recoverable capital for the next deal without selling this one.
Negotiation context
- It's been on market 16 days — a 2% lower offer ($98k) is reasonable based on typical stale-listing flexibility.
- 2 sale attempts since 5y ago with the ask held roughly flat each time — persistent listings suggest the price (not the market) is what's stuck; bring a comps-based counter.
Risks & watch-outs
- Watch-outs: property tax is 2.6% of price; built in 1890 — expect roof / HVAC / electrical / plumbing capex.
Questions for the listing agent
- Built in 1890 — when were the roof, HVAC, electrical panel, plumbing, and water heater last replaced?
- Property tax is high relative to price — has the assessment been appealed recently, and will the sale trigger a re-assessment?
- Is there a deadline driving the sale (1031 exchange, divorce, estate, relocation)? That informs how much negotiation room exists.
- Schools are F-rated, which usually means shorter tenancies and higher turnover. Who's the typical renter profile here, and what's been the actual vacancy rate?
- What's the average days-on-market for RENTAL listings here right now (not sales)? A rising rental-DOM trend means longer vacancies and softer asking-rent achievability than the comps imply.
- What's the recent tenant-quality profile in this submarket — average credit score on applications, eviction rate, late-payment / NSF rate, and stable-employment percentage? A property-management company in the area should have these aggregated.
- How much new for-sale + rental construction is in the pipeline within 1–3 miles? Heavy new supply typically softens prices + rents 12–24 months out; constrained supply supports both.
Investment metrics
- 1% rule
- 1.09% ✓
- Cap rate
- 7.20%
- Cash-on-cash
- 3.25%
- DSCR
- 1.14
- GRM
- 7.6
CMA / ARV
No comps found within radius.
Projected returns pro-forma
6.49% appreciation · 3.0% rent growth · sell at horizon
- IRR
- 19.2%
- Equity multiple
- 2.31×
- Total profit
- $36,670
- Equity at exit
- $65,914
- IRR
- 18.4%
- Equity multiple
- 4.70×
- Total profit
- $103,545
- Equity at exit
- $122,315
Cash invested: $27,972 (down + closing). Projections, not guarantees.
Landlord ↔ Tenant lean methodology
- Overall (STATE)
- 15 Strongly Tenant-Friendly
- State New York
- 15 Strongly Tenant-Friendly · D+10
- County
- — inherits STATE
- City
- — inherits STATE
ZIP-level market 12935
- Home prices YoY
- 2.2%
- Active inventory
- 19
- Price-to-rent
- 7.6×
Monthly cashflow live
- Estimated rent
- $1,089 medium interval (Pro) →
- Mortgage (P&I)
- −$524
- Tax from tax record
- −$219 /mo · $2,631/yr
- Insurance
- −$42
- HOA
- −$0
- Vacancy / Maint / Mgmt
- −$229
- Net cashflow
- $76
Break-even live
UW: 25.0% down · 7.5% · 30yr · 1.5% tax · 5.0% vac · 8.0% maint · 8.0% mgmt
Financing live
Cash to close
- Down payment
- $24,975
- Closing costs
- $2,997
- Reserves months
- —
- Total cash needed
- —
Loan-product check · same deal, 3 products live
Conventional
25% down · 7.5% · 30yr
- Down + closing
- —
- Monthly P&I
- —
- Monthly cashflow
- —
- DSCR
- —
- Eligible?
- —
Personal DTI + credit; lowest rate.
DSCR
20% down · 8.5% · 30yr
- Down + closing
- —
- Monthly P&I
- —
- Monthly cashflow
- —
- DSCR
- —
- Eligible?
- —
No personal income docs; deal must DSCR.
Hard money
10% down · 12.0% · 12mo
- Down + closing
- —
- Monthly P&I
- —
- Monthly cashflow
- —
- DSCR
- —
- Eligible?
- —
Short-term bridge; refi at stabilization.
Listing history 12 events
-
2026-06-18days on market $99,900 Active 16 DOM
-
2026-06-17days on market $99,900 Active 15 DOM
-
2026-06-16days on market $99,900 Active 14 DOM
-
2026-06-15days on market $99,900 Active 13 DOM
-
2026-06-13days on market $99,900 Active 11 DOM
-
2026-06-12days on market $99,900 Active 10 DOM
-
2026-06-09days on market $99,900 Active 7 DOM
-
2026-06-08days on market $99,900 Active 6 DOM
-
2026-06-07days on market $99,900 Active 5 DOM
-
2026-06-07days on market $99,900 Active 4 DOM
-
2026-06-03remarks 336-char remark
-
2026-06-03$99,900 Active 1 DOM
ⓘ Source: listings_history table (triggers on properties + properties_extension) + one-shot
backfill from property_details.listing_events for pre-trigger history.
Tax reassessment forecast NY · Partial reset (capped growth)
- Current annual tax
- $2,631 · $219/mo
- Projected year-2 tax
- $2,631 · $219/mo
- Expected delta
- $0/yr ($0/mo · 0.0%)
ⓘ Screening estimate from a state-policy table — verify with the county assessor before closing.
Climate risk First Street
- Flood 1/10 Low FEMA zone X (unshaded) · 0% chance over 30 yrs
- Wildfire 2/10 Low
- Heat 2/10 Low 7 d/yr ≥92°F today · 16 d/yr by 30 yrs out
- Wind 1/10 Low 0% chance of damaging wind over 30 yrs
- Air quality 2/10 Low 0 unhealthy d/yr today · 1 by 30 yrs out
Nearby sold comps map
Loading sold comps map…
Walkable amenities ~0.75 mi
Loading nearby amenities…
Taxation est. · year 1
- Rental income
- $13,072
- − Mortgage interest
- −$5,596
- − Property taxes
- −$2,631
- − Insurance
- −$500
- − Repairs & maintenance
- −$1,046
- − Management
- −$1,046
- − Depreciation
- −$2,906
- Taxable loss
- −$653
- Est. tax savings @ 24.0%
- +$157
- After-tax cash flow
- $1,066/yr
For passive investors: Depreciation is non-cash, so a rental often shows a tax loss while cash-flowing — sheltering income. Rental losses are passive: they offset passive income freely, and up to $25,000/yr can offset ordinary (W-2) income if you actively participate and your MAGI is under $100k (phasing out to $0 by $150k); unused losses carry forward. On sale, claimed depreciation is recaptured at up to 25%, and gains may owe capital-gains tax (a 1031 exchange can defer both). Figures are a year-1 estimate at your 24.0% rate — not tax advice; consult a CPA.
Schools (NCES district)
- District
- Northern Adirondack Central School District
- NCES district ID
- 3621260
- Math proficiency
- 47% ▬ 0.00%
- Reading proficiency
- 49% ▲ 2.00%
- Median HH income
- $44,656
- Composite
- 40.62/100
- National rank
- #3689
- State rank
- #430 of 590 in NY
Livability — Altona
- Score
- 51/100
- State rank
- #1166
- US rank
- #25387
Category grades
Schools grade is shown separately in the Schools card above.
Census & demographics
- Population (ZIP)
- 1,159
Population outlook (Clinton County) Hauer SSP2
- Today (2025)
- 78,791 people
- By 2030
- 76,848 · -2.5%
- By 2040
- 71,579 · -9.2%
- By 2050
- 66,471 · -15.6%
- By 2075
- 57,361 · -27.2%
- By 2100
- 47,232 · -40.1%
Race, ethnicity, and origin ACS 2023
- Neighborhood character
- Predominantly White (96%)
- Race & ethnicity
- White 96% Two or more races 4%
- Common ancestry
- Lithuanian 23% German 2% Iranian 1%
- Foreign-born
- 1% · Canada
Political lean MEDSL · Clinton
- 2024 margin
- Toss-up / Even · D 48.9% · R 51.1%
- 2008→2024 swing
- -25.1pp toward R · 2008: 22.9pp · 2024: -2.2pp
- All cycles
- 2024: R+2.2 2020: D+5.2 2016: D+0.9 2012: D+25.6 2008: D+22.9
Not yet ingested
- Civics
- —
Market trends
- HPI YoY
- ▲ 6.49%
- Current HPI
- 303.7051
- Rent YoY
- —
- Metro
- —
- State GDP YoY
- ▲ 2.60%
- F500 in state
- 92
Industry mix (Fortune 500 HQ in NY)
| Industry | F500 HQs | Revenue |
|---|---|---|
| Financial Services | 10 | $950B |
|
||
| Consumer Goods | 9 | $162B |
|
||
| Insurance | 4 | $225B |
|
||
| Telecommunications | 2 | $144B |
|
||
| Pharmaceuticals | 2 | $112B |
|
||
| Media / Entertainment | 2 | $69B |
|
||
Price history
+103.9% since first listed4 events — show timeline
- 2026-06-02 Listed $99,900 ACVMLS
- 2021-06-01 Sold (MLS) $120,000 ACVMLS
- 2021-01-27 Listed $116,000 ACVMLS
- 1997-07-03 Sold (Public Records) $49,000 Public Records
Property tax history
+6.1%/yrLatest (2025): $2,631 · +4.5% YoY. Source: county tax records.
Cash-flow waterfall
monthlySold comps — $/sqft
last 12 mo · ≤1 miLoading sold comps…