901 6530 #1201 Rd #1201 · Montrose, CO
Flood risk 1/10 · Minimal
- FEMA flood zone
- X (unshaded)
- Chance of flooding over 30 yrs
- 0.0%
- Est. flood insurance / yr
- $507 – $1,088
Fire risk 3/10 · Minor
- Est. fire insurance / yr
- $939 – $1,743
Heat risk 4/10 · Minor
- Hot days now (above 91°F)
- 7 days/yr
- Hot days in 30 yrs
- 18 days/yr
Wind risk 1/10 · Minimal
- Chance of severe wind over 30 yrs
- —
Air-quality risk 1/10 · Minimal
- Unhealthy air days now
- 0 days/yr
- Unhealthy air days in 30 yrs
- 0 days/yr
Risk factors via First Street. Map © Google.
Why this score? — see what drove the C grade
The composite is a weighted blend of 9 inputs, each scored 0–100. Each bar is that input's sub-score; the figure is the points it added to the 100-point composite (weight × sub-score).
- Cash flow +28.5/30.0
- DSCR +10.0/10.0
- 1% rule +6.6/10.0
- Livability +3.4/5.0
- Rent growth +2.5/5.0
- Schools +2.5/10.0
- Condition / age +2.5/5.0
- ARV discount +0.0/15.0
- Appreciation +0.0/10.0
$165,900
🖨 Deal sheet 📄 Offer letter ✓ Due diligence
Listing remarks MLS
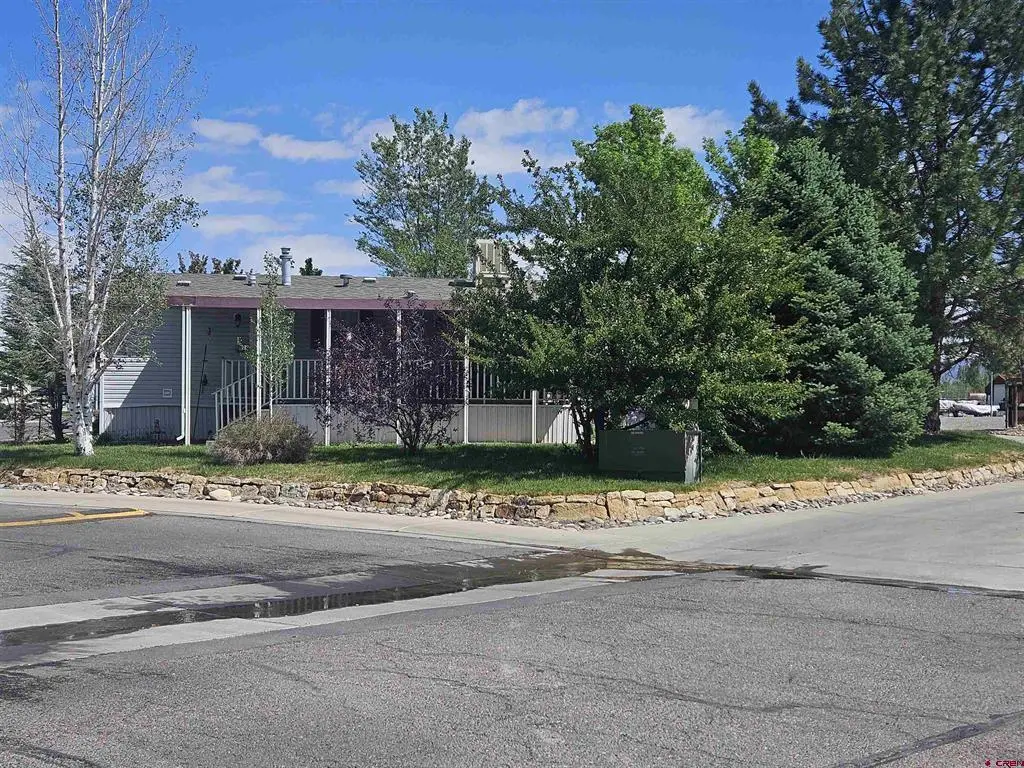
Well maintained home located on a beautiful, landscaped lot, with mature trees. Two large covered, carpeted patios, insulated 10 x 12 shop with electricity, Car port, nice sized bedrooms, walk-in closets and close to paved hiking trails. Located in the 55 + section of park and must be park approved.
Key facts
- Large soaking tub
- Extra storage
- Walk-in closet
Tags
Property features AI
Finance
- Other: Has irrigation water rights
- Financial info: Pets allowed
- HOA & community: Homeowners association (Cimarron Creek); Community clubhouse; Playground
Exterior
- Parking: Carport with 2 spaces
- Utilities: Public water; Public sewer
- Home design: Double wide mobile home; Single-story; Skirt and tie-down foundation; Composition roof; Has a view; Residential single-family
- Construction: Vinyl siding; Composition roof; Skirt and tie-down foundation; Built as a double wide
- Exterior features: Deck; Covered porch; Porch; Sprinkler/irrigation; Landscaping; Shed(s); Partial fencing; Corner lot; City street frontage; Paved road
Interior
- Kitchen: Cooktop; Oven; Range; Dishwasher; Disposal; Refrigerator; Gas water heater
- Bedrooms: Primary bedroom on the main level
- Flooring: Laminate flooring
- Bathrooms: Two full bathrooms; One three-quarter bathroom
- Heating & cooling: Forced air heating (natural gas); Evaporative cooling
- Interior features: Ceiling fans; Eat-in kitchen; Kitchen/dining combo; Main level primary; Unfurnished
Neighborhood map
What this means for you Summary
Snapshot
- This is a 3-bed/2.0-bath manufactured listed at $166k.
Deal economics
- At list price, monthly cash flow is $541 ($6k/yr) — positive.
- The deal already cash-flows at list — no discount required.
- Meets the 1% rule at list price ($2k rent vs $166k).
- Cap rate 10.2% vs local median 2.0% in Montrose — top-decile yield for the area; either an underpriced asset or a hidden risk that comps aren't pricing in. Stress-test before assuming the spread holds.
Location & tenants
- Location reads 68/100 on livability (#109 in CO) — a middle-class / working-renter tenant base. Strengths: housing A+; Watch: amenities C-, schools D+, employment D+.
- Montrose County School District Re-1J (town): math 22% / reading 36% proficiency, ranked #55 of 86 in CO (top 64%) — low school quality limits family demand, transient renter base, plan for 1-2y turnover.
- Market conditions: 371 active listings in the ZIP; 271 units permitted in Montrose County in 2024 (22 in 5+ unit buildings).
- This rent runs 32% of the median local income ($71k/yr) — at the standard rent-burdened threshold; future hikes will face affordability resistance.
Forward outlook
- Local home prices are declining (-3.0%/yr); year-one equity from $1k of loan paydown is wiped out by about $5k of value loss. Plan a longer hold.
- Montrose County population projected at -25% by 2050 — secular population decline; favor cash flow + early exit over multi-decade hold.
- At projected returns (-3.0% appreciation + 3.0% rent growth), your $46k cash investment doubles in ~9 years — after that, you're playing with house money.
Negotiation context
- Only 11 days on market — expect competitive offers; lowballing is unlikely to land.
- 5 sale attempts since 18y ago with the ask held roughly flat each time — persistent listings suggest the price (not the market) is what's stuck; bring a comps-based counter.
- Current owner paid $54k; list at $166k implies a 208% gain — meaningful room to come down on a strong offer.
Questions for the listing agent
- Is there a deadline driving the sale (1031 exchange, divorce, estate, relocation)? That informs how much negotiation room exists.
- Schools are D-rated, which usually means shorter tenancies and higher turnover. Who's the typical renter profile here, and what's been the actual vacancy rate?
- What's the average days-on-market for RENTAL listings here right now (not sales)? A rising rental-DOM trend means longer vacancies and softer asking-rent achievability than the comps imply.
- What's the recent tenant-quality profile in this submarket — average credit score on applications, eviction rate, late-payment / NSF rate, and stable-employment percentage? A property-management company in the area should have these aggregated.
- How much new for-sale + rental construction is in the pipeline within 1–3 miles? Heavy new supply typically softens prices + rents 12–24 months out; constrained supply supports both.
Investment metrics
- 1% rule
- 1.16% ✓
- Cap rate
- 10.21%
- Cash-on-cash
- 13.98%
- DSCR
- 1.62
- GRM
- 7.2
CMA / ARV
- ARV (on-the-fly)
- $141,680
- Comps found
- 12
Show comp detail 12 sales within ~0.75 mi
| Address | Dist | Beds/Ba | Sqft | Sold | Price | $/sf | Match |
|---|---|---|---|---|---|---|---|
| 901 6530 Rd #4101 | 0.00mi | 3/2.0 | 1,216 (-1%) | 5mo | $80,000 | $66 | 94 |
| 901 6530 Rd #1404 | 0.00mi | 3/2.0 | 1,216 (-1%) | 7mo | $123,000 | $101 | 92 |
| 901 6530 Rd #1312 | 0.00mi | 2/2.0 (-1) | 1,188 (-4%) | 4mo | $161,000 | $136 | 86 |
| 901 6530 Rd #2813 | 0.00mi | 2/2.0 (-1) | 1,190 (-3%) | 4mo | $137,500 | $116 | 86 |
| 901 6530 Rd #1206 | 0.00mi | 3/2.0 | 1,296 (+5%) | 8mo | $90,000 | $69 | 84 |
| 901 6530 Rd #2802 | 0.00mi | 3/2.0 | 1,140 (-8%) | 5mo | $119,900 | $105 | 84 |
| 901 6530 Rd #1106 | 0.00mi | 2/2.0 (-1) | 1,149 (-7%) | 6mo | $85,000 | $74 | 79 |
| 901 6530 Rd #1405 | 0.13mi | 3/2.0 | 1,344 (+9%) | 2mo | $155,000 | $115 | 77 |
| 901 6530 Rd #4115 | 0.00mi | 3/2.0 | 1,344 (+9%) | 9mo | $120,000 | $89 | 77 |
| 1367 Corral Dr | 0.47mi | 3/2.0 | 1,269 (+3%) | 8mo | $340,000 | $268 | 67 |
| 1315 Pitchfork Rd | 0.37mi | 3/2.0 | 1,386 (+12%) | 4mo | $385,000 | $278 | 59 |
| 481 6530 Rd | 0.47mi | 3/2.0 | 1,404 (+14%) | 3mo | $312,500 | $223 | 52 |
Match score weights: distance 35% · size 25% · config 20% · recency 20%. Top-matched comps best support the ARV.
Projected returns pro-forma
-3.0% appreciation · 3.0% rent growth · sell at horizon
- IRR
- 4.2%
- Equity multiple
- 1.16×
- Total profit
- $7,502
- Equity at exit
- $24,736
- IRR
- 13.6%
- Equity multiple
- 2.09×
- Total profit
- $50,597
- Equity at exit
- $14,344
Cash invested: $46,452 (down + closing). Projections, not guarantees.
Landlord ↔ Tenant lean methodology
- Overall (STATE)
- 38 Tenant-Leaning
- State Colorado
- 38 Tenant-Leaning · D+4
- County
- — inherits STATE
- City
- — inherits STATE
ZIP-level market 81401
- Active inventory
- 371
- Price-to-rent
- 7.2×
Monthly cashflow live
- Estimated rent
- $1,920 medium interval (Pro) →
- Mortgage (P&I)
- −$870
- Tax from tax record
- −$37 /mo · $440/yr
- Insurance
- −$69
- HOA
- −$0
- Vacancy / Maint / Mgmt
- −$403
- Net cashflow
- $541
Break-even live
UW: 25.0% down · 7.5% · 30yr · 1.5% tax · 5.0% vac · 8.0% maint · 8.0% mgmt
Financing live
Cash to close
- Down payment
- $41,475
- Closing costs
- $4,977
- Reserves months
- —
- Total cash needed
- —
Loan-product check · same deal, 3 products live
Conventional
25% down · 7.5% · 30yr
- Down + closing
- —
- Monthly P&I
- —
- Monthly cashflow
- —
- DSCR
- —
- Eligible?
- —
Personal DTI + credit; lowest rate.
DSCR
20% down · 8.5% · 30yr
- Down + closing
- —
- Monthly P&I
- —
- Monthly cashflow
- —
- DSCR
- —
- Eligible?
- —
No personal income docs; deal must DSCR.
Hard money
10% down · 12.0% · 12mo
- Down + closing
- —
- Monthly P&I
- —
- Monthly cashflow
- —
- DSCR
- —
- Eligible?
- —
Short-term bridge; refi at stabilization.
Listing history 9 events
-
2026-06-19days on market $165,900 Active 11 DOM
-
2026-06-18days on market $165,900 Active 10 DOM
-
2026-06-17days on market $165,900 Active 9 DOM
-
2026-06-16days on market $165,900 Active 8 DOM
-
2026-06-15days on market $165,900 Active 7 DOM
-
2026-06-14days on market $165,900 Active 5 DOM
-
2026-06-12days on market $165,900 Active 4 DOM
-
2026-06-09remarks 695-char remark
-
2026-06-09$165,900 Active 1 DOM
ⓘ Source: listings_history table (triggers on properties + properties_extension) + one-shot
backfill from property_details.listing_events for pre-trigger history.
Tax reassessment forecast CO · Resets to sale price
- Current annual tax
- $440 · $37/mo
- Projected year-2 tax
- $912 · $76/mo
- Expected delta
- +$472/yr (+$39/mo · 107.3%)
ⓘ Screening estimate from a state-policy table — verify with the county assessor before closing.
Climate risk First Street
- Flood 1/10 Low FEMA zone X (unshaded) · 0% chance over 30 yrs
- Wildfire 3/10 Moderate
- Heat 4/10 Moderate 7 d/yr ≥91°F today · 18 d/yr by 30 yrs out
- Wind 1/10 Low
- Air quality 1/10 Low 0 unhealthy d/yr today · 0 by 30 yrs out
Nearby sold comps map
Loading sold comps map…
Walkable amenities ~0.75 mi
Loading nearby amenities…
Taxation est. · year 1
- Rental income
- $23,041
- − Mortgage interest
- −$9,293
- − Property taxes
- −$440
- − Insurance
- −$830
- − Repairs & maintenance
- −$1,843
- − Management
- −$1,843
- − Depreciation
- −$4,826
- Taxable income
- $3,966
- Est. tax owed @ 24.0%
- −$952
- After-tax cash flow
- $5,541/yr
For passive investors: Depreciation is non-cash, so a rental often shows a tax loss while cash-flowing — sheltering income. Rental losses are passive: they offset passive income freely, and up to $25,000/yr can offset ordinary (W-2) income if you actively participate and your MAGI is under $100k (phasing out to $0 by $150k); unused losses carry forward. On sale, claimed depreciation is recaptured at up to 25%, and gains may owe capital-gains tax (a 1031 exchange can defer both). Figures are a year-1 estimate at your 24.0% rate — not tax advice; consult a CPA.
Schools (NCES district)
- District
- Montrose County School District Re-1J
- NCES district ID
- 0805790
- Math proficiency
- 22% ▼ -5.00%
- Reading proficiency
- 36% ▼ -7.00%
- Median HH income
- $45,650
- Composite
- 24.9/100
- National rank
- #7577
- State rank
- #55 of 86 in CO
Livability — Montrose
- Score
- 68/100
- State rank
- #109
- US rank
- #9310
Category grades
Schools grade is shown separately in the Schools card above.
Census & demographics
- Census place
- Montrose, CO
- County
- Montrose County · 24,228 people
- City population
- 24,228
- Metro
- Montrose, CO
- Population (ZIP)
- 24,228
- Household income
- $71,286
- Rent vs Own
- Severe rent burden
- 682.0
Population outlook (Montrose County) Hauer SSP2
- Today (2025)
- 39,229 people
- By 2030
- 37,791 · -3.7%
- By 2040
- 33,829 · -13.8%
- By 2050
- 29,530 · -24.7%
- By 2075
- 20,559 · -47.6%
- By 2100
- 12,144 · -69.0%
Race, ethnicity, and origin ACS 2023
- Neighborhood character
- Predominantly White (74%)
- Race & ethnicity
- White 74% Hispanic / Latino 20% Two or more races 13% Native American 1%
- Hispanic origin (detail)
- Mexican 16%
- Common ancestry
- Slovak 4% Romanian 3% Lithuanian 2%
- Foreign-born
- 6% · Canada
- Languages at home
- 86% English-only · Spanish 11% Other Indo-European 1%
Political lean MEDSL · Montrose
- 2024 margin
- Solid R (+32.6) · D 32.6% · R 65.2% · Other 2.2%
- 2008→2024 swing
- -2.8pp toward R · 2008: -29.8pp · 2024: -32.6pp
- All cycles
- 2024: R+32.6 2020: R+36.5 2016: R+42.1 2012: R+36.4 2008: R+29.8
Not yet ingested
- Civics
- —
Market trends
- HPI YoY
- ▼ -210.94%
- Current HPI
- 373.4909
- Rent YoY
- —
- Metro
- Montrose, CO
- State GDP YoY
- ▲ 1.95%
- F500 in state
- 14
Industry mix (Fortune 500 HQ in CO)
| Industry | F500 HQs | Revenue |
|---|---|---|
| Technology Distribution | 1 | $31B |
|
||
| Food / Agriculture | 1 | $18B |
|
||
| Packaging | 1 | $14B |
|
||
| Healthcare | 1 | $13B |
|
||
| Energy | 1 | $10B |
|
||
| Technology | 1 | $4B |
|
||
Price history
+163.8% since first listed9 events — show timeline
- 2026-06-08 Listed $165,900 cren
- 2014-09-30 Sold (MLS) $53,900 cren
- 2014-06-04 Listed $55,900 cren
- 2013-12-05 Listing Removed — cren
- 2013-06-04 Listed $59,500 cren
- 2013-02-08 Listing Removed — cren
- 2012-08-06 Listed $69,500 cren
- 2008-09-22 Sold (MLS) $61,000 cren
- 2008-02-20 Listed $62,900 cren
Property tax history
+6.8%/yrLatest (2025): $440 · +510.8% YoY. Source: county tax records.
Cash-flow waterfall
monthlySold comps — $/sqft
last 12 mo · ≤1 miLoading sold comps…