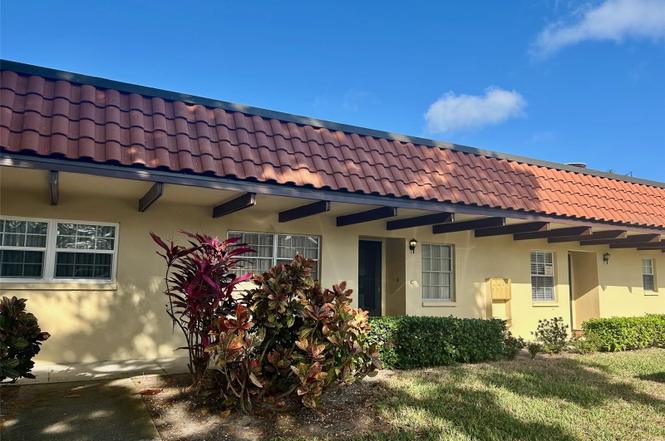
1701 Pinehurst Rd Unit 18C · Dunedin, FL
Flood risk 5/10 · Moderate
- FEMA flood zone
- X (unshaded)
- Chance of flooding over 30 yrs
- 0.66%
- Est. flood insurance / yr
- $507 – $1,088
Fire risk 1/10 · Minimal
- Est. fire insurance / yr
- $947 – $1,759
Heat risk 10/10 · Severe
- Hot days now (above 107°F)
- 7 days/yr
- Hot days in 30 yrs
- 27 days/yr
Wind risk 10/10 · Severe
- Chance of severe wind over 30 yrs
- 99.0%
Air-quality risk 3/10 · Minor
- Unhealthy air days now
- 2 days/yr
- Unhealthy air days in 30 yrs
- 3 days/yr
Risk factors via First Street. Map © Google.
Why this score? — see what drove the D- grade
The composite is a weighted blend of 9 inputs, each scored 0–100. Each bar is that input's sub-score; the figure is the points it added to the 100-point composite (weight × sub-score).
- 1% rule +7.9/10.0
- Cash flow +7.8/30.0
- ARV discount +7.5/15.0
- Schools +4.3/10.0
- Livability +4.3/5.0
- Rent growth +3.2/5.0
- Condition / age +2.5/5.0
- DSCR +1.9/10.0
- Appreciation +0.0/10.0
$159,900
🖨 Deal sheet 📄 Offer letter ✓ Due diligence
Listing remarks
Welcome to your piece of paradise in beautiful Dunedin! This charming villa is nestled in a 55+ community and perfectly positioned at the end of a quiet cul-de-sac, offering both privacy and tranquility. Ideally located, this home is centrally located to vibrant Downtown Dunedin, where you can enjoy local restaurants, boutique shopping, waterfront parks, beaches and year-round events just minutes away. Inside, you will find laminate flooring throughout, creating a clean, modern feel that is both stylish and easy to maintain. The spacious layout features a cozy enclosed porch, walk-in closet for ample storage and the convenience of an in-unit washer and dryer. Additional highlights include
Key facts
- Guest parking
- Quiet cul-de-sac
- Walk-in closet
Tags
Property features AI
Finance
- Other: Directions: SR 580 (Main Street) to Pinehurst Road, pass Dunedin High School, turn right into community; villa is at the back of the community building #18
- Financial info: Total annual fees: $8,208; Lease restrictions apply
- HOA & community: Has HOA (Resource Property Manager - MAckenzie Puckett); Monthly condo fee: $684; Association amenities include clubhouse, pool, recreation facilities, shuffleboard court; Association fee covers cable TV, common area taxes, pool, structure maintenance, grounds maintenance, recreational facilities, sewer, trash, water; Association approval required; Community features: buyer approval required, clubhouse, deed restrictions, pool; Senior community; Cats allowed; Vehicle restrictions
Exterior
- Parking: Assigned parking; Carport (1 space)
- Utilities: Public water; Public sewer; Public utilities
- Home design: Residential villa; One story; East facing
- Construction: Block construction; Membrane and tile roof
- Exterior features: Enclosed patio/porch; Sliding doors; Located on a paved cul-de-sac
Interior
- Kitchen: Dishwasher; Range; Microwave; Refrigerator; Electric water heater
- Bedrooms: 2 bedrooms
- Flooring: Laminate; Block foundation
- Bathrooms: 1 full bathroom
- Heating & cooling: Central heating; Central air conditioning
- Interior features: Ceiling fans; Living room/dining room combo; Split bedroom layout; Walk-in closet(s)
- Laundry & utility: Washer; Dryer; Laundry inside
Neighborhood map
What this means for you Summary
Snapshot
- This is a 2-bed/1.0-bath condo listed at $160k.
Deal economics
- At list price, monthly cash flow is $-174 ($-2k/yr) — negative.
- To cash-flow at today's rent, offer at most $129k (19.2% below list).
- Meets the 1% rule at list price ($2k rent vs $160k).
- Recommended offer: $129k (19.2% below list) — sets the bar for cash-flow.
- Cap rate 5.0% vs local median 2.8% in Dunedin — top-decile yield for the area; either an underpriced asset or a hidden risk that comps aren't pricing in. Stress-test before assuming the spread holds.
Location & tenants
- Location reads 86/100 on livability (#15 in FL, #411 nationally) — a professional / high-income tenant draw. Strengths: crime A+, commute A+, housing A+; Watch: employment C-, amenities D.
- Pinellas (suburban): math 51% / reading 51% proficiency, ranked #31 of 73 in FL (top 42%) — acceptable for families but not a draw, mixed tenant base, ~2y average lease.
- Market conditions: Rents rising (+2.7%/yr); 478 active listings in the ZIP; 28 comparable units currently listed for rent nearby; rentals at typical pace (median 20d on market — plan ~3-4 weeks tenant-placement turnaround); 2,676 units permitted in Pinellas County in 2024 (1,422 in 5+ unit buildings).
- This rent runs 33% of the median local income ($74k/yr) — at the standard rent-burdened threshold; future hikes will face affordability resistance.
Forward outlook
- Local home prices are declining (-3.0%/yr); year-one equity from $1k of loan paydown is wiped out by about $5k of value loss. Plan a longer hold.
- Pinellas County population projected at +14% by 2050 — modest demand growth; plan on rents tracking national, not racing it.
Negotiation context
- It's been on market 62 days — a 6% lower offer ($150k) is reasonable based on typical stale-listing flexibility.
- 2 sale attempts with the ask held roughly flat each time — persistent listings suggest the price (not the market) is what's stuck; bring a comps-based counter.
- Current owner paid $65k; list at $160k implies a 146% gain — meaningful room to come down on a strong offer.
Risks & watch-outs
- Watch-outs: HOA is 33% of rent.
- Climate carrying-cost: moderate flood risk; severe wind risk, 99% chance of damaging wind over 30y; extreme-heat days projected 7→27/yr by 2055 (HVAC capex compounding) — expect insurance premiums to compound above CPI over the hold.
Questions for the listing agent
- What do current leases actually rent for vs. the listed asking? Can we see a recent rent roll and the last 12 months of T-12 income?
- It's been on market 62 days. Have you received any prior offers? Is the seller open to a 19% concession, seller financing, or rate buy-down credit?
- Built in 1976 — when were the roof, HVAC, electrical panel, plumbing, and water heater last replaced?
- What does the HOA fee cover, when was the last increase, and are there any pending special assessments or reserve-fund shortfalls?
- Any open or pending special assessments — roof, HVAC, plumbing, elevator, façade? What's the per-unit balance and payoff schedule, and is the seller paying it off at close or rolling it to the buyer?
- Why hasn't it sold? Are there any deal-killer items the seller is aware of (foundation, flood, title, zoning, code violations)?
- Is there a deadline driving the sale (1031 exchange, divorce, estate, relocation)? That informs how much negotiation room exists.
- Schools are A-rated — typically a magnet for longer-tenancy family renters. What's the average tenant stay here, and is there a school-zone premium baked into asking?
- The area grade is low — what's the realistic commute time and amenity access for the typical tenant pool here? Any planned neighborhood developments (good or bad) we should know about?
- What's the average days-on-market for RENTAL listings here right now (not sales)? A rising rental-DOM trend means longer vacancies and softer asking-rent achievability than the comps imply.
- What's the recent tenant-quality profile in this submarket — average credit score on applications, eviction rate, late-payment / NSF rate, and stable-employment percentage? A property-management company in the area should have these aggregated.
- How much new apartment / multifamily construction is in the pipeline within 1–3 miles? Heavy new supply (>2% of stock underway) typically softens rents 12–24 months out; light construction supports rent growth.
Investment metrics
- 1% rule
- 1.29% ✓
- Cap rate
- 4.99%
- Cash-on-cash
- -4.67%
- DSCR
- 0.79
- GRM
- 6.5
CMA / ARV
No comps found within radius.
Projected returns pro-forma
-3.0% appreciation · 2.69% rent growth · sell at horizon
- IRR
- -24.4%
- Equity multiple
- 0.17×
- Total profit
- $-37,186
- Equity at exit
- $23,842
- IRR
- -20.3%
- Equity multiple
- -0.06×
- Total profit
- $-47,414
- Equity at exit
- $13,825
Cash invested: $44,772 (down + closing). Projections, not guarantees.
Landlord ↔ Tenant lean methodology
- Overall (STATE)
- 87 Strongly Landlord-Friendly
- State Florida
- 87 Strongly Landlord-Friendly · R+3
- County
- — inherits STATE
- City
- — inherits STATE
ZIP-level market 34698
- Rents YoY
- 2.7%
- Active inventory
- 478
- Price-to-rent
- 6.5×
Monthly cashflow live
- Estimated rent
- $2,058 high interval (Pro) →
- Mortgage (P&I)
- −$839
- Tax from tax record
- −$211 /mo · $2,530/yr
- Insurance
- −$67
- HOA
- −$684
- Vacancy / Maint / Mgmt
- −$432
- Net cashflow
- $-174
Break-even live
UW: 25.0% down · 7.5% · 30yr · 1.5% tax · 5.0% vac · 8.0% maint · 8.0% mgmt
Financing live
Cash to close
- Down payment
- $39,975
- Closing costs
- $4,797
- Reserves months
- —
- Total cash needed
- —
Loan-product check · same deal, 3 products live
Conventional
25% down · 7.5% · 30yr
- Down + closing
- —
- Monthly P&I
- —
- Monthly cashflow
- —
- DSCR
- —
- Eligible?
- —
Personal DTI + credit; lowest rate.
DSCR
20% down · 8.5% · 30yr
- Down + closing
- —
- Monthly P&I
- —
- Monthly cashflow
- —
- DSCR
- —
- Eligible?
- —
No personal income docs; deal must DSCR.
Hard money
10% down · 12.0% · 12mo
- Down + closing
- —
- Monthly P&I
- —
- Monthly cashflow
- —
- DSCR
- —
- Eligible?
- —
Short-term bridge; refi at stabilization.
Rent comps 28 comps
| Address | Beds | Baths | Sqft | Rent | $/sqft | DOM | Units | Dist |
|---|---|---|---|---|---|---|---|---|
| 1454 Michigan Blvd Dunedin, FL | 2.0 | 1.0 | 1000 | $2,300 | $2.30 | 4d | 1 | 0.60mi |
| 1141 San Christopher Dr Apt B Dunedin, FL | 2.0 | 1.0 | 1000 | $1,595 | $1.59 | 2d | 1 | 0.63mi |
| 1515 County Road 1 Dunedin, FL | 1.0–2.0 | 1.0 | 719 | $1,750 | $2.43 | 8d | 1 | 0.63mi |
| 1388 Robin Hood Ln Unit 1141-B Dunedin, FL | 2.0 | 1.0 | 1000 | $1,595 | $1.59 | 2d | 1 | 0.64mi |
| 1412 Gladys Cir Unit 1466152P Dunedin, FL | 3.0 | 2.0 | 1097 | $3,847 | $3.51 | 3d | 1 | 0.70mi |
| 1268 Pinehurst Rd Dunedin, FL | 1.0 | 1.0 | 1080 | $1,500 | $1.39 | 17d | 1 | 0.71mi |
| 1196 Angle Rd Dunedin, FL | 1.0 | 1.0 | 700 | $1,675 | $2.39 | 4d | 1 | 0.84mi |
| 639 Michigan Blvd Unit 1800 Dunedin, FL | 1.0 | 1.0 | 616 | $1,200 | $1.95 | 24d | 1 | 0.88mi |
| 690 Regina Rd Dunedin, FL | 2.0 | 1.0 | 745 | $2,195 | $2.95 | 4d | 1 | 0.95mi |
| 1187 Bass Blvd Unit A Dunedin, FL | 2.0 | 1.0 | 850 | $1,850 | $2.18 | 24d | 1 | 1.03mi |
| 1187 Bass Blvd Unit C Dunedin, FL | 2.0 | 1.0 | 850 | $1,850 | $2.18 | 18d | 1 | 1.03mi |
| 905 Patricia Ave Dunedin, FL | 1.0 | 1.0 | 550 | $1,800 | $3.27 | 24d | 1 | 1.09mi |
| 612 Bass Ct Dunedin, FL | 1.0–2.0 | 1.0 | 698 | $2,031 | $2.91 | 1d | 6 | 1.17mi |
| 1579 Bayshore Blvd Dunedin, FL | 3.0 | 2.0 | 1040 | $3,500 | $3.37 | 8d | 1 | 1.22mi |
| 841 Patricia Ave Dunedin, FL | 2.0 | 1.0–2.0 | 904 | $1,950 | $2.16 | 17d | 2 | 1.23mi |
| 841 Patricia Ave #103 Dunedin, FL | 2.0 | 1.0 | 874 | $2,000 | $2.29 | 24d | 1 | 1.23mi |
| 1523 Bayshore Blvd Unit 6 Dunedin, FL | 3.0 | 1.0 | 1061 | $3,000 | $2.83 | 24d | 1 | 1.25mi |
| 1523 Bayshore Blvd Unit 3 Dunedin, FL | 1.0 | 1.0 | 640 | $2,750 | $4.30 | 24d | 1 | 1.25mi |
| 525 Bay St Dunedin, FL | 2.0 | 1.0 | 1104 | $3,500 | $3.17 | 4d | 1 | 1.32mi |
| 580 Skinner Blvd Unit 4 Dunedin, FL | 2.0 | 1.0 | 750 | $2,045 | $2.73 | 24d | 1 | 1.32mi |
| 1430 Heather Ridge Blvd #304 Dunedin, FL | 1.0 | 1.0 | 915 | $1,500 | $1.64 | 24d | 1 | 1.34mi |
| 2494 Del Rio Way Dunedin, FL | 3.0 | 1.5 | 1058 | $3,200 | $3.02 | 24d | 1 | 1.42mi |
| 3055 Belcher Rd Dunedin, FL | 2.0 | 1.0 | 750 | $1,345 | $1.79 | 22d | 1 | 1.43mi |
| 3052 Park Ln Unit B Dunedin, FL | 2.0 | 1.0 | 821 | $1,700 | $2.07 | 24d | 1 | 1.45mi |
| 451 Skinner Blvd Unit A Dunedin, FL | 2.0 | 1.0 | 750 | $1,500 | $2.00 | 8d | 1 | 1.47mi |
| 941 Highland Ave Unit D Dunedin, FL | 1.0 | 1.0 | 1000 | $1,300 | $1.30 | 20d | 1 | 1.48mi |
| 416 Skinner Blvd Unit B Dunedin, FL | 1.0 | 1.0 | 620 | $1,795 | $2.90 | 24d | 1 | 1.48mi |
| 3071 Park Ln Unit C Dunedin, FL | 1.0 | 1.0 | 690 | $1,195 | $1.73 | 24d | 1 | 1.49mi |
HOA detail condo
- Monthly dues
- $684 · $8,208/yr
- Likely covers
- water
- Assessments
- None detected in remarks — confirm with the listing agent.
Listing history 18 events
-
2026-06-18days on market $159,900 Active 62 DOM
-
2026-06-17days on market $159,900 Active 61 DOM
-
2026-06-16days on market $159,900 Active 60 DOM
-
2026-06-15days on market $159,900 Active 59 DOM
-
2026-06-13days on market $159,900 Active 57 DOM
-
2026-06-09days on market $159,900 Active 53 DOM
-
2026-06-08days on market $159,900 Active 52 DOM
-
2026-06-07days on market $159,900 Active 51 DOM
-
2026-06-04days on market $159,900 Active 48 DOM
-
2026-06-03days on market $159,900 Active 47 DOM
-
2026-06-01days on market $159,900 Active 45 DOM
-
2026-05-31days on market $159,900 Active 44 DOM
-
2026-05-15price $159,900
-
2026-05-15status Active
-
2026-04-09status Pending
-
2026-03-12$164,900 Active
-
2003-10-01soldstatus $64,900
-
2003-07-01soldstatus $50,000
ⓘ Source: listings_history table (triggers on properties + properties_extension) + one-shot
backfill from property_details.listing_events for pre-trigger history.
Tax reassessment forecast FL · Resets to sale price
- Current annual tax
- $2,530 · $211/mo
- Projected year-2 tax
- $2,530 · $211/mo
- Expected delta
- $0/yr ($0/mo · 0.0%)
ⓘ Screening estimate from a state-policy table — verify with the county assessor before closing.
Climate risk First Street
- Flood 5/10 Major FEMA zone X (unshaded) · 66% chance over 30 yrs
- Wildfire 1/10 Low
- Heat 10/10 Extreme 7 d/yr ≥107°F today · 27 d/yr by 30 yrs out
- Wind 10/10 Extreme 99% chance of damaging wind over 30 yrs
- Air quality 3/10 Moderate 2 unhealthy d/yr today · 3 by 30 yrs out
Nearby sold comps map
Loading sold comps map…
Walkable amenities ~0.75 mi
Loading nearby amenities…
Taxation est. · year 1
- Rental income
- $24,695
- − Mortgage interest
- −$8,957
- − Property taxes
- −$2,530
- − Insurance
- −$800
- − Repairs & maintenance
- −$1,976
- − Management
- −$1,976
- − HOA
- −$8,208
- − Depreciation
- −$4,652
- Taxable loss
- −$4,402
- Est. tax savings @ 24.0%
- +$1,056
- After-tax cash flow
- $-1,034/yr
For passive investors: Depreciation is non-cash, so a rental often shows a tax loss while cash-flowing — sheltering income. Rental losses are passive: they offset passive income freely, and up to $25,000/yr can offset ordinary (W-2) income if you actively participate and your MAGI is under $100k (phasing out to $0 by $150k); unused losses carry forward. On sale, claimed depreciation is recaptured at up to 25%, and gains may owe capital-gains tax (a 1031 exchange can defer both). Figures are a year-1 estimate at your 24.0% rate — not tax advice; consult a CPA.
Schools (NCES district)
- District
- Pinellas
- NCES district ID
- 1201560
- Math proficiency
- 51% ▼ -5.00%
- Reading proficiency
- 51% ▼ -3.00%
- Median HH income
- $46,270
- Composite
- 43.27/100
- National rank
- #3046
- State rank
- #31 of 73 in FL
Livability — Dunedin
- Score
- 86/100
- State rank
- #15
- US rank
- #411
Category grades
Schools grade is shown separately in the Schools card above.
Census & demographics
- Census place
- Dunedin, FL
- County
- Pinellas County · 939,478 people
- City population
- 38,171
- Metro
- Tampa-St. Petersburg-Clearwater, FL
- Population (ZIP)
- 38,171
- Household income
- $74,078
- Rent vs Own
- Severe rent burden
- 1390.0
Population outlook (Pinellas County) Hauer SSP2
- Today (2025)
- 1,027,532 people
- By 2030
- 1,063,586 · +3.5%
- By 2040
- 1,125,020 · +9.5%
- By 2050
- 1,168,637 · +13.7%
- By 2075
- 1,265,188 · +23.1%
- By 2100
- 1,260,357 · +22.7%
Race, ethnicity, and origin ACS 2023
- Neighborhood character
- Predominantly White (83%)
- Race & ethnicity
- White 83% Two or more races 7% Hispanic / Latino 6% Black 5% Asian 1%
- Hispanic origin (detail)
- Mexican 2% Puerto Rican 2%
- Common ancestry
- Lithuanian 4% Slovak 3% Romanian 3%
- Foreign-born
- 8% · Canada, South Korea
- Languages at home
- 92% English-only · Spanish 3% Other Indo-European 2% Russian/Polish/Slavic 1%
Political lean MEDSL · Pinellas
- 2024 margin
- Lean R (+5.2) · D 46.9% · R 52.1%
- 2008→2024 swing
- -13.5pp toward R · 2008: 8.3pp · 2024: -5.2pp
- All cycles
- 2024: R+5.2 2020: D+0.2 2016: R+1.1 2012: D+5.6 2008: D+8.3
Not yet ingested
- Civics
- —
Market trends
- HPI YoY
- ▼ -515.66%
- Current HPI
- 387.4694
- Rent YoY
- ▲ 2.69%
- Metro
- Tampa-St. Petersburg-Clearwater, FL
- State GDP YoY
- ▲ 3.28%
- F500 in state
- 36
Industry mix (Fortune 500 HQ in FL)
| Industry | F500 HQs | Revenue |
|---|---|---|
| Industrial Technology | 2 | $29B |
|
||
| Insurance | 2 | $17B |
|
||
| Retail | 1 | $60B |
|
||
| Technology Distribution | 1 | $58B |
|
||
| Homebuilding | 1 | $35B |
|
||
| Technology Manufacturing | 1 | $35B |
|
||
Price history
+219.8% since first listed6 events — show timeline
- 2026-05-15 Price Changed $159,900 Stellar MLS as Distributed by MLS Grid
- 2026-05-15 Relisted — Stellar MLS as Distributed by MLS Grid
- 2026-04-09 Pending — Stellar MLS as Distributed by MLS Grid
- 2026-03-12 Listed $164,900 Stellar MLS as Distributed by MLS Grid
- 2003-10-01 Sold (Public Records) $64,900 Public Records
- 2003-07-01 Sold (Public Records) $50,000 Public Records
Property tax history
+9.5%/yrLatest (2025): $2,530 · -1.2% YoY. Source: county tax records.
Cash-flow waterfall
monthlySold comps — $/sqft
last 12 mo · ≤1 miLoading sold comps…