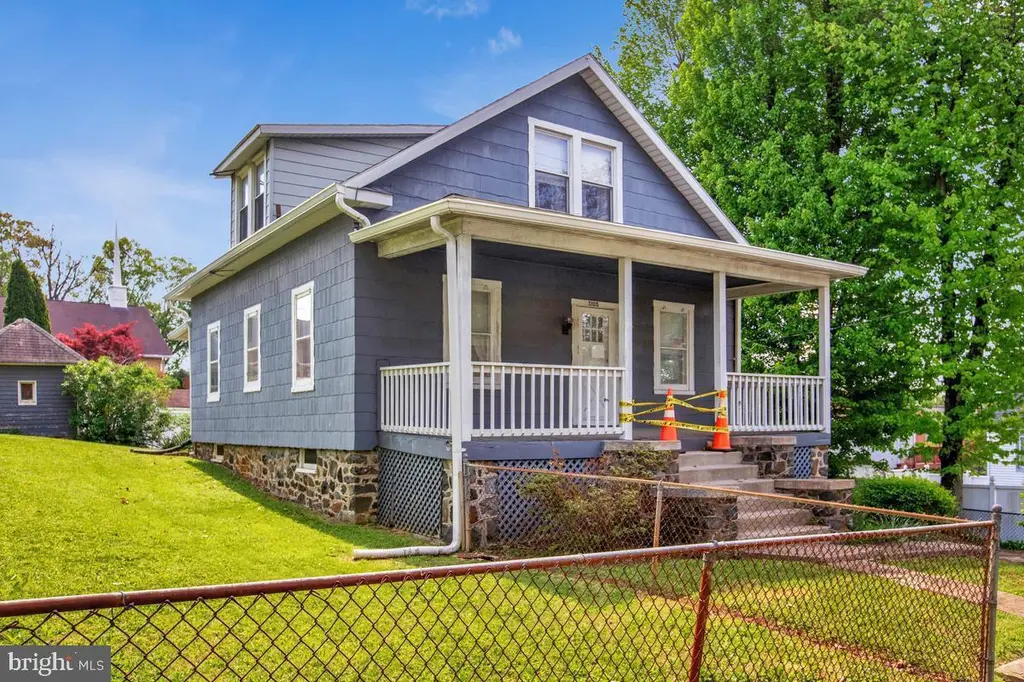
1905 Featherbed Ln · Lochearn, MD
Flood risk 1/10 · Minimal
- FEMA flood zone
- X (unshaded)
- Chance of flooding over 30 yrs
- 0.0%
- Est. flood insurance / yr
- $473 – $860
Fire risk 1/10 · Minimal
- Est. fire insurance / yr
- $755 – $1,403
Heat risk 7/10 · Major
- Hot days now (above 104°F)
- 7 days/yr
- Hot days in 30 yrs
- 15 days/yr
Wind risk 4/10 · Minor
- Chance of severe wind over 30 yrs
- 18.0%
Air-quality risk 3/10 · Minor
- Unhealthy air days now
- 3 days/yr
- Unhealthy air days in 30 yrs
- 4 days/yr
Risk factors via First Street. Map © Google.
Why this score? — see what drove the C grade
The composite is a weighted blend of 9 inputs, each scored 0–100. Each bar is that input's sub-score; the figure is the points it added to the 100-point composite (weight × sub-score).
- ARV discount +15.0/15.0
- Cash flow +14.6/30.0
- Appreciation +9.8/10.0
- DSCR +4.4/10.0
- Rent growth +3.8/5.0
- Livability +3.7/5.0
- 1% rule +3.6/10.0
- Condition / age +2.5/5.0
- Schools +2.3/10.0
$230,000
🖨 Deal sheet 📄 Offer letter ✓ Due diligence
Listing remarks
Needs work - however here's your chance to get one of the largest yards in Richardson Heights! For sale is this 1930 Cape Cod that is situated on 4 lots! There is an extended driveway for approx. 4 cars, 1-car detached garage and a wooden outbuilding in the rear yard. The interior has a combined living room/ dining room with hardwood flooring and a brick wood-burning fireplace. The country kitchen has a gas stove and metal cabinets. Two bedrooms with hardwood flooring and one bath on the main floor. One large bedroom upstairs that could be turned into your primary suite with four storage closets. Full unfinished basement with laundry, double stationary tub and convenient side entrance fr
Key facts
- Largest yards
- Wooden outbuilding
- Country kitchen
Tags
Property features AI
Finance
- Other: Additional parcels included (10, 11, 12, 13); Below-grade area and unfinished space present
Exterior
- Parking: Detached front-entry garage (1-car); Driveway with about 4 spaces; Total of about 5 garage/parking spaces
- Utilities: Public water; Public sewer; Natural gas available; Natural gas hot water; Municipal trash service
- Home design: Detached property; Not in a federal flood zone; Fee simple ownership; Property in average condition
- Construction: Composite roof; Shingle siding and asbestos exterior materials; Stone foundation; Double-hung windows with storm windows; Garage(s) and storage barn/shed on the property; Building not winterized; Year built recorded by assessor
- Exterior features: Porch(es); Outbuilding(s); Chain link fencing; Side yard and rear yard
Interior
- Kitchen: Gas oven/range; Refrigerator
- Bedrooms: Two bedrooms on the main level; One bedroom on the upper level
- Flooring: Hardwood floors
- Bathrooms: One full bathroom on the main level; One full bathroom total
- Heating & cooling: Radiator heating (oil-fired); Window air conditioning units (electric)
- Interior features: Combination dining and living area; Entry-level bedroom; Dry wall walls and ceilings; Storm door
- Laundry & utility: Washer and electric dryer in the basement; Water heater
Neighborhood map
What this means for you Summary
Snapshot
- This is a 3-bed/1.0-bath single-family listed at $230k.
Deal economics
- At list price, monthly cash flow is $53 ($635/yr) — positive.
- The deal already cash-flows at list — no discount required.
- To meet the 1% rule (rent ≥ 1% of price), the offer needs to be $197k (14.2% below list).
- Recommended offer: $197k (14.2% below list) — sets the bar for 1% rule.
- Cap rate 6.6% vs local median 4.5% in Lochearn — top-decile yield for the area; either an underpriced asset or a hidden risk that comps aren't pricing in. Stress-test before assuming the spread holds.
Location & tenants
- Location reads 74/100 on livability (#112 in MD, #4,539 nationally) — a middle-class / working-renter tenant base. Strengths: commute A+, housing A+, employment A-; Watch: crime F, amenities F.
- Baltimore County Public Schools (suburban): math 15% / reading 34% proficiency, ranked #11 of 24 in MD (top 46%) — low school quality limits family demand, transient renter base, plan for 1-2y turnover.
- Market conditions: Rents rising fast (+5.2%/yr); 126 active listings in the ZIP; 23 comparable units currently listed for rent nearby; rentals leasing fast (median 5d on market — plan ~1-2 weeks tenant-placement turnaround); 1,511 units permitted in Baltimore County in 2024 (643 in 5+ unit buildings).
- This rent runs 35% of the median local income ($67k/yr) — at the standard rent-burdened threshold; future hikes will face affordability resistance.
Forward outlook
- In year one you build about $23k of equity ($2k loan paydown + $22k appreciation (9.5% local appreciation)).
- Baltimore County population projected at +12% by 2050 — modest demand growth; plan on rents tracking national, not racing it.
- At projected returns (9.5% appreciation + 5.2% rent growth), your $64k cash investment doubles in ~3 years — after that, you're playing with house money.
- By year 2, paydown + projected appreciation supports a ~$38k cash-out refi (75% LTV) — recoverable capital for the next deal without selling this one.
Negotiation context
- Only 7 days on market — expect competitive offers; lowballing is unlikely to land.
Risks & watch-outs
- Watch-outs: built in 1930 — expect roof / HVAC / electrical / plumbing capex.
- Climate carrying-cost: extreme-heat days projected 7→15/yr by 2055 (HVAC capex compounding) — expect insurance premiums to compound above CPI over the hold.
Questions for the listing agent
- Built in 1930 — when were the roof, HVAC, electrical panel, plumbing, and water heater last replaced?
- Is there a deadline driving the sale (1031 exchange, divorce, estate, relocation)? That informs how much negotiation room exists.
- Schools are B-rated — typically a magnet for longer-tenancy family renters. What's the average tenant stay here, and is there a school-zone premium baked into asking?
- Crime grade is F in this area — have there been break-ins, vandalism, or insurance claims at this property in the last 3 years? What carrier currently insures it and at what premium?
- What's the average days-on-market for RENTAL listings here right now (not sales)? A rising rental-DOM trend means longer vacancies and softer asking-rent achievability than the comps imply.
- What's the recent tenant-quality profile in this submarket — average credit score on applications, eviction rate, late-payment / NSF rate, and stable-employment percentage? A property-management company in the area should have these aggregated.
- How much new for-sale + rental construction is in the pipeline within 1–3 miles? Heavy new supply typically softens prices + rents 12–24 months out; constrained supply supports both.
Investment metrics
- 1% rule
- 0.86% ✗
- Cap rate
- 6.57%
- Cash-on-cash
- 0.99%
- DSCR
- 1.04
- GRM
- 9.7
CMA / ARV
- ARV (median comp)
- $314,034
- List price
- $230,000
- Delta
- -26.76%
- Verdict
- UNDERPRICED
- Comps
- 20 within 1.0 mi
Show comp detail 7 sales within ~0.75 mi
| Address | Dist | Beds/Ba | Sqft | Sold | Price | $/sf | Match |
|---|---|---|---|---|---|---|---|
| 6 Bright Cir | 0.33mi | 3/2.0 | 1,290 (-2%) | 1mo | $275,000 | $213 | 76 |
| 6621 Dogwood | 0.27mi | 3/1.0 | 1,416 (+8%) | 11mo | $330,000 | $233 | 66 |
| 5 Candlewood Ct | 0.39mi | 4/2.0 (+1) | 1,285 (-2%) | 13mo | $385,000 | $300 | 58 |
| 6518 Dogwood Rd | 0.46mi | 3/1.0 | 1,328 (+1%) | 22mo | $300,000 | $226 | 58 |
| 2817 Rona Rd | 0.46mi | 3/2.0 | 1,489 (+13%) | 15mo | $280,000 | $188 | 40 |
| 2112 Lukewood Dr | 0.60mi | 4/2.0 (+1) | 1,508 (+15%) | 23mo | $300,000 | $199 | 19 |
| 6424 Gilmore | 0.66mi | 4/3.0 (+1) | 1,464 (+11%) | 23mo | $419,900 | $287 | 18 |
Match score weights: distance 35% · size 25% · config 20% · recency 20%. Top-matched comps best support the ARV.
Projected returns pro-forma
9.5% appreciation · 5.23% rent growth · sell at horizon
- IRR
- 24.7%
- Equity multiple
- 2.95×
- Total profit
- $125,298
- Equity at exit
- $198,860
- IRR
- 22.5%
- Equity multiple
- 6.81×
- Total profit
- $374,464
- Equity at exit
- $420,271
Cash invested: $64,400 (down + closing). Projections, not guarantees.
Landlord ↔ Tenant lean methodology
- Overall (STATE)
- 27 Tenant-Leaning
- State Maryland
- 27 Tenant-Leaning · D+14
- County
- — inherits STATE
- City
- — inherits STATE
ZIP-level market 21207
- Home prices YoY
- 1.1%
- Rents YoY
- 5.2%
- Active inventory
- 126
- Price-to-rent
- 9.7×
Monthly cashflow live
- Estimated rent
- $1,974 high interval (Pro) →
- Mortgage (P&I)
- −$1,206
- Tax from tax record
- −$204 /mo · $2,453/yr
- Insurance
- −$96
- HOA
- −$0
- Vacancy / Maint / Mgmt
- −$415
- Net cashflow
- $53
Break-even live
UW: 25.0% down · 7.5% · 30yr · 1.5% tax · 5.0% vac · 8.0% maint · 8.0% mgmt
Financing live
Cash to close
- Down payment
- $57,500
- Closing costs
- $6,900
- Reserves months
- —
- Total cash needed
- —
Loan-product check · same deal, 3 products live
Conventional
25% down · 7.5% · 30yr
- Down + closing
- —
- Monthly P&I
- —
- Monthly cashflow
- —
- DSCR
- —
- Eligible?
- —
Personal DTI + credit; lowest rate.
DSCR
20% down · 8.5% · 30yr
- Down + closing
- —
- Monthly P&I
- —
- Monthly cashflow
- —
- DSCR
- —
- Eligible?
- —
No personal income docs; deal must DSCR.
Hard money
10% down · 12.0% · 12mo
- Down + closing
- —
- Monthly P&I
- —
- Monthly cashflow
- —
- DSCR
- —
- Eligible?
- —
Short-term bridge; refi at stabilization.
Rent comps 23 comps
| Address | Beds | Baths | Sqft | Rent | $/sqft | DOM | Units | Dist |
|---|---|---|---|---|---|---|---|---|
| 1 Kafern Dr Gwynn Oak, MD | 1.0–3.0 | 1.0–2.0 | 765 | $1,809 | $2.36 | 3d | 8 | 0.25mi |
| 1 Duke of Windsor Ct Gwynn Oak, MD | 1.0–3.0 | 1.0–2.0 | 775 | $1,984 | $2.56 | 3d | 20 | 0.68mi |
| 6957 Rockfield Rd Windsor Mill, MD | 3.0 | 1.5 | 1024 | $2,400 | $2.34 | 20d | 1 | 0.75mi |
| 2 Mountbatten Ct Gwynn Oak, MD | 3.0 | 2.0 | 1000 | $2,200 | $2.20 | 3d | 1 | 0.81mi |
| 6330 Windsor Mill Rd Woodlawn, MD | 3.0 | 1.0 | 1200 | $1,600 | $1.33 | 43d | 1 | 0.91mi |
| 2420 Bibury Ln Windsor Mill, MD | 1.0–3.0 | 1.0–2.0 | 979 | $2,060 | $2.10 | 1d | 76 | 0.94mi |
| 2340 Noonham Rd Windsor Mill, MD | 2.0–3.0 | 1.5 | 1033 | $1,875 | $1.82 | 3d | 29 | 0.95mi |
| 7106 Rolling Bend Rd Windsor Mill, MD | 1.0–2.0 | 1.0–2.0 | 731 | $1,814 | $2.48 | 2d | 21 | 1.00mi |
| 2602 Camberwell Ct Windsor Mill, MD | 2.0 | 1.5 | 1022 | $1,950 | $1.91 | 23d | 1 | 1.00mi |
| 2612 Camberwell Ct #2612 Windsor Mill, MD | 3.0 | 1.5 | 1036 | $2,300 | $2.22 | 21d | 1 | 1.01mi |
| 6463 Woodgreen Cir Gwynn Oak, MD | 3.0 | 2.5 | 1230 | $1,900 | $1.54 | 17d | 1 | 1.01mi |
| 2621 Hallam Ct Baltimore, MD | 2.0 | 1.5 | 1022 | $1,800 | $1.76 | 23d | 1 | 1.07mi |
| 3101 Windsor Blvd Gwynn Oak, MD | 1.0–2.0 | 1.0–2.0 | 843 | $1,755 | $2.08 | 1d | 55 | 1.10mi |
| 2800 Ashfield Dr Windsor Mill, MD | 2.0 | 2.0 | 1078 | $2,074 | $1.92 | 5d | 8 | 1.13mi |
| 7206 Rutherford Green Cir Windsor Mill, MD | 3.0 | 2.5 | 1372 | $3,000 | $2.19 | 23d | 1 | 1.19mi |
| 7120 Bexhill Rd Windsor Mill, MD | 3.0 | 1.0 | 1140 | $2,124 | $1.86 | 43d | 1 | 1.30mi |
| 2531 Sarrington Cir Windsor Mill, MD | 2.0–3.0 | 1.5–2.0 | 1000 | $1,760 | $1.76 | 1d | 103 | 1.34mi |
| 2701 Claybrooke Dr Windsor Mill, MD | 3.0 | 2.5 | 1664 | $2,400 | $1.44 | 5d | 1 | 1.34mi |
| 2 Walden Birch Ct Woodlawn, MD | 3.0 | 1.5 | 1022 | $1,792 | $1.75 | 5d | 1 | 1.38mi |
| 7005 Rudisill Ct Baltimore, MD | 1.0–3.0 | 1.0–2.0 | 794 | $1,914 | $2.41 | 1d | 21 | 1.41mi |
| 7418 Hindon Cir Unit B1203 Windsor Mill, MD | 2.0 | 2.0 | 1139 | $2,000 | $1.76 | 43d | 1 | 1.45mi |
| 7507 Fairbrook Rd Windsor Mill, MD | 1.0–2.0 | 1.0 | 772 | $1,482 | $1.92 | 2d | 15 | 1.45mi |
| 1600 Cantwell Rd Windsor Mill, MD | 1.0–2.0 | 1.0–2.0 | 859 | $1,944 | $2.26 | 1d | 44 | 1.49mi |
Listing history 4 events
-
2026-05-05status Pending 715-char remark
-
2026-04-28$230,000 Active 715-char remark
-
2004-03-08soldstatus $192,000
-
1972-06-26soldstatus $17,900
ⓘ Source: listings_history table (triggers on properties + properties_extension) + one-shot
backfill from property_details.listing_events for pre-trigger history.
Tax reassessment forecast MD · Partial reset (capped growth)
- Current annual tax
- $2,453 · $204/mo
- Projected year-2 tax
- $2,480 · $207/mo
- Expected delta
- +$27/yr (+$2/mo · 1.1%)
ⓘ Screening estimate from a state-policy table — verify with the county assessor before closing.
Climate risk First Street
- Flood 1/10 Low FEMA zone X (unshaded) · 0% chance over 30 yrs
- Wildfire 1/10 Low
- Heat 7/10 Severe 7 d/yr ≥104°F today · 15 d/yr by 30 yrs out
- Wind 4/10 Moderate 18% chance of damaging wind over 30 yrs
- Air quality 3/10 Moderate 3 unhealthy d/yr today · 4 by 30 yrs out
Nearby sold comps map
Loading sold comps map…
Walkable amenities ~0.75 mi
Loading nearby amenities…
Taxation est. · year 1
- Rental income
- $23,686
- − Mortgage interest
- −$12,884
- − Property taxes
- −$2,453
- − Insurance
- −$1,150
- − Repairs & maintenance
- −$1,895
- − Management
- −$1,895
- − Depreciation
- −$6,691
- Taxable loss
- −$3,282
- Est. tax savings @ 24.0%
- +$788
- After-tax cash flow
- $1,422/yr
For passive investors: Depreciation is non-cash, so a rental often shows a tax loss while cash-flowing — sheltering income. Rental losses are passive: they offset passive income freely, and up to $25,000/yr can offset ordinary (W-2) income if you actively participate and your MAGI is under $100k (phasing out to $0 by $150k); unused losses carry forward. On sale, claimed depreciation is recaptured at up to 25%, and gains may owe capital-gains tax (a 1031 exchange can defer both). Figures are a year-1 estimate at your 24.0% rate — not tax advice; consult a CPA.
Schools (NCES district)
- District
- Baltimore County Public Schools
- NCES district ID
- 2400120
- Math proficiency
- 15% ▼ -16.00%
- Reading proficiency
- 34% ▼ -5.00%
- Median HH income
- $66,746
- Composite
- 23.17/100
- National rank
- #7948
- State rank
- #11 of 24 in MD
Livability — Lochearn
- Score
- 74/100
- State rank
- #112
- US rank
- #4539
Category grades
Schools grade is shown separately in the Schools card above.
Census & demographics
- Census place
- Lochearn, MD
- County
- Baltimore County · 769,527 people
- Metro
- Baltimore-Columbia-Towson, MD
- Population (ZIP)
- 47,099
- Household income
- $67,060
- Rent vs Own
- Severe rent burden
- 2139.0
Population outlook (Baltimore County) Hauer SSP2
- Today (2025)
- 885,518 people
- By 2030
- 909,272 · +2.7%
- By 2040
- 951,547 · +7.5%
- By 2050
- 990,955 · +11.9%
- By 2075
- 1,086,411 · +22.7%
- By 2100
- 1,135,078 · +28.2%
Race, ethnicity, and origin ACS 2023
- Neighborhood character
- Predominantly Black (78%)
- Race & ethnicity
- Black 78% White 8% Hispanic / Latino 7% Two or more races 5% Asian 3%
- Hispanic origin (detail)
- Puerto Rican 1%
- Common ancestry
- Swedish 1%
- Foreign-born
- 13% · Canada, Philippines, South Korea
- Languages at home
- 86% English-only · Spanish 4% French/Haitian/Cajun 1% Other Asian/Pacific 1%
Political lean MEDSL · Baltimore
- 2024 margin
- Strong D (+24.5) · D 61.0% · R 36.5% · Other 2.5%
- 2008→2024 swing
- +9.9pp toward D · 2008: 14.6pp · 2024: 24.5pp
- All cycles
- 2024: D+24.5 2020: D+27.0 2016: D+17.4 2012: D+16.4 2008: D+14.6
Not yet ingested
- Civics
- —
Market trends
- HPI YoY
- ▲ 9.50%
- Current HPI
- 843.63
- Rent YoY
- ▲ 5.23%
- Metro
- Baltimore-Columbia-Towson, MD
- State GDP YoY
- ▲ 2.97%
- F500 in state
- 12
Industry mix (Fortune 500 HQ in MD)
| Industry | F500 HQs | Revenue |
|---|---|---|
| Aerospace / Defense | 1 | $71B |
|
||
| Utilities | 1 | $25B |
|
||
| Hotels | 1 | $24B |
|
||
| Consumer Goods | 1 | $7B |
|
||
| Real Estate | 1 | $6B |
|
||
| Chemicals | 1 | $2B |
|
||
Price history
+1134.6% since first listed5 events — show timeline
- 2026-06-01 Sold (MLS) $221,000 BRIGHT MLS
- 2026-05-05 Pending — BRIGHT MLS
- 2026-04-28 Listed $230,000 BRIGHT MLS
- 2004-03-08 Sold (Public Records) $192,000 Public Records
- 1972-06-26 Sold (Public Records) $17,900 Public Records
Property tax history
+3.4%/yrLatest (2025): $2,453 · +4.6% YoY. Source: county tax records.
Cash-flow waterfall
monthlySold comps — $/sqft
last 12 mo · ≤1 miLoading sold comps…