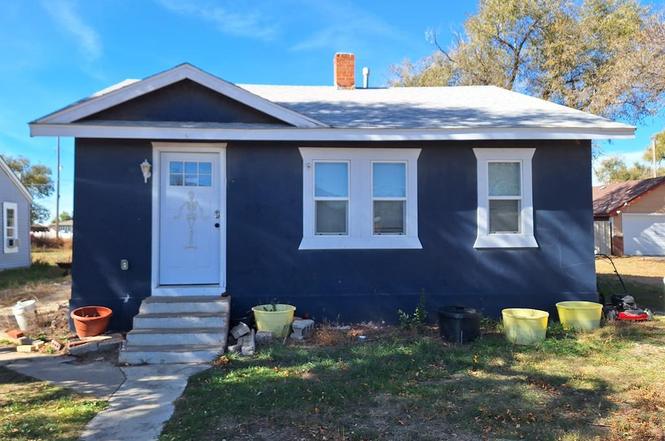
833 Santa Fe St · Springfield, CO
Flood risk No data
- FEMA flood zone
- —
- Chance of flooding over 30 yrs
- —
- Est. flood insurance / yr
- —
Fire risk No data
- Est. fire insurance / yr
- —
Heat risk No data
- Hot days now (above threshold)
- —
- Hot days in 30 yrs
- —
Wind risk No data
- Chance of severe wind over 30 yrs
- —
Air-quality risk No data
- Unhealthy air days now
- —
- Unhealthy air days in 30 yrs
- —
Risk factors via First Street. Map © Google.
Why this score? — see what drove the C+ grade
The composite is a weighted blend of 9 inputs, each scored 0–100. Each bar is that input's sub-score; the figure is the points it added to the 100-point composite (weight × sub-score).
- Cash flow +24.9/30.0
- DSCR +8.1/10.0
- ARV discount +7.5/15.0
- 1% rule +5.5/10.0
- Appreciation +5.0/10.0
- Livability +3.3/5.0
- Rent growth +2.5/5.0
- Condition / age +2.5/5.0
- Schools +2.2/10.0
$99,000
🖨 Deal sheet 📄 Offer letter ✓ Due diligence
Listing remarks MLS
This 3 bedroom 1 bath house could be your home! Nicely remodeled and move in ready! Large lot with plenty of room to add a garage if you like. Due to unforeseen circumstances this home is back on the market. Passed FHA inspection and was also appraised! Home is nicely redone with central heat and air. Call us today for your personal showing!
Key facts
- Close to school
- Large lot
- Off-street parking
Tags
Property features AI
Finance
- HOA & community: No association amenities
Exterior
- Parking: No garage
- Security: Smoke detector(s)
- Utilities: Public water; Public sewer
- Home design: Single-family residential; One story above grade
- Construction: Frame and stucco construction
- Exterior features: Composition roof; Lot dimensions approximately 75 x 140; Zoned R
Interior
- Kitchen: Range; Oven; Dishwasher; Refrigerator
- Bedrooms: 3 main-level bedrooms
- Flooring: Vinyl flooring
- Bathrooms: 1 full bathroom on main level
- Heating & cooling: Central air; Ceiling fan(s); Natural gas forced-air heating
- Interior features: Ceiling fans; Master suite on main level; Double-pane windows; Smoke detector(s)
- Laundry & utility: Washer and dryer on main level; Basement with storage space
Neighborhood map
What this means for you Summary
Snapshot
- This is a 3-bed/1.0-bath other listed at $99k.
Deal economics
- At list price, monthly cash flow is $211 ($3k/yr) — positive.
- The deal already cash-flows at list — no discount required.
- Meets the 1% rule at list price ($1k rent vs $99k).
- Recommended offer: $87k (12.0% below list) — sets the bar for market timing.
Location & tenants
- Location reads 66/100 on livability (#145 in CO) — a middle-class / working-renter tenant base. Strengths: crime A+, cost of living A+, housing A+; Watch: health & safety C-, schools F, amenities F.
- Springfield School District No. Re-4 (rural): math 20% / reading 25% proficiency, ranked #149 of 176 in CO (top 85%) — low school quality limits family demand, transient renter base, plan for 1-2y turnover.
- Market conditions: 15 active listings in the ZIP; 5 units permitted in Baca County in 2024 (0 in 5+ unit buildings).
Forward outlook
- In year one you build about $4k of equity ($684 loan paydown + $3k appreciation (3.0% local appreciation)).
- Baca County population projected at -27% by 2050 — secular population decline; favor cash flow + early exit over multi-decade hold.
- At projected returns (3.0% appreciation + 3.0% rent growth), your $28k cash investment doubles in ~5 years — after that, you're playing with house money.
- By year 9, paydown + projected appreciation supports a ~$31k cash-out refi (75% LTV) — recoverable capital for the next deal without selling this one.
Negotiation context
- It's been on market 227 days — a 12% lower offer ($87k) is reasonable based on typical stale-listing flexibility.
- 2 sale attempts since 5y ago; this cycle's ask has dropped $6k (6%) from the opening price — seller is motivated, your offer sets the floor, not the list.
Risks & watch-outs
- Watch-outs: built in 1928 — expect roof / HVAC / electrical / plumbing capex.
Questions for the listing agent
- It's been on market 227 days. Have you received any prior offers? Is the seller open to a 12% concession, seller financing, or rate buy-down credit?
- Built in 1928 — when were the roof, HVAC, electrical panel, plumbing, and water heater last replaced?
- Why hasn't it sold? Are there any deal-killer items the seller is aware of (foundation, flood, title, zoning, code violations)?
- Is there a deadline driving the sale (1031 exchange, divorce, estate, relocation)? That informs how much negotiation room exists.
- Schools are F-rated, which usually means shorter tenancies and higher turnover. Who's the typical renter profile here, and what's been the actual vacancy rate?
- What's the average days-on-market for RENTAL listings here right now (not sales)? A rising rental-DOM trend means longer vacancies and softer asking-rent achievability than the comps imply.
- What's the recent tenant-quality profile in this submarket — average credit score on applications, eviction rate, late-payment / NSF rate, and stable-employment percentage? A property-management company in the area should have these aggregated.
- How much new for-sale + rental construction is in the pipeline within 1–3 miles? Heavy new supply typically softens prices + rents 12–24 months out; constrained supply supports both.
Investment metrics
- 1% rule
- 1.05% ✓
- Cap rate
- 8.86%
- Cash-on-cash
- 9.15%
- DSCR
- 1.41
- GRM
- 7.9
CMA / ARV
No comps found within radius.
Projected returns pro-forma
3.0% appreciation · 3.0% rent growth · sell at horizon
- IRR
- 16.0%
- Equity multiple
- 1.92×
- Total profit
- $25,365
- Equity at exit
- $44,515
- IRR
- 17.6%
- Equity multiple
- 3.58×
- Total profit
- $71,398
- Equity at exit
- $68,602
Cash invested: $27,720 (down + closing). Projections, not guarantees.
Landlord ↔ Tenant lean methodology
- Overall (STATE)
- 38 Tenant-Leaning
- State Colorado
- 38 Tenant-Leaning · D+4
- County
- — inherits STATE
- City
- — inherits STATE
ZIP-level market 81073
- Active inventory
- 15
- Price-to-rent
- 7.9×
Monthly cashflow live
- Estimated rent
- $1,042 medium interval (Pro) →
- Mortgage (P&I)
- −$519
- Tax from tax record
- −$51 /mo · $613/yr
- Insurance
- −$41
- HOA
- −$0
- Vacancy / Maint / Mgmt
- −$219
- Net cashflow
- $211
Break-even live
UW: 25.0% down · 7.5% · 30yr · 1.5% tax · 5.0% vac · 8.0% maint · 8.0% mgmt
Financing live
Cash to close
- Down payment
- $24,750
- Closing costs
- $2,970
- Reserves months
- —
- Total cash needed
- —
Loan-product check · same deal, 3 products live
Conventional
25% down · 7.5% · 30yr
- Down + closing
- —
- Monthly P&I
- —
- Monthly cashflow
- —
- DSCR
- —
- Eligible?
- —
Personal DTI + credit; lowest rate.
DSCR
20% down · 8.5% · 30yr
- Down + closing
- —
- Monthly P&I
- —
- Monthly cashflow
- —
- DSCR
- —
- Eligible?
- —
No personal income docs; deal must DSCR.
Hard money
10% down · 12.0% · 12mo
- Down + closing
- —
- Monthly P&I
- —
- Monthly cashflow
- —
- DSCR
- —
- Eligible?
- —
Short-term bridge; refi at stabilization.
Listing history 22 events
-
2026-06-18days on market $99,000 Active 227 DOM
-
2026-06-17days on market $99,000 Active 226 DOM
-
2026-06-16days on market $99,000 Active 225 DOM
-
2026-06-15days on market $99,000 Active 224 DOM
-
2026-06-13days on market $99,000 Active 222 DOM
-
2026-06-12days on market $99,000 Active 221 DOM
-
2026-06-09days on market $99,000 Active 218 DOM
-
2026-06-08days on market $99,000 Active 217 DOM
-
2026-06-07days on market $99,000 Active 216 DOM
-
2026-06-07days on market $99,000 Active 215 DOM
-
2026-06-04days on market $99,000 Active 212 DOM
-
2026-06-02days on market $99,000 Active 211 DOM
-
2026-06-01days on market $99,000 Active 210 DOM
-
2026-05-31days on market $99,000 Active 209 DOM
-
2026-05-31days on market $99,000 Active 208 DOM
-
2025-12-29price $99,000
-
2025-11-03$105,000 Active
-
2022-09-06soldstatus $117,000 344-char remark
Show marketing remark (344 chars)
This 3 bedroom 1 bath house could be your home! Nicely remodeled and move in ready! Large lot with plenty of room to add a garage if you like. Due to unforeseen circumstances this home is back on the market. Passed FHA inspection and was also appraised! Home is nicely redone with central heat and air. Call us today for your personal showing!
-
2022-09-06soldstatus $247,000
Show marketing remark (344 chars)
This 3 bedroom 1 bath house could be your home! Nicely remodeled and move in ready! Large lot with plenty of room to add a garage if you like. Due to unforeseen circumstances this home is back on the market. Passed FHA inspection and was also appraised! Home is nicely redone with central heat and air. Call us today for your personal showing!
-
2021-06-30$120,000 344-char remark
Show marketing remark (344 chars)
This 3 bedroom 1 bath house could be your home! Nicely remodeled and move in ready! Large lot with plenty of room to add a garage if you like. Due to unforeseen circumstances this home is back on the market. Passed FHA inspection and was also appraised! Home is nicely redone with central heat and air. Call us today for your personal showing!
-
2017-11-21soldstatus $30,000
-
2016-09-26soldstatus $30,500
ⓘ Source: listings_history table (triggers on properties + properties_extension) + one-shot
backfill from property_details.listing_events for pre-trigger history.
Tax reassessment forecast CO · Resets to sale price
- Current annual tax
- $613 · $51/mo
- Projected year-2 tax
- $613 · $51/mo
- Expected delta
- $0/yr ($0/mo · 0.0%)
ⓘ Screening estimate from a state-policy table — verify with the county assessor before closing.
Nearby sold comps map
Loading sold comps map…
Walkable amenities ~0.75 mi
Loading nearby amenities…
Taxation est. · year 1
- Rental income
- $12,501
- − Mortgage interest
- −$5,546
- − Property taxes
- −$613
- − Insurance
- −$495
- − Repairs & maintenance
- −$1,000
- − Management
- −$1,000
- − Depreciation
- −$2,880
- Taxable income
- $967
- Est. tax owed @ 24.0%
- −$232
- After-tax cash flow
- $2,305/yr
For passive investors: Depreciation is non-cash, so a rental often shows a tax loss while cash-flowing — sheltering income. Rental losses are passive: they offset passive income freely, and up to $25,000/yr can offset ordinary (W-2) income if you actively participate and your MAGI is under $100k (phasing out to $0 by $150k); unused losses carry forward. On sale, claimed depreciation is recaptured at up to 25%, and gains may owe capital-gains tax (a 1031 exchange can defer both). Figures are a year-1 estimate at your 24.0% rate — not tax advice; consult a CPA.
Schools (NCES district)
- District
- Springfield School District No. Re-4
- NCES district ID
- 0806630
- Math proficiency
- 20% ▲ 5.00%
- Reading proficiency
- 25% ▲ 5.00%
- Median HH income
- $33,541
- Composite
- 21.55/100
- National rank
- #13620
- State rank
- #149 of 176 in CO
Livability — Springfield
- Score
- 66/100
- State rank
- #145
- US rank
- #12006
Category grades
Schools grade is shown separately in the Schools card above.
Census & demographics
- Census place
- Springfield, CO
- Population (ZIP)
- 1,880
Population outlook (Baca County) Hauer SSP2
- Today (2025)
- 3,249 people
- By 2030
- 3,053 · -6.0%
- By 2040
- 2,691 · -17.2%
- By 2050
- 2,362 · -27.3%
- By 2075
- 1,812 · -44.2%
- By 2100
- 1,263 · -61.1%
Race, ethnicity, and origin ACS 2023
- Neighborhood character
- Predominantly White (80%)
- Race & ethnicity
- White 80% Hispanic / Latino 14% Two or more races 5% Asian 4%
- Hispanic origin (detail)
- Mexican 13%
- Common ancestry
- Italian 4% Slovak 2% Serbian 2%
- Foreign-born
- 5% · Canada, Vietnam
- Languages at home
- 94% English-only · Spanish 2% Vietnamese 2% Tagalog/Filipino 1%
Political lean MEDSL · Baca
- 2024 margin
- Solid R (+70.4) · D 13.7% · R 84.1% · Other 2.1%
- 2008→2024 swing
- -22.8pp toward R · 2008: -47.6pp · 2024: -70.4pp
- All cycles
- 2024: R+70.4 2020: R+69.7 2016: R+68.2 2012: R+52.1 2008: R+47.6
Not yet ingested
- Civics
- —
Market trends
- HPI YoY
- —
- Current HPI
- —
- Rent YoY
- —
- Metro
- —
- State GDP YoY
- ▲ 1.95%
- F500 in state
- 14
Industry mix (Fortune 500 HQ in CO)
| Industry | F500 HQs | Revenue |
|---|---|---|
| Technology Distribution | 1 | $31B |
|
||
| Food / Agriculture | 1 | $18B |
|
||
| Packaging | 1 | $14B |
|
||
| Healthcare | 1 | $13B |
|
||
| Energy | 1 | $10B |
|
||
| Technology | 1 | $4B |
|
||
Price history
+224.6% since first listed7 events — show timeline
- 2025-12-29 Price Changed $99,000 PARMLS
- 2025-11-03 Listed $105,000 PARMLS
- 2022-09-06 Sold (Public Records) $247,000 Public Records
- 2022-09-06 Sold (MLS) $117,000 PARMLS
- 2021-06-30 Listed $120,000 PARMLS
- 2017-11-21 Sold (Public Records) $30,000 Public Records
- 2016-09-26 Sold (Public Records) $30,500 Public Records
Property tax history
+16.4%/yrLatest (2025): $613 · +408.6% YoY. Source: county tax records.
Cash-flow waterfall
monthlySold comps — $/sqft
last 12 mo · ≤1 miLoading sold comps…