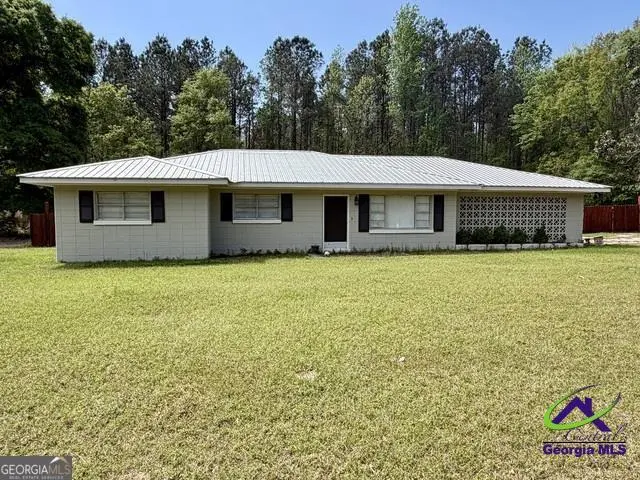
1387 US 29 Hwy · East Dublin, GA
Flood risk 1/10 · Minimal
- FEMA flood zone
- X (unshaded)
- Chance of flooding over 30 yrs
- 0.0%
- Est. flood insurance / yr
- $507 – $1,088
Fire risk 6/10 · Moderate
- Est. fire insurance / yr
- $963 – $1,789
Heat risk 7/10 · Major
- Hot days now (above 108°F)
- 7 days/yr
- Hot days in 30 yrs
- 18 days/yr
Wind risk 8/10 · Major
- Chance of severe wind over 30 yrs
- 80.0%
Air-quality risk 2/10 · Minimal
- Unhealthy air days now
- 0 days/yr
- Unhealthy air days in 30 yrs
- 1 days/yr
Risk factors via First Street. Map © Google.
Why this score? — see what drove the D grade
The composite is a weighted blend of 9 inputs, each scored 0–100. Each bar is that input's sub-score; the figure is the points it added to the 100-point composite (weight × sub-score).
- Cash flow +13.4/30.0
- ARV discount +9.3/15.0
- DSCR +4.0/10.0
- Schools +3.5/10.0
- Livability +3.1/5.0
- 1% rule +2.6/10.0
- Rent growth +2.5/5.0
- Condition / age +2.5/5.0
- Appreciation +0.0/10.0
$192,000
🖨 Deal sheet (PDF) 📄 Offer letter ✓ Due diligence
Listing remarks MLS
Check this one out! Charming home on 2 acres with private POND! 2 living areas, kitchen with eat-in breakfast area. 3 bedrooms and one full bath. Privacy fenced back yard. Move in ready!
Key facts
- 2 acres
- Private pond
- 2 acre lot
Tags
Neighborhood map
What this means for you Summary
Snapshot
- This is a 3-bed/2.0-bath single-family listed at $192k.
Deal economics
- At list price, monthly cash flow is $4 ($51/yr) — positive.
- The deal already cash-flows at list — no discount required.
- To meet the 1% rule (rent ≥ 1% of price), the offer needs to be $146k (24.2% below list).
- Recommended offer: $146k (24.2% below list) — sets the bar for 1% rule.
Location & tenants
- Location reads 62/100 on livability (#326 in GA) — a middle-class / working-renter tenant base. Strengths: cost of living A+, housing A+, crime A; Watch: schools D-, amenities F, commute F.
- Laurens County (rural): math 45% / reading 39% proficiency, ranked #42 of 174 in GA (top 24%) — families likely to look elsewhere, expect single-tenant / working-renter base with shorter leases.
- Market conditions: 32 active listings in the ZIP; 55 units permitted in Laurens County in 2024 (24 in 5+ unit buildings).
Forward outlook
- Local home prices are declining (-3.0%/yr); year-one equity from $1k of loan paydown is wiped out by about $6k of value loss. Plan a longer hold.
- Laurens County population projected at -21% by 2050 — secular population decline; favor cash flow + early exit over multi-decade hold.
Negotiation context
- It's been on market 47 days — a 3% lower offer ($186k) is reasonable based on typical stale-listing flexibility.
Risks & watch-outs
- Climate carrying-cost: severe wind risk, 80% chance of damaging wind over 30y; major wildfire risk; extreme-heat days projected 7→18/yr by 2055 (HVAC capex compounding) — expect insurance premiums to compound above CPI over the hold.
Questions for the listing agent
- It's been on market 47 days. Have you received any prior offers? Is the seller open to a 24% concession, seller financing, or rate buy-down credit?
- Built in 1960 — when were the roof, HVAC, electrical panel, plumbing, and water heater last replaced?
- Is there a deadline driving the sale (1031 exchange, divorce, estate, relocation)? That informs how much negotiation room exists.
- Schools are D-rated, which usually means shorter tenancies and higher turnover. Who's the typical renter profile here, and what's been the actual vacancy rate?
- The area grade is low — what's the realistic commute time and amenity access for the typical tenant pool here? Any planned neighborhood developments (good or bad) we should know about?
- What's the average days-on-market for RENTAL listings here right now (not sales)? A rising rental-DOM trend means longer vacancies and softer asking-rent achievability than the comps imply.
- What's the recent tenant-quality profile in this submarket — average credit score on applications, eviction rate, late-payment / NSF rate, and stable-employment percentage? A property-management company in the area should have these aggregated.
- How much new for-sale + rental construction is in the pipeline within 1–3 miles? Heavy new supply typically softens prices + rents 12–24 months out; constrained supply supports both.
Investment metrics
- 1% rule
- 0.76% ✗
- Cap rate
- 6.32%
- Cash-on-cash
- 0.09%
- DSCR
- 1.00
- GRM
- 11.0
CMA / ARV
- ARV (median comp)
- $200,025
- List price
- $192,000
- Delta
- -4.01%
- Verdict
- FAIR
- Comps
- 5 within 2.0 mi
Projected returns pro-forma
-3.0% appreciation · 3.0% rent growth · sell at horizon
- IRR
- -16.2%
- Equity multiple
- 0.42×
- Total profit
- $-30,931
- Equity at exit
- $28,628
- IRR
- -8.0%
- Equity multiple
- 0.50×
- Total profit
- $-26,949
- Equity at exit
- $16,601
Cash invested: $53,760 (down + closing). Projections, not guarantees.
Landlord ↔ Tenant lean methodology
- Overall (STATE)
- 90 Strongly Landlord-Friendly
- State Georgia
- 90 Strongly Landlord-Friendly · R+3
- County
- — inherits STATE
- City
- — inherits STATE
ZIP-level market 31027
- Home prices YoY
- -7.6%
- Active inventory
- 32
- Price-to-rent
- 11.0×
Monthly cashflow live
- Estimated rent
- $1,456 medium interval (Pro) →
- Mortgage (P&I)
- −$1,007
- Tax from tax record
- −$59 /mo · $705/yr
- Insurance
- −$80
- HOA
- −$0
- Vacancy / Maint / Mgmt
- −$306
- Net cashflow
- $4
Break-even live
Sensitivity live
| Price | -10% $113 | -5% $59 | +0% $4 | +5% $-50 | +10% $-104 |
|---|---|---|---|---|---|
| Rent | -10% $-111 | -5% $-53 | +0% $4 | +5% $62 | +10% $119 |
| Rate | -1.0pp $101 | -0.5pp $53 | base $4 | +0.5pp $-46 | +1.0pp $-96 |
UW: 25.0% down · 7.5% · 30yr · 1.5% tax · 5.0% vac · 8.0% maint · 8.0% mgmt
Financing live
Cash to close
- Down payment
- $48,000
- Closing costs
- $5,760
- Reserves months
- —
- Total cash needed
- —
Loan-product check · same deal, 3 products live
Conventional
25% down · 7.5% · 30yr
- Down + closing
- —
- Monthly P&I
- —
- Monthly cashflow
- —
- DSCR
- —
- Eligible?
- —
Personal DTI + credit; lowest rate.
DSCR
20% down · 8.5% · 30yr
- Down + closing
- —
- Monthly P&I
- —
- Monthly cashflow
- —
- DSCR
- —
- Eligible?
- —
No personal income docs; deal must DSCR.
Hard money
10% down · 12.0% · 12mo
- Down + closing
- —
- Monthly P&I
- —
- Monthly cashflow
- —
- DSCR
- —
- Eligible?
- —
Short-term bridge; refi at stabilization.
Listing history 2 events
-
2026-05-18status Pending 186-char remark
Show marketing remark (186 chars)
Check this one out! Charming home on 2 acres with private POND! 2 living areas, kitchen with eat-in breakfast area. 3 bedrooms and one full bath. Privacy fenced back yard. Move in ready!
-
2026-04-01$192,000 Active 186-char remark
Show marketing remark (186 chars)
Check this one out! Charming home on 2 acres with private POND! 2 living areas, kitchen with eat-in breakfast area. 3 bedrooms and one full bath. Privacy fenced back yard. Move in ready!
ⓘ Source: listings_history table (triggers on properties + properties_extension) + one-shot
backfill from property_details.listing_events for pre-trigger history.
Tax reassessment forecast GA · Resets to sale price
- Current annual tax
- $705 · $59/mo
- Projected year-2 tax
- $1,766 · $147/mo
- Expected delta
- +$1,061/yr (+$88/mo · 150.4%)
ⓘ Screening estimate from a state-policy table — verify with the county assessor before closing.
Climate risk First Street
- Flood 1/10 Low FEMA zone X (unshaded) · 0% chance over 30 yrs
- Wildfire 6/10 Major
- Heat 7/10 Severe 7 d/yr ≥108°F today · 18 d/yr by 30 yrs out
- Wind 8/10 Severe 80% chance of damaging wind over 30 yrs
- Air quality 2/10 Low 0 unhealthy d/yr today · 1 by 30 yrs out
Nearby sold comps map
Loading sold comps map…
Walkable amenities ~0.75 mi
Loading nearby amenities…
Taxation est. · year 1
- Rental income
- $17,467
- − Mortgage interest
- −$10,755
- − Property taxes
- −$705
- − Insurance
- −$960
- − Repairs & maintenance
- −$1,397
- − Management
- −$1,397
- − Depreciation
- −$5,585
- Taxable loss
- −$3,334
- Est. tax savings @ 24.0%
- +$800
- After-tax cash flow
- $851/yr
For passive investors: Depreciation is non-cash, so a rental often shows a tax loss while cash-flowing — sheltering income. Rental losses are passive: they offset passive income freely, and up to $25,000/yr can offset ordinary (W-2) income if you actively participate and your MAGI is under $100k (phasing out to $0 by $150k); unused losses carry forward. On sale, claimed depreciation is recaptured at up to 25%, and gains may owe capital-gains tax (a 1031 exchange can defer both). Figures are a year-1 estimate at your 24.0% rate — not tax advice; consult a CPA.
Schools (NCES district)
- District
- Laurens County
- NCES district ID
- 1301890
- Math proficiency
- 45% ▼ -8.00%
- Reading proficiency
- 39% ▼ -8.00%
- Median HH income
- $38,220
- Composite
- 35.06/100
- National rank
- #5030
- State rank
- #42 of 174 in GA
Livability — East Dublin
- Score
- 62/100
- State rank
- #326
- US rank
- #17266
Category grades
Schools grade is shown separately in the Schools card above.
Census & demographics
- Population (ZIP)
- 10,879
Population outlook (Laurens County) Hauer SSP2
- Today (2025)
- 45,685 people
- By 2030
- 44,056 · -3.6%
- By 2040
- 40,270 · -11.9%
- By 2050
- 36,094 · -21.0%
- By 2075
- 26,275 · -42.5%
- By 2100
- 17,160 · -62.4%
Race, ethnicity, and origin ACS 2023
- Neighborhood character
- Diverse neighborhood (Simpson 0.58)
- Race & ethnicity
- White 54% Black 35% Hispanic / Latino 8% Two or more races 3%
- Hispanic origin (detail)
- Mexican 6%
- Common ancestry
- Slovak 1%
- Foreign-born
- 5% · Canada
- Languages at home
- 92% English-only · Spanish 8%
Political lean MEDSL · Laurens
- 2024 margin
- Solid R (+32.7) · D 33.5% · R 66.2%
- 2008→2024 swing
- -11.2pp toward R · 2008: -21.5pp · 2024: -32.7pp
- All cycles
- 2024: R+32.7 2020: R+28.2 2016: R+29.1 2012: R+22.7 2008: R+21.5
Not yet ingested
- Civics
- —
Market trends
- HPI YoY
- ▼ -16.67%
- Current HPI
- 202.153
- Rent YoY
- —
- Metro
- —
- State GDP YoY
- ▲ 2.66%
- F500 in state
- 28
Industry mix (Fortune 500 HQ in GA)
| Industry | F500 HQs | Revenue |
|---|---|---|
| Paper / Packaging | 2 | $29B |
|
||
| Retail | 1 | $160B |
|
||
| Transportation / Logistics | 1 | $91B |
|
||
| Airlines | 1 | $62B |
|
||
| Consumer Goods | 1 | $47B |
|
||
| Utilities | 1 | $25B |
|
||
Price history
2 events — show timeline
- 2026-05-18 Pending — CGMLS
- 2026-04-01 Listed $192,000 CGMLS
Property tax history
-0.9%/yrLatest (2025): $705 · -2.2% YoY. Source: county tax records.
Cash-flow waterfall
monthlySold comps — $/sqft
last 12 mo · ≤1 miLoading sold comps…