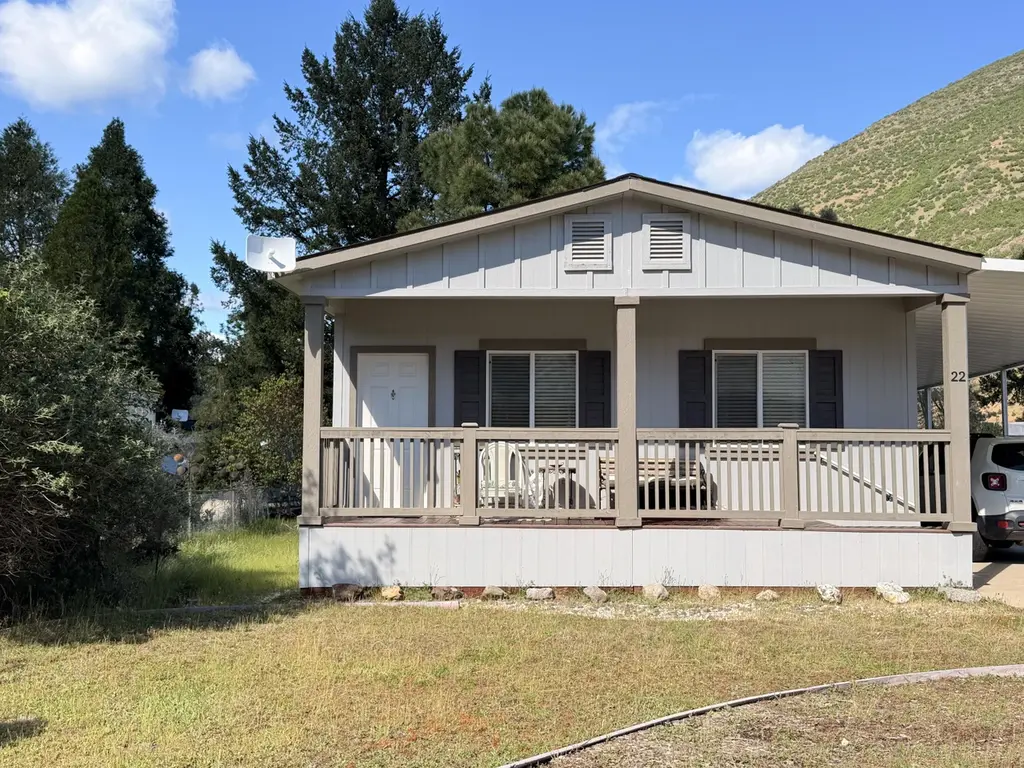
13905 Trinity Mountain Rd Unit 22 · French Gulch, CA
Flood risk 5/10 · Moderate
- FEMA flood zone
- X (unshaded)
- Chance of flooding over 30 yrs
- 0.24%
- Est. flood insurance / yr
- $507 – $1,088
Fire risk 5/10 · Moderate
- Est. fire insurance / yr
- $659 – $1,223
Heat risk 8/10 · Major
- Hot days now (above 100°F)
- 8 days/yr
- Hot days in 30 yrs
- 19 days/yr
Wind risk 1/10 · Minimal
- Chance of severe wind over 30 yrs
- —
Air-quality risk 10/10 · Severe
- Unhealthy air days now
- 39 days/yr
- Unhealthy air days in 30 yrs
- 42 days/yr
Risk factors via First Street. Map © Google.
Why this score? — see what drove the B+ grade
The composite is a weighted blend of 9 inputs, each scored 0–100. Each bar is that input's sub-score; the figure is the points it added to the 100-point composite (weight × sub-score).
- Cash flow +29.6/30.0
- ARV discount +10.3/15.0
- DSCR +10.0/10.0
- 1% rule +8.3/10.0
- Appreciation +5.0/10.0
- Schools +4.6/10.0
- Livability +2.8/5.0
- Condition / age +2.8/5.0
- Rent growth +2.5/5.0
$127,000
🖨 Deal sheet 📄 Offer letter ✓ Due diligence
Listing remarks
Like new 2021manufactured home in very well-maintained family friendly park that is located right next to Clear Creek. Home features 3 bedrooms, 2 bathrooms, inside laundry room and a very spacious living room, kitchen and dining area. Let's not forget the very functional island breakfast bar area with plenty of room for bar stools. Enjoy morning sunrises or sunsets on the roomy front porch. The mobile home park is located in the historic town of French Gulch. Just a short drive to Whiskeytown Lake, where you can enjoy exploring numerous waterfalls, hiking trails, boating, fishing, paddleboarding or kayaking. Redding is a short drive away for all of your shopping needs.
Key facts
- Historic town
- Manufactured home
- Island breakfast bar
Tags
Property features AI
Finance
- HOA & community: Located in Clear Creek Mobile Estates (mobile home park)
Exterior
- Parking: Two parking spaces total; One covered carport space; Guest parking available
- Home design: Manufactured home located in a park; Mobile home
- Construction: Metal skirting; Park model listed as United States
- Exterior features: Composition roof; Level topography; Asphalt road access; Corner lot in a mobile home park; Has a view
Interior
- Flooring: Vinyl; Carpet
- Heating & cooling: Central air conditioning; Forced air heating
- Interior features: Vinyl and carpet flooring; No fireplace
Neighborhood map
What this means for you Summary
Snapshot
- This is a 3-bed/2.0-bath manufactured listed at $127k. Condition is rated average.
Deal economics
- At list price, monthly cash flow is $456 ($5k/yr) — positive.
- The deal already cash-flows at list — no discount required.
- Meets the 1% rule at list price ($2k rent vs $127k).
- Recommended offer: $123k (3.0% below list) — sets the bar for market timing.
Location & tenants
- Location reads 55/100 on livability (#834 in CA) — a working-class tenant base; expect higher turnover. Strengths: housing A+; Watch: schools D+, crime F, amenities F.
- Shasta Union High (urban): math 41% / reading 67% proficiency, ranked #122 of 517 in CA (top 24%) — acceptable for families but not a draw, mixed tenant base, ~2y average lease; only 16% free/reduced lunch — higher-income household profile.
- Market conditions: 15 active listings in the ZIP; 246 units permitted in Shasta County in 2024 (0 in 5+ unit buildings).
Forward outlook
- In year one you build about $5k of equity ($878 loan paydown + $4k appreciation (3.0% local appreciation)).
- Shasta County population projected to shrink 9% by 2050 — rents likely to lag national; underwrite the cash flow, not the appreciation.
- At projected returns (3.0% appreciation + 3.0% rent growth), your $36k cash investment doubles in ~4 years — after that, you're playing with house money.
- By year 8, paydown + projected appreciation supports a ~$35k cash-out refi (75% LTV) — recoverable capital for the next deal without selling this one.
Negotiation context
- It's been on market 38 days — a 3% lower offer ($123k) is reasonable based on typical stale-listing flexibility.
Risks & watch-outs
- Climate carrying-cost: moderate flood risk; moderate wildfire risk; extreme-heat days projected 8→19/yr by 2055 (HVAC capex compounding) — expect insurance premiums to compound above CPI over the hold.
Questions for the listing agent
- It's been on market 38 days. Have you received any prior offers? Is the seller open to a 3% concession, seller financing, or rate buy-down credit?
- Is there a deadline driving the sale (1031 exchange, divorce, estate, relocation)? That informs how much negotiation room exists.
- Schools are D-rated, which usually means shorter tenancies and higher turnover. Who's the typical renter profile here, and what's been the actual vacancy rate?
- Crime grade is F in this area — have there been break-ins, vandalism, or insurance claims at this property in the last 3 years? What carrier currently insures it and at what premium?
- What's the average days-on-market for RENTAL listings here right now (not sales)? A rising rental-DOM trend means longer vacancies and softer asking-rent achievability than the comps imply.
- What's the recent tenant-quality profile in this submarket — average credit score on applications, eviction rate, late-payment / NSF rate, and stable-employment percentage? A property-management company in the area should have these aggregated.
- How much new for-sale + rental construction is in the pipeline within 1–3 miles? Heavy new supply typically softens prices + rents 12–24 months out; constrained supply supports both.
Investment metrics
- 1% rule
- 1.33% ✓
- Cap rate
- 10.61%
- Cash-on-cash
- 15.40%
- DSCR
- 1.69
- GRM
- 6.3
CMA / ARV
- ARV (on-the-fly)
- $135,552
- Comps found
- 2
Show comp detail 2 sales within ~0.75 mi
| Address | Dist | Beds/Ba | Sqft | Sold | Price | $/sf | Match |
|---|---|---|---|---|---|---|---|
| 13905 Trinity Mountain Rd Unit 80 | 0.00mi | 3/2.0 | 1,412 (0%) | 1mo | $135,000 | $96 | 99 |
| 13905 Trinity Mountain Rd #25 | 0.00mi | 2/2.0 (-1) | 1,248 (-12%) | 14mo | $28,500 | $23 | 64 |
Match score weights: distance 35% · size 25% · config 20% · recency 20%. Top-matched comps best support the ARV.
Projected returns pro-forma
3.0% appreciation · 3.0% rent growth · sell at horizon
- IRR
- 22.0%
- Equity multiple
- 2.25×
- Total profit
- $44,391
- Equity at exit
- $57,105
- IRR
- 23.0%
- Equity multiple
- 4.30×
- Total profit
- $117,346
- Equity at exit
- $88,005
Cash invested: $35,560 (down + closing). Projections, not guarantees.
Landlord ↔ Tenant lean methodology
- Overall (STATE)
- 18 Strongly Tenant-Friendly
- State California
- 18 Strongly Tenant-Friendly · D+13
- County
- — inherits STATE
- City
- — inherits STATE
ZIP-level market 96033
- Active inventory
- 15
- Price-to-rent
- 6.3×
Monthly cashflow live
- Estimated rent
- $1,689 medium interval (Pro) →
- Mortgage (P&I)
- −$666
- Tax est. 1.5%
- −$159 /mo · $1,905/yr
- Insurance
- −$53
- HOA
- −$0
- Vacancy / Maint / Mgmt
- −$355
- Net cashflow
- $456
Break-even live
UW: 25.0% down · 7.5% · 30yr · 1.5% tax · 5.0% vac · 8.0% maint · 8.0% mgmt
Financing live
Cash to close
- Down payment
- $31,750
- Closing costs
- $3,810
- Reserves months
- —
- Total cash needed
- —
Loan-product check · same deal, 3 products live
Conventional
25% down · 7.5% · 30yr
- Down + closing
- —
- Monthly P&I
- —
- Monthly cashflow
- —
- DSCR
- —
- Eligible?
- —
Personal DTI + credit; lowest rate.
DSCR
20% down · 8.5% · 30yr
- Down + closing
- —
- Monthly P&I
- —
- Monthly cashflow
- —
- DSCR
- —
- Eligible?
- —
No personal income docs; deal must DSCR.
Hard money
10% down · 12.0% · 12mo
- Down + closing
- —
- Monthly P&I
- —
- Monthly cashflow
- —
- DSCR
- —
- Eligible?
- —
Short-term bridge; refi at stabilization.
Listing history 17 events
-
2026-06-19days on market $127,000 Active 38 DOM
-
2026-06-18days on market $127,000 Active 37 DOM
-
2026-06-17days on market $127,000 Active 36 DOM
-
2026-06-16days on market $127,000 Active 35 DOM
-
2026-06-15days on market $127,000 Active 34 DOM
-
2026-06-14days on market $127,000 Active 32 DOM
-
2026-06-13days on market $127,000 Active 31 DOM
-
2026-06-10days on market $127,000 Active 29 DOM
-
2026-06-09days on market $127,000 Active 28 DOM
-
2026-06-08days on market $127,000 Active 27 DOM
-
2026-06-07days on market $127,000 Active 26 DOM
-
2026-06-03days on market $127,000 Active 22 DOM
-
2026-06-02days on market $127,000 Active 21 DOM
-
2026-06-01days on market $127,000 Active 20 DOM
-
2026-05-31days on market $127,000 Active 19 DOM
-
2026-05-30days on market $127,000 Active 18 DOM
-
2026-05-12$127,000 Active
ⓘ Source: listings_history table (triggers on properties + properties_extension) + one-shot
backfill from property_details.listing_events for pre-trigger history.
Climate risk First Street
- Flood 5/10 Major FEMA zone X (unshaded) · 24% chance over 30 yrs
- Wildfire 5/10 Major
- Heat 8/10 Severe 8 d/yr ≥100°F today · 19 d/yr by 30 yrs out
- Wind 1/10 Low
- Air quality 10/10 Extreme 39 unhealthy d/yr today · 42 by 30 yrs out
Nearby sold comps map
Loading sold comps map…
Walkable amenities ~0.75 mi
Loading nearby amenities…
Taxation est. · year 1
- Rental income
- $20,264
- − Mortgage interest
- −$7,114
- − Property taxes
- −$1,905
- − Insurance
- −$635
- − Repairs & maintenance
- −$1,621
- − Management
- −$1,621
- − Depreciation
- −$3,695
- Taxable income
- $3,673
- Est. tax owed @ 24.0%
- −$882
- After-tax cash flow
- $4,595/yr
For passive investors: Depreciation is non-cash, so a rental often shows a tax loss while cash-flowing — sheltering income. Rental losses are passive: they offset passive income freely, and up to $25,000/yr can offset ordinary (W-2) income if you actively participate and your MAGI is under $100k (phasing out to $0 by $150k); unused losses carry forward. On sale, claimed depreciation is recaptured at up to 25%, and gains may owe capital-gains tax (a 1031 exchange can defer both). Figures are a year-1 estimate at your 24.0% rate — not tax advice; consult a CPA.
Condition & rehab AI · 12 photos
This manufactured home is in average condition with some clutter and minor repairs needed. Deep cleaning, painting, and landscaping improvements would significantly enhance its value.
Repairs flagged
- Minor Kitchen counters — Cluttered with items
- Minor Bathroom counters — Cluttered with items
Value-add opportunities
- Both Deep cleaning and decluttering — This would improve the home's appearance and make it more marketable
- Both Painting interior walls — Fresh paint can make the home feel more inviting and modern
- Both Landscaping and curb appeal improvements — A well-maintained exterior can enhance curb appeal and property value
Renovation cost estimate screening
| Repair item | Severity | Est. cost |
|---|---|---|
| Kitchen counters · Cluttered with items | Minor | $500–3,000 |
| Bathroom counters · Cluttered with items | Minor | $500–3,000 |
| Total estimated repair cost · 2 items | $1,000–6,000 |
Value-add ROI direction
- Both Deep cleaning and decluttering — This would improve the home's appearance and make it more marketable ↑
- Both Painting interior walls — Fresh paint can make the home feel more inviting and modern ↑
- Both Landscaping and curb appeal improvements — A well-maintained exterior can enhance curb appeal and property value ↑
ⓘ Cost ranges are severity-bucket heuristics (US national rule-of-thumb). Get contractor quotes + a written scope before underwriting a rehab budget.
Schools (NCES district)
- District
- Shasta Union High
- NCES district ID
- 0636600
- Math proficiency
- 41% ▲ 3.00%
- Reading proficiency
- 67% ▲ 9.00%
- Median HH income
- $50,080
- Composite
- 46.01/100
- National rank
- #2532
- State rank
- #122 of 517 in CA
Livability — French Gulch
- Score
- 55/100
- State rank
- #834
- US rank
- #23173
Category grades
Schools grade is shown separately in the Schools card above.
Census & demographics
- Census place
- French Gulch, CA
- Population (ZIP)
- 245
Population outlook (Shasta County) Hauer SSP2
- Today (2025)
- 179,231 people
- By 2030
- 176,953 · -1.3%
- By 2040
- 169,982 · -5.2%
- By 2050
- 162,547 · -9.3%
- By 2075
- 145,649 · -18.7%
- By 2100
- 123,025 · -31.4%
Race, ethnicity, and origin ACS 2023
- Neighborhood character
- Predominantly White (84%)
- Race & ethnicity
- White 84% Two or more races 10% Hispanic / Latino 7% Asian 6%
- Hispanic origin (detail)
- Mexican 5%
- Common ancestry
- Slovak 4% German 2% Lithuanian 2%
- Foreign-born
- 6% · China
- Languages at home
- 91% English-only · Chinese 6% Spanish 3%
Political lean MEDSL · Shasta
- 2024 margin
- Solid R (+36.5) · D 30.5% · R 67.0% · Other 2.5%
- 2008→2024 swing
- -10.7pp toward R · 2008: -25.8pp · 2024: -36.5pp
- All cycles
- 2024: R+36.5 2020: R+33.1 2016: R+37.4 2012: R+30.3 2008: R+25.8
Not yet ingested
- Civics
- —
Market trends
- HPI YoY
- —
- Current HPI
- —
- Rent YoY
- —
- Metro
- —
- State GDP YoY
- ▲ 3.21%
- F500 in state
- 116
Industry mix (Fortune 500 HQ in CA)
| Industry | F500 HQs | Revenue |
|---|---|---|
| Technology | 27 | $1,492B |
|
||
| Financial Services | 3 | $174B |
|
||
| Retail | 3 | $44B |
|
||
| Insurance | 3 | $26B |
|
||
| Media / Entertainment | 2 | $115B |
|
||
| Pharmaceuticals / Biotech | 2 | $62B |
|
||
Price history
1 event — show timeline
- 2026-05-12 Listed $127,000 SAOR
Cash-flow waterfall
monthlySold comps — $/sqft
last 12 mo · ≤1 miLoading sold comps…