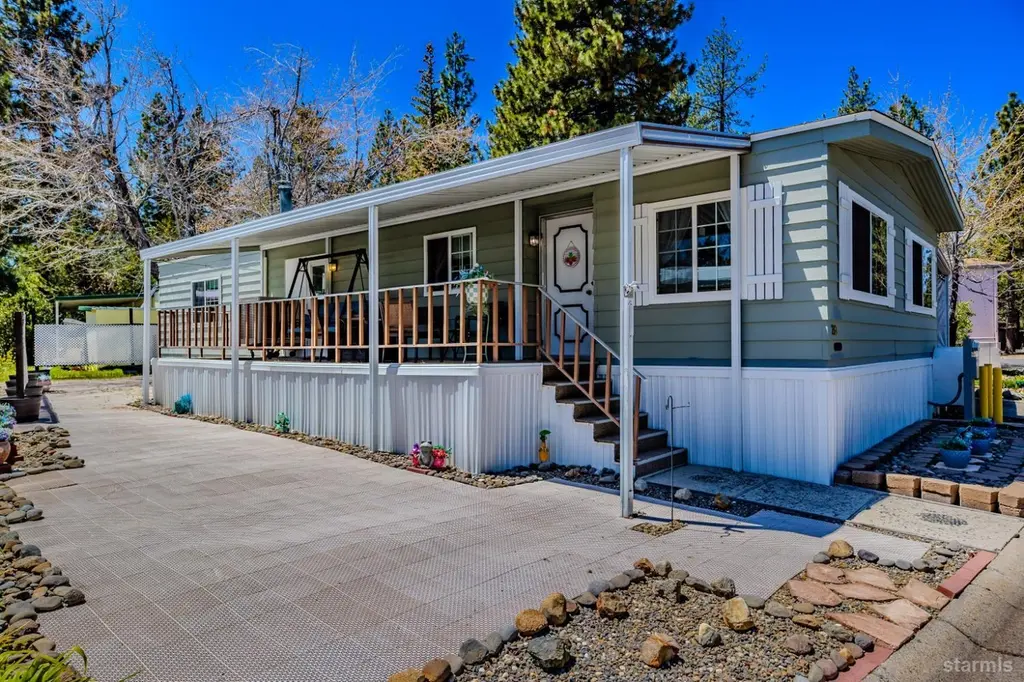
1080 Julie Ln #218 · South Lake Tahoe, CA
Flood risk 6/10 · Moderate
- FEMA flood zone
- X (unshaded)
- Chance of flooding over 30 yrs
- 0.73%
- Est. flood insurance / yr
- $507 – $1,088
Fire risk 5/10 · Moderate
- Est. fire insurance / yr
- $659 – $1,223
Heat risk 1/10 · Minimal
- Hot days now (above 85°F)
- 7 days/yr
- Hot days in 30 yrs
- 19 days/yr
Wind risk 1/10 · Minimal
- Chance of severe wind over 30 yrs
- —
Air-quality risk 7/10 · Major
- Unhealthy air days now
- 13 days/yr
- Unhealthy air days in 30 yrs
- 15 days/yr
Risk factors via First Street. Map © Google.
Why this score? — see what drove the C grade
The composite is a weighted blend of 9 inputs, each scored 0–100. Each bar is that input's sub-score; the figure is the points it added to the 100-point composite (weight × sub-score).
- Cash flow +20.8/30.0
- 1% rule +10.0/10.0
- ARV discount +9.4/15.0
- DSCR +6.6/10.0
- Schools +3.5/10.0
- Rent growth +3.4/5.0
- Livability +3.2/5.0
- Condition / age +2.5/5.0
- Appreciation +0.0/10.0
$179,000
🖨 Deal sheet 📄 Offer letter ✓ Due diligence
Listing remarks MLS
2 bedroom, 2 bath, carport with great location near shopping, restaurants, beaches, and nightlife. Park amenities include swimming pool, clubhouse (with full kitchen and dining facilities for large groups), billiards, ping pong, sauna, library area, laundry and mail room center. Space rent is currently $687 per month plus utilities. .. .check out the video attached too!
Key facts
- Covered front porch
- Formal dining room
- Brand new dishwasher
Tags
Property features AI
Finance
- Other: Covenants, conditions & restrictions available; Located near Lake Tahoe Blvd (directions available)
- Financial info: Monthly HOA fee of $850
- HOA & community: HOA membership required; HOA covers snow removal; Community amenities: pool, sauna, clubhouse, additional parking, park; HOA fee payable monthly
Exterior
- Parking: Covered carport for 2 cars; No garage
- Utilities: Electricity (underground utility); City water with water meter; City sewer; Natural gas water heater
- Home design: Mobile/modular construction; Post & pier foundation; Pitched composition shingle roof; Occupied by owner
- Construction: Mobile/Modular construction; Post & pier foundation; Pitched composition shingle roof
- Exterior features: Storage shed; Front and natural landscaping with trees; Front covered patio / porch; Front sprinklers
Interior
- Kitchen: Garbage disposal; Built-in refrigerator; Built-in dishwasher; Gas range; Double oven
- Bedrooms: Master bedroom with ensuite bathroom, double sinks, stall shower and shower/tub combo
- Flooring: Carpet; Vinyl
- Bathrooms: 2 full bathrooms
- Heating & cooling: Forced air heating; Natural gas
- Interior features: Granite and laminate countertops; Double-pane vinyl frame windows; Family room
- Laundry & utility: Dedicated laundry room
Neighborhood map
What this means for you Summary
Snapshot
- This is a 2-bed/2.0-bath manufactured listed at $179k.
Deal economics
- At list price, monthly cash flow is $247 ($3k/yr) — positive.
- The deal already cash-flows at list — no discount required.
- Meets the 1% rule at list price ($3k rent vs $179k).
- Recommended offer: $174k (3.0% below list) — sets the bar for market timing.
- Cap rate 7.9% vs local median 2.5% in South Lake Tahoe — top-decile yield for the area; either an underpriced asset or a hidden risk that comps aren't pricing in. Stress-test before assuming the spread holds.
Location & tenants
- Location reads 65/100 on livability (#371 in CA) — a middle-class / working-renter tenant base. Strengths: health & safety A+; Watch: schools D-, crime F, commute F.
- Lake Tahoe Unified (town): math 33% / reading 43% proficiency, ranked #786 of 1,400 in CA (top 56%) — families likely to look elsewhere, expect single-tenant / working-renter base with shorter leases.
- Market conditions: Rents rising (+3.6%/yr); 307 active listings in the ZIP; 11 comparable units currently listed for rent nearby; rentals lingering (median 44d on market — plan ~5-8 weeks vacancy on turnover, expect pricing pressure); 64% of comp listings sitting > 30 days — soft ceiling on asking rent; solid renter incomes; 437 units permitted in El Dorado County in 2024 (0 in 5+ unit buildings).
- This rent runs 35% of the median local income ($93k/yr) — at the standard rent-burdened threshold; future hikes will face affordability resistance.
Forward outlook
- Local home prices are declining (-3.0%/yr); year-one equity from $1k of loan paydown is wiped out by about $5k of value loss. Plan a longer hold.
- El Dorado County population projected to shrink 3% by 2050 — rents likely to lag national; underwrite the cash flow, not the appreciation.
Negotiation context
- It's been on market 36 days — a 3% lower offer ($174k) is reasonable based on typical stale-listing flexibility.
- 2 sale attempts since 8y ago with the ask held roughly flat each time — persistent listings suggest the price (not the market) is what's stuck; bring a comps-based counter.
- Current owner paid $95k; list at $179k implies a 88% gain — meaningful room to come down on a strong offer.
Risks & watch-outs
- Watch-outs: HOA is 31% of rent.
- Climate carrying-cost: major flood risk; moderate wildfire risk — expect insurance premiums to compound above CPI over the hold.
Questions for the listing agent
- It's been on market 36 days. Have you received any prior offers? Is the seller open to a 3% concession, seller financing, or rate buy-down credit?
- Built in 1977 — when were the roof, HVAC, electrical panel, plumbing, and water heater last replaced?
- What does the HOA fee cover, when was the last increase, and are there any pending special assessments or reserve-fund shortfalls?
- Is there a deadline driving the sale (1031 exchange, divorce, estate, relocation)? That informs how much negotiation room exists.
- Schools are D-rated, which usually means shorter tenancies and higher turnover. Who's the typical renter profile here, and what's been the actual vacancy rate?
- Crime grade is F in this area — have there been break-ins, vandalism, or insurance claims at this property in the last 3 years? What carrier currently insures it and at what premium?
- What's the average days-on-market for RENTAL listings here right now (not sales)? A rising rental-DOM trend means longer vacancies and softer asking-rent achievability than the comps imply.
- What's the recent tenant-quality profile in this submarket — average credit score on applications, eviction rate, late-payment / NSF rate, and stable-employment percentage? A property-management company in the area should have these aggregated.
- How much new for-sale + rental construction is in the pipeline within 1–3 miles? Heavy new supply typically softens prices + rents 12–24 months out; constrained supply supports both.
Investment metrics
- 1% rule
- 1.53% ✓
- Cap rate
- 7.95%
- Cash-on-cash
- 5.92%
- DSCR
- 1.26
- GRM
- 5.5
CMA / ARV
- ARV (median comp)
- $186,857
- List price
- $179,000
- Delta
- -4.20%
- Verdict
- FAIR
- Comps
- 20 within 1.0 mi
Show comp detail 11 sales within ~0.75 mi
| Address | Dist | Beds/Ba | Sqft | Sold | Price | $/sf | Match |
|---|---|---|---|---|---|---|---|
| 1080 Julie Ln #79 | 0.18mi | 3/2.0 (+1) | 1,344 (0%) | 6mo | $280,000 | $208 | 81 |
| 1080 Julie Ln #208 | 0.04mi | 3/2.0 (+1) | 1,305 (-3%) | 12mo | $162,000 | $124 | 78 |
| 1080 Julie Ln #193 | 0.10mi | 2/2.0 | 1,200 (-11%) | 8mo | $229,000 | $191 | 71 |
| 1080 Julie Ln #205 | 0.07mi | 3/2.0 (+1) | 1,400 (+4%) | 18mo | $189,000 | $135 | 70 |
| 1080 Julie Ln #259 | 0.10mi | 2/2.0 | 1,440 (+7%) | 21mo | $180,000 | $125 | 66 |
| 1080 Julie Ln #144 | 0.05mi | 2/2.0 | 1,152 (-14%) | 11mo | $255,000 | $221 | 64 |
| 1080 Julie Ln #207 | 0.05mi | 3/2.0 (+1) | 1,440 (+7%) | 24mo | $190,000 | $132 | 61 |
| 1080 Julie Ln #57 | 0.21mi | 3/2.0 (+1) | 1,188 (-12%) | 12mo | $150,000 | $126 | 56 |
| 1314 Melba Dr #8 | 0.62mi | 3/2.0 (+1) | 1,310 (-2%) | 8mo | $150,000 | $115 | 55 |
| 1080 Julie Ln #106 | 0.18mi | 2/2.0 | 1,152 (-14%) | 20mo | $245,000 | $213 | 51 |
| 1080 Julie Ln #58 | 0.21mi | 3/2.0 (+1) | 1,152 (-14%) | 17mo | $35,000 | $30 | 47 |
Match score weights: distance 35% · size 25% · config 20% · recency 20%. Top-matched comps best support the ARV.
Projected returns pro-forma
-3.0% appreciation · 3.56% rent growth · sell at horizon
- IRR
- -6.0%
- Equity multiple
- 0.78×
- Total profit
- $-11,260
- Equity at exit
- $26,689
- IRR
- 4.9%
- Equity multiple
- 1.37×
- Total profit
- $18,753
- Equity at exit
- $15,477
Cash invested: $50,120 (down + closing). Projections, not guarantees.
Landlord ↔ Tenant lean methodology
- Overall (STATE)
- 18 Strongly Tenant-Friendly
- State California
- 18 Strongly Tenant-Friendly · D+13
- County
- — inherits STATE
- City
- — inherits STATE
ZIP-level market 96150
- Rents YoY
- 3.6%
- Active inventory
- 307
- Price-to-rent
- 5.5×
Monthly cashflow live
- Estimated rent
- $2,736 high interval (Pro) →
- Mortgage (P&I)
- −$939
- Tax from tax record
- −$51 /mo · $615/yr
- Insurance
- −$75
- HOA
- −$850
- Vacancy / Maint / Mgmt
- −$575
- Net cashflow
- $247
Break-even live
UW: 25.0% down · 7.5% · 30yr · 1.5% tax · 5.0% vac · 8.0% maint · 8.0% mgmt
Financing live
Cash to close
- Down payment
- $44,750
- Closing costs
- $5,370
- Reserves months
- —
- Total cash needed
- —
Loan-product check · same deal, 3 products live
Conventional
25% down · 7.5% · 30yr
- Down + closing
- —
- Monthly P&I
- —
- Monthly cashflow
- —
- DSCR
- —
- Eligible?
- —
Personal DTI + credit; lowest rate.
DSCR
20% down · 8.5% · 30yr
- Down + closing
- —
- Monthly P&I
- —
- Monthly cashflow
- —
- DSCR
- —
- Eligible?
- —
No personal income docs; deal must DSCR.
Hard money
10% down · 12.0% · 12mo
- Down + closing
- —
- Monthly P&I
- —
- Monthly cashflow
- —
- DSCR
- —
- Eligible?
- —
Short-term bridge; refi at stabilization.
Rent comps 11 comps
| Address | Beds | Baths | Sqft | Rent | $/sqft | DOM | Units | Dist |
|---|---|---|---|---|---|---|---|---|
| 1242 Dedi Ave South Lake Tahoe, CA | 3.0 | 2.0 | 1480 | $3,100 | $2.09 | 43d | 1 | 0.25mi |
| 1860 Lake Tahoe Blvd South Lake Tahoe, CA | 3.0 | 1.0–2.0 | 728 | $1,636 | $2.25 | 1d | 1 | 0.28mi |
| 852 Clement St South Lake Tahoe, CA | 3.0 | 2.0 | 1654 | $2,900 | $1.75 | 20d | 1 | 0.63mi |
| 847 Clement St South Lake Tahoe, CA | 2.0 | 2.0 | 1066 | $2,100 | $1.97 | 14d | 1 | 0.66mi |
| 2013 7th St South Lake Tahoe, CA | 2.0 | 2.0 | 950 | $3,700 | $3.89 | 43d | 1 | 0.80mi |
| 2139 Helen Ave South Lake Tahoe, CA | 3.0 | 2.0 | 1391 | $3,500 | $2.52 | 43d | 1 | 0.81mi |
| 909 Secret Harbor Dr South Lake Tahoe, CA | 3.0 | 2.0 | 1500 | $2,950 | $1.97 | 43d | 1 | 0.94mi |
| 673 James Ave Unit 3 South Lake Tahoe, CA | 2.0 | 2.0 | 1060 | $2,200 | $2.08 | 43d | 1 | 1.14mi |
| 2309 Eloise Ave South Lake Tahoe, CA | 2.0 | 2.0 | 1225 | $3,000 | $2.45 | 43d | 1 | 1.24mi |
| 516 Emerald Bay Rd #231 South Lake Tahoe, CA | 2.0 | 1.0 | 912 | $1,950 | $2.14 | 1d | 1 | 1.30mi |
| 2319 California Ave South Lake Tahoe, CA | 3.0 | 2.0 | 1400 | $4,500 | $3.21 | 43d | 1 | 1.31mi |
HOA detail
- Monthly dues
- $850 · $10,200/yr
- Likely covers
- pool
Listing history 16 events
-
2026-06-18days on market $179,000 Active 36 DOM
-
2026-06-17days on market $179,000 Active 35 DOM
-
2026-06-16days on market $179,000 Active 34 DOM
-
2026-06-15days on market $179,000 Active 33 DOM
-
2026-06-13days on market $179,000 Active 31 DOM
-
2026-06-09days on market $179,000 Active 27 DOM
-
2026-06-08days on market $179,000 Active 26 DOM
-
2026-06-07days on market $179,000 Active 25 DOM
-
2026-06-03days on market $179,000 Active 21 DOM
-
2026-06-02days on market $179,000 Active 20 DOM
-
2026-06-01days on market $179,000 Active 19 DOM
-
2026-05-31days on market $179,000 Active 18 DOM
-
2026-05-12$179,000 Active 890-char remark
-
2018-09-07soldstatus $95,000 Sold 372-char remark
Show marketing remark (372 chars)
2 bedroom, 2 bath, carport with great location near shopping, restaurants, beaches, and nightlife. Park amenities include swimming pool, clubhouse (with full kitchen and dining facilities for large groups), billiards, ping pong, sauna, library area, laundry and mail room center. Space rent is currently $687 per month plus utilities. .. .check out the video attached too!
-
2018-07-06status Active Pending 372-char remark
Show marketing remark (372 chars)
2 bedroom, 2 bath, carport with great location near shopping, restaurants, beaches, and nightlife. Park amenities include swimming pool, clubhouse (with full kitchen and dining facilities for large groups), billiards, ping pong, sauna, library area, laundry and mail room center. Space rent is currently $687 per month plus utilities. .. .check out the video attached too!
-
2018-07-05$95,000 Active 372-char remark
Show marketing remark (372 chars)
2 bedroom, 2 bath, carport with great location near shopping, restaurants, beaches, and nightlife. Park amenities include swimming pool, clubhouse (with full kitchen and dining facilities for large groups), billiards, ping pong, sauna, library area, laundry and mail room center. Space rent is currently $687 per month plus utilities. .. .check out the video attached too!
ⓘ Source: listings_history table (triggers on properties + properties_extension) + one-shot
backfill from property_details.listing_events for pre-trigger history.
Tax reassessment forecast CA · Resets to sale price
- Current annual tax
- $615 · $51/mo
- Projected year-2 tax
- $1,360 · $113/mo
- Expected delta
- +$746/yr (+$62/mo · 121.3%)
ⓘ Screening estimate from a state-policy table — verify with the county assessor before closing.
Climate risk First Street
- Flood 6/10 Major FEMA zone X (unshaded) · 73% chance over 30 yrs
- Wildfire 5/10 Major
- Heat 1/10 Low 7 d/yr ≥85°F today · 19 d/yr by 30 yrs out
- Wind 1/10 Low
- Air quality 7/10 Severe 13 unhealthy d/yr today · 15 by 30 yrs out
Nearby sold comps map
Loading sold comps map…
Walkable amenities ~0.75 mi
Loading nearby amenities…
Taxation est. · year 1
- Rental income
- $32,835
- − Mortgage interest
- −$10,027
- − Property taxes
- −$615
- − Insurance
- −$895
- − Repairs & maintenance
- −$2,627
- − Management
- −$2,627
- − HOA
- −$10,200
- − Depreciation
- −$5,207
- Taxable income
- $637
- Est. tax owed @ 24.0%
- −$153
- After-tax cash flow
- $2,812/yr
For passive investors: Depreciation is non-cash, so a rental often shows a tax loss while cash-flowing — sheltering income. Rental losses are passive: they offset passive income freely, and up to $25,000/yr can offset ordinary (W-2) income if you actively participate and your MAGI is under $100k (phasing out to $0 by $150k); unused losses carry forward. On sale, claimed depreciation is recaptured at up to 25%, and gains may owe capital-gains tax (a 1031 exchange can defer both). Figures are a year-1 estimate at your 24.0% rate — not tax advice; consult a CPA.
Schools (NCES district)
- District
- Lake Tahoe Unified
- NCES district ID
- 0620640
- Math proficiency
- 33% ▼ -1.00%
- Reading proficiency
- 43% ▲ 1.00%
- Median HH income
- $49,114
- Composite
- 35.24/100
- National rank
- #9844
- State rank
- #786 of 1400 in CA
Livability — South Lake Tahoe
- Score
- 65/100
- State rank
- #371
- US rank
- #12667
Category grades
Schools grade is shown separately in the Schools card above.
Census & demographics
- Census place
- South Lake Tahoe, CA
- County
- El Dorado County · 144,198 people
- City population
- 29,646
- Metro
- Sacramento-Roseville-Folsom, CA
- Population (ZIP)
- 29,646
- Household income
- $92,517
- Rent vs Own
- Severe rent burden
- 1109.0
Population outlook (El Dorado County) Hauer SSP2
- Today (2025)
- 191,666 people
- By 2030
- 193,662 · +1.0%
- By 2040
- 192,583 · +0.5%
- By 2050
- 185,904 · -3.0%
- By 2075
- 169,543 · -11.5%
- By 2100
- 139,623 · -27.2%
Race, ethnicity, and origin ACS 2023
- Neighborhood character
- Majority White (64%)
- Race & ethnicity
- White 64% Hispanic / Latino 24% Two or more races 11% Asian 5%
- Hispanic origin (detail)
- Mexican 19%
- Common ancestry
- Lithuanian 3% Slovak 3% Romanian 2%
- Foreign-born
- 17% · Canada, China, South Korea
- Languages at home
- 76% English-only · Spanish 17% Tagalog/Filipino 2% Other Asian/Pacific 1%
Political lean MEDSL · El Dorado
- 2024 margin
- R (+12.0) · D 42.6% · R 54.6% · Other 2.8%
- 2008→2024 swing
- -1.5pp toward R · 2008: -10.5pp · 2024: -12.0pp
- All cycles
- 2024: R+12.0 2020: R+8.8 2016: R+13.9 2012: R+18.2 2008: R+10.5
Not yet ingested
- Civics
- —
Market trends
- HPI YoY
- ▼ -571.55%
- Current HPI
- 316.6411
- Rent YoY
- ▲ 3.56%
- Metro
- Sacramento-Roseville-Folsom, CA
- State GDP YoY
- ▲ 3.21%
- F500 in state
- 116
Industry mix (Fortune 500 HQ in CA)
| Industry | F500 HQs | Revenue |
|---|---|---|
| Technology | 27 | $1,492B |
|
||
| Financial Services | 3 | $174B |
|
||
| Retail | 3 | $44B |
|
||
| Insurance | 3 | $26B |
|
||
| Media / Entertainment | 2 | $115B |
|
||
| Pharmaceuticals / Biotech | 2 | $62B |
|
||
Price history
+88.4% since first listed4 events — show timeline
- 2026-05-12 Listed $179,000 STARMLS
- 2018-09-07 Sold (MLS) $95,000 STARMLS
- 2018-07-06 Pending — STARMLS
- 2018-07-05 Listed $95,000 STARMLS
Property tax history
+13.9%/yrLatest (2023): $615 · +120.9% YoY. Source: county tax records.
Cash-flow waterfall
monthlySold comps — $/sqft
last 12 mo · ≤1 miLoading sold comps…