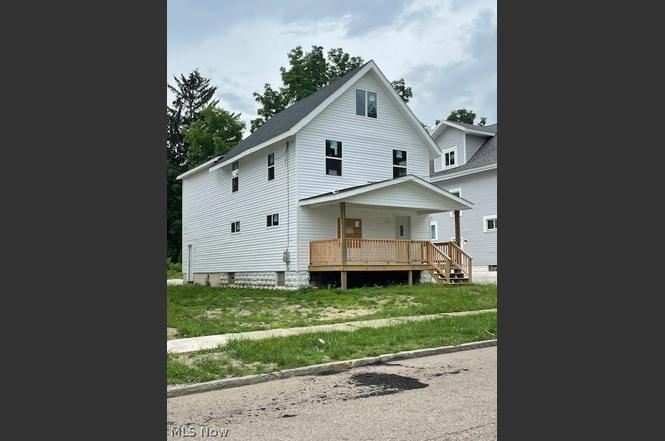
672 Moon St · Akron, OH
Flood risk 1/10 · Minimal
- FEMA flood zone
- X (unshaded)
- Chance of flooding over 30 yrs
- 0.0%
- Est. flood insurance / yr
- $473 – $860
Fire risk 1/10 · Minimal
- Est. fire insurance / yr
- $713 – $1,323
Heat risk 3/10 · Minor
- Hot days now (above 97°F)
- 7 days/yr
- Hot days in 30 yrs
- 17 days/yr
Wind risk 1/10 · Minimal
- Chance of severe wind over 30 yrs
- —
Air-quality risk 3/10 · Minor
- Unhealthy air days now
- 2 days/yr
- Unhealthy air days in 30 yrs
- 4 days/yr
Risk factors via First Street. Map © Google.
Why this score? — see what drove the D- grade
The composite is a weighted blend of 9 inputs, each scored 0–100. Each bar is that input's sub-score; the figure is the points it added to the 100-point composite (weight × sub-score).
- Cash flow +10.5/30.0
- ARV discount +7.5/15.0
- Appreciation +4.9/10.0
- Livability +4.0/5.0
- DSCR +3.0/10.0
- Rent growth +2.5/5.0
- Condition / age +2.5/5.0
- 1% rule +2.3/10.0
- Schools +2.1/10.0
$185,000
🖨 Deal sheet 📄 Offer letter ✓ Due diligence
Listing remarks
Investor Package! 672 & 678 Moon St offered together for $185,000. New siding, windows, and rough heating have already been completed. Potential for up to 5-bedroom layouts with finished third floors meeting current building standards and opportunity to add stair access. Eligible for a 15-Year Tax Abatement upon completion. Ideal for rental income, BRRRR strategy, or fix-and-flip investors seeking strong upside potential. Investor's dream with multiple exit strategies and significant value-add potential.
Key facts
- New siding
- New windows
- 3,057 sq ft lot
Tags
Property features AI
Finance
- Financial info: Annual tax noted (2025)
Exterior
- Parking: Built-in parking; 1-car garage
- Utilities: Public water; Public sewer
- Home design: 2-story home; Above-grade finished area reported as 2,300 (owner provided)
- Construction: Vinyl siding; Asphalt/fiberglass roof
- Exterior features: Small parcel (approximately 0.07 acres)
Interior
- Bedrooms: Total rooms: 8
- Bathrooms: 2 full bathrooms
- Interior features: Unfinished basement
Neighborhood map
What this means for you Summary
Snapshot
- This is a 3-bed/1.0-bath single-family listed at $185k.
Deal economics
- At list price, monthly cash flow is $-96 ($-1k/yr) — negative.
- To cash-flow at today's rent, offer at most $168k (9.2% below list).
- To meet the 1% rule (rent ≥ 1% of price), the offer needs to be $135k (27.1% below list).
- Recommended offer: $135k (27.1% below list) — sets the bar for 1% rule.
Location & tenants
- Location reads 81/100 on livability (#104 in OH, #1,591 nationally) — a professional / high-income tenant draw. Strengths: amenities A+, commute A+, cost of living A+; Watch: crime F, employment F.
- Akron City (urban): math 22% / reading 30% proficiency, ranked #602 of 656 in OH (top 92%) — low school quality limits family demand, transient renter base, plan for 1-2y turnover; 66% free/reduced lunch — lower-income household profile, screen leases tightly.
- Market conditions: 42 active listings in the ZIP; 31 comparable units currently listed for rent nearby; rentals at typical pace (median 23d on market — plan ~3-4 weeks tenant-placement turnaround); 45% of comp listings sitting > 30 days — soft ceiling on asking rent; lower-income renter base — watch delinquency; 1,114 units permitted in Summit County in 2024 (397 in 5+ unit buildings).
- At $1,350/mo this rent would consume 58% of the median local household income ($28k/yr) (locally 787% of renters already pay >50% of income on rent) — very limited rent-growth headroom before tenants either downsize or default.
Forward outlook
- In year one you build about $916 of equity ($1k loan paydown + $-363 appreciation (-0.2% local appreciation)).
- Summit County population projected to shrink 6% by 2050 — rents likely to lag national; underwrite the cash flow, not the appreciation.
Negotiation context
- Only 3 days on market — expect competitive offers; lowballing is unlikely to land.
- 2 sale attempts since 3y ago with the ask held roughly flat each time — persistent listings suggest the price (not the market) is what's stuck; bring a comps-based counter.
Risks & watch-outs
- Watch-outs: built in 1910 — expect roof / HVAC / electrical / plumbing capex.
Questions for the listing agent
- What do current leases actually rent for vs. the listed asking? Can we see a recent rent roll and the last 12 months of T-12 income?
- Built in 1910 — when were the roof, HVAC, electrical panel, plumbing, and water heater last replaced?
- Is there a deadline driving the sale (1031 exchange, divorce, estate, relocation)? That informs how much negotiation room exists.
- Crime grade is F in this area — have there been break-ins, vandalism, or insurance claims at this property in the last 3 years? What carrier currently insures it and at what premium?
- The area grade is low — what's the realistic commute time and amenity access for the typical tenant pool here? Any planned neighborhood developments (good or bad) we should know about?
- What's the average days-on-market for RENTAL listings here right now (not sales)? A rising rental-DOM trend means longer vacancies and softer asking-rent achievability than the comps imply.
- What's the recent tenant-quality profile in this submarket — average credit score on applications, eviction rate, late-payment / NSF rate, and stable-employment percentage? A property-management company in the area should have these aggregated.
- How much new for-sale + rental construction is in the pipeline within 1–3 miles? Heavy new supply typically softens prices + rents 12–24 months out; constrained supply supports both.
Investment metrics
- 1% rule
- 0.73% ✗
- Cap rate
- 5.67%
- Cash-on-cash
- -2.22%
- DSCR
- 0.90
- GRM
- 11.4
CMA / ARV
- ARV (on-the-fly)
- $105,618
- Comps found
- 12
Show comp detail 12 sales within ~0.75 mi
| Address | Dist | Beds/Ba | Sqft | Sold | Price | $/sf | Match |
|---|---|---|---|---|---|---|---|
| 727 East Ave | 0.35mi | 3/1.0 | 1,761 (-3%) | 10mo | $85,000 | $48 | 70 |
| 893 Raymond St | 0.37mi | 3/2.0 | 1,676 (-8%) | 9mo | $100,000 | $60 | 58 |
| 957 Mercer Ave | 0.69mi | 3/1.0 | 1,704 (-6%) | 3mo | $112,500 | $66 | 55 |
| 975 Raymond St | 0.51mi | 4/1.0 (+1) | 1,648 (-10%) | 2mo | $80,000 | $49 | 54 |
| 614 East Ave | 0.55mi | 4/3.0 (+1) | 1,767 (-3%) | 4mo | $103,000 | $58 | 54 |
| 568 Auld Farm Cir | 0.53mi | 3/2.5 | 1,664 (-9%) | 5mo | $227,000 | $136 | 51 |
| 1206 Diagonal Rd | 0.66mi | 4/2.0 (+1) | 1,721 (-6%) | 4mo | $83,000 | $48 | 48 |
| 582 Auld Farm Cir | 0.51mi | 3/2.5 | 1,664 (-9%) | 10mo | $235,000 | $141 | 48 |
| 586 Auld Farm Cir | 0.50mi | 3/2.5 | 1,680 (-8%) | 14mo | $267,000 | $159 | 46 |
| 1001 Celina Ave | 0.54mi | 3/1.5 | 1,601 (-12%) | 8mo | $52,000 | $32 | 46 |
| 686 East Ave | 0.43mi | 4/2.0 (+1) | 2,032 (+12%) | 8mo | $95,000 | $47 | 45 |
| 699 Noah Ave | 0.61mi | 3/1.0 | 1,553 (-15%) | 15mo | $84,000 | $54 | 35 |
Match score weights: distance 35% · size 25% · config 20% · recency 20%. Top-matched comps best support the ARV.
Projected returns pro-forma
-0.2% appreciation · 3.0% rent growth · sell at horizon
- IRR
- -5.5%
- Equity multiple
- 0.74×
- Total profit
- $-13,279
- Equity at exit
- $51,909
- IRR
- 0.5%
- Equity multiple
- 1.05×
- Total profit
- $2,721
- Equity at exit
- $60,970
Cash invested: $51,800 (down + closing). Projections, not guarantees.
Landlord ↔ Tenant lean methodology
- Overall (STATE)
- 73 Landlord-Friendly
- State Ohio
- 73 Landlord-Friendly · R+6
- County
- — inherits STATE
- City
- — inherits STATE
ZIP-level market 44307
- Home prices YoY
- -0.2%
- Active inventory
- 42
- Price-to-rent
- 11.4×
Monthly cashflow live
- Estimated rent
- $1,350 high interval (Pro) →
- Mortgage (P&I)
- −$970
- Tax from tax record
- −$115 /mo · $1,379/yr
- Insurance
- −$77
- HOA
- −$0
- Vacancy / Maint / Mgmt
- −$283
- Net cashflow
- $-96
Break-even live
UW: 25.0% down · 7.5% · 30yr · 1.5% tax · 5.0% vac · 8.0% maint · 8.0% mgmt
Financing live
Cash to close
- Down payment
- $46,250
- Closing costs
- $5,550
- Reserves months
- —
- Total cash needed
- —
Loan-product check · same deal, 3 products live
Conventional
25% down · 7.5% · 30yr
- Down + closing
- —
- Monthly P&I
- —
- Monthly cashflow
- —
- DSCR
- —
- Eligible?
- —
Personal DTI + credit; lowest rate.
DSCR
20% down · 8.5% · 30yr
- Down + closing
- —
- Monthly P&I
- —
- Monthly cashflow
- —
- DSCR
- —
- Eligible?
- —
No personal income docs; deal must DSCR.
Hard money
10% down · 12.0% · 12mo
- Down + closing
- —
- Monthly P&I
- —
- Monthly cashflow
- —
- DSCR
- —
- Eligible?
- —
Short-term bridge; refi at stabilization.
Rent comps 31 comps
| Address | Beds | Baths | Sqft | Rent | $/sqft | DOM | Units | Dist |
|---|---|---|---|---|---|---|---|---|
| 686 East Ave Akron, OH | 4.0 | 2.0 | 2032 | $1,700 | $0.84 | 43d | 1 | 0.43mi |
| 844 Lawton St Akron, OH | 4.0 | 2.0 | 1240 | $1,175 | $0.95 | 43d | 1 | 0.50mi |
| 991 Diana Ave Akron, OH | 3.0 | 2.0 | 1264 | $1,325 | $1.05 | 43d | 1 | 0.50mi |
| 677 Crossings Ln Akron, OH | 3.0 | 2.5 | 1440 | $1,950 | $1.35 | 23d | 1 | 0.58mi |
| 931 Trimble Dr Akron, OH | 2.0 | 1.5 | 1448 | $1,495 | $1.03 | 23d | 1 | 0.66mi |
| 575 Noble Ave Akron, OH | 3.0 | 1.0 | 1300 | $1,350 | $1.04 | 14d | 1 | 0.70mi |
| 783 Boulevard St Akron, OH | 4.0 | 1.0 | 1440 | $999 | $0.69 | 23d | 1 | 0.78mi |
| 1161 La Croix Ave Akron, OH | 3.0 | 1.0 | 1452 | $1,200 | $0.83 | 23d | 1 | 0.82mi |
| 1171 La Croix Ave Unit 2 Akron, OH | 2.0 | 1.0 | 1267 | $975 | $0.77 | 43d | 1 | 0.83mi |
| 637 Storer Ave Akron, OH | 3.0 | 1.5 | 1322 | $1,250 | $0.95 | 14d | 1 | 0.96mi |
| 378 Wildwood Ave Akron, OH | 4.0 | 1.0 | 1544 | $1,200 | $0.78 | 43d | 1 | 0.96mi |
| 202 Westwood Ave Akron, OH | 3.0 | 1.0 | 1344 | $1,250 | $0.93 | 14d | 1 | 1.03mi |
| 1090 Hartford Ave Akron, OH | 4.0 | 1.0 | 1328 | $1,125 | $0.85 | 43d | 1 | 1.04mi |
| 918 Bye St Akron, OH | 3.0 | 1.0 | 1248 | $1,200 | $0.96 | 43d | 1 | 1.06mi |
| 321 Grace Ave Akron, OH | 3.0 | 2.0 | 1484 | $1,175 | $0.79 | 14d | 1 | 1.07mi |
| 724 Crosby St Unit 1 Akron, OH | 2.0 | 1.0 | 1582 | $995 | $0.63 | 43d | 1 | 1.16mi |
| 724 Crosby St Akron, OH | 2.0 | 1.0 | 1582 | $995 | $0.63 | 23d | 1 | 1.16mi |
| 295 Noble Ave Akron, OH | 3.0 | 2.5 | 1488 | $1,600 | $1.08 | 43d | 1 | 1.16mi |
| 401 S Main St Akron, OH | 4.0 | 1.0–4.0 | 814 | $1,534 | $1.88 | 14d | 54 | 1.17mi |
| 713 Crosby St Unit 1496092P Akron, OH | 3.0 | 2.0 | 1840 | $5,078 | $2.76 | 21d | 1 | 1.19mi |
| 22 E Exchange St Apt 310 Akron, OH | 3.0 | 3.0 | 1496 | $1,962 | $1.31 | 43d | 1 | 1.22mi |
| 91 Westwood Ave Akron, OH | 3.0 | 1.0 | 1631 | $1,450 | $0.89 | 14d | 1 | 1.22mi |
| 311 Crestwood Ave Akron, OH | 4.0 | 2.0 | 1800 | $1,395 | $0.78 | 43d | 1 | 1.28mi |
| 53 S Balch St Unit 55 Akron, OH | 2.0 | 1.0 | 1500 | $850 | $0.57 | 14d | 1 | 1.29mi |
| 55 S Balch St Unit A Akron, OH | 2.0 | 1.0 | 1500 | $800 | $0.53 | 23d | 1 | 1.29mi |
| 1127 Victory St Unit 1129 Akron, OH | 3.0 | 1.0 | 1368 | $950 | $0.69 | 43d | 1 | 1.30mi |
| 760 Lakewood Blvd Akron, OH | 3.0 | 2.0 | 1398 | $1,150 | $0.82 | 23d | 1 | 1.34mi |
| 601 Glendora Ave Akron, OH | 3.0 | 1.0 | 1310 | $1,200 | $0.92 | 43d | 1 | 1.35mi |
| 788 Saxon Ave Akron, OH | 4.0 | 1.0 | 2280 | $1,731 | $0.76 | 23d | 1 | 1.41mi |
| 156 S Main St Akron, OH | 2.0–3.0 | 2.0 | 1197 | $2,985 | $2.49 | 23d | 4 | 1.43mi |
| 527 Brady Ave Akron, OH | 3.0 | 1.5 | 1416 | $1,395 | $0.99 | 43d | 1 | 1.45mi |
Listing history 4 events
-
2026-06-18days on market $185,000 Active 3 DOM
-
2026-06-17days on market $185,000 Active 2 DOM
-
2026-06-15remarks 511-char remark
-
2026-06-15$185,000 Active 1 DOM
ⓘ Source: listings_history table (triggers on properties + properties_extension) + one-shot
backfill from property_details.listing_events for pre-trigger history.
Tax reassessment forecast OH · Partial reset (capped growth)
- Current annual tax
- $1,379 · $115/mo
- Projected year-2 tax
- $2,132 · $178/mo
- Expected delta
- +$754/yr (+$63/mo · 54.7%)
ⓘ Screening estimate from a state-policy table — verify with the county assessor before closing.
Climate risk First Street
- Flood 1/10 Low FEMA zone X (unshaded) · 0% chance over 30 yrs
- Wildfire 1/10 Low
- Heat 3/10 Moderate 7 d/yr ≥97°F today · 17 d/yr by 30 yrs out
- Wind 1/10 Low
- Air quality 3/10 Moderate 2 unhealthy d/yr today · 4 by 30 yrs out
Nearby sold comps map
Loading sold comps map…
Walkable amenities ~0.75 mi
Loading nearby amenities…
Taxation est. · year 1
- Rental income
- $16,194
- − Mortgage interest
- −$10,363
- − Property taxes
- −$1,379
- − Insurance
- −$925
- − Repairs & maintenance
- −$1,296
- − Management
- −$1,296
- − Depreciation
- −$5,382
- Taxable loss
- −$4,445
- Est. tax savings @ 24.0%
- +$1,067
- After-tax cash flow
- $-85/yr
For passive investors: Depreciation is non-cash, so a rental often shows a tax loss while cash-flowing — sheltering income. Rental losses are passive: they offset passive income freely, and up to $25,000/yr can offset ordinary (W-2) income if you actively participate and your MAGI is under $100k (phasing out to $0 by $150k); unused losses carry forward. On sale, claimed depreciation is recaptured at up to 25%, and gains may owe capital-gains tax (a 1031 exchange can defer both). Figures are a year-1 estimate at your 24.0% rate — not tax advice; consult a CPA.
Schools (NCES district)
- District
- Akron City
- NCES district ID
- 3904348
- Math proficiency
- 22% ▼ -17.00%
- Reading proficiency
- 30% ▼ -12.00%
- Median HH income
- $33,811
- Composite
- 21.31/100
- National rank
- #8383
- State rank
- #602 of 656 in OH
Livability — Akron
- Score
- 81/100
- State rank
- #104
- US rank
- #1591
Category grades
Schools grade is shown separately in the Schools card above.
Census & demographics
- Census place
- Akron, OH
- County
- Summit County · 440,783 people
- City population
- 174,375
- Metro
- Akron, OH
- Population (ZIP)
- 6,653
- Household income
- $27,697
- Rent vs Own
- Severe rent burden
- 787.0
Population outlook (Summit County) Hauer SSP2
- Today (2025)
- 546,583 people
- By 2030
- 544,028 · -0.5%
- By 2040
- 531,363 · -2.8%
- By 2050
- 514,923 · -5.8%
- By 2075
- 481,765 · -11.9%
- By 2100
- 432,265 · -20.9%
Race, ethnicity, and origin ACS 2023
- Neighborhood character
- Predominantly Black (73%)
- Race & ethnicity
- Black 73% White 17% Two or more races 5% Hispanic / Latino 5%
- Common ancestry
- Slovak 1% Romanian 1% Iranian 1%
- Foreign-born
- 2% · Canada
- Languages at home
- 98% English-only · Spanish 2% French/Haitian/Cajun 1%
Political lean MEDSL · Summit
- 2024 margin
- Lean D (+7.0) · D 53.0% · R 46.0%
- 2008→2024 swing
- -9.6pp toward R · 2008: 16.6pp · 2024: 7.0pp
- All cycles
- 2024: D+7.0 2020: D+9.6 2016: D+8.2 2012: D+14.8 2008: D+16.6
Not yet ingested
- Civics
- —
Market trends
- HPI YoY
- ▼ -0.20%
- Current HPI
- 81.3728
- Rent YoY
- —
- Metro
- Akron, OH
- State GDP YoY
- ▲ 1.98%
- F500 in state
- 48
Industry mix (Fortune 500 HQ in OH)
| Industry | F500 HQs | Revenue |
|---|---|---|
| Insurance | 3 | $145B |
|
||
| Industrial Machinery | 3 | $49B |
|
||
| Financial Services | 3 | $24B |
|
||
| Consumer Goods | 2 | $93B |
|
||
| Aerospace / Defense | 2 | $47B |
|
||
| Utilities | 2 | $33B |
|
||
Price history
-15.5% since first listed5 events — show timeline
- 2026-06-13 Listed $185,000 MLSNOW
- 2024-03-18 Listing Removed — MLSNOW
- 2023-09-16 Price Changed $95,000 MLSNOW
- 2023-09-07 Price Changed $120,000 MLSNOW
- 2023-04-11 Listed $219,000 MLSNOW
Property tax history
+5.5%/yrLatest (2025): $1,379 · +172.2% YoY. Source: county tax records.
Cash-flow waterfall
monthlySold comps — $/sqft
last 12 mo · ≤1 miLoading sold comps…