 🌊 Lakefront
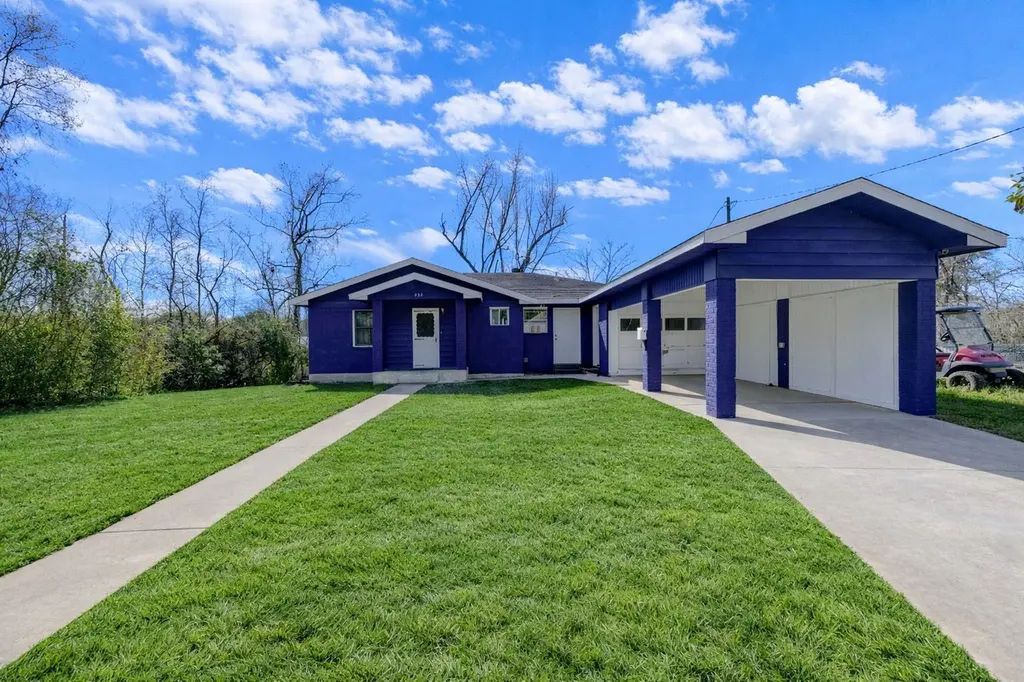
232 Hideaway Ln · Goodrich, TX
Flood risk 9/10 · Severe
- FEMA flood zone
- A
- Chance of flooding over 30 yrs
- 0.99%
- Est. flood insurance / yr
- $1,009 – $1,996
Fire risk 4/10 · Minor
- Est. fire insurance / yr
- $1,222 – $2,270
Heat risk 8/10 · Major
- Hot days now (above 112°F)
- 7 days/yr
- Hot days in 30 yrs
- 24 days/yr
Wind risk 8/10 · Major
- Chance of severe wind over 30 yrs
- 99.0%
Air-quality risk 1/10 · Minimal
- Unhealthy air days now
- 0 days/yr
- Unhealthy air days in 30 yrs
- 0 days/yr
Risk factors via First Street. Map © Google.
Why this score? — see what drove the D+ grade
The composite is a weighted blend of 9 inputs, each scored 0–100. Each bar is that input's sub-score; the figure is the points it added to the 100-point composite (weight × sub-score).
- ARV discount +15.0/15.0
- Cash flow +10.3/30.0
- Appreciation +5.0/10.0
- Schools +3.4/10.0
- 1% rule +3.3/10.0
- DSCR +3.0/10.0
- Livability +3.0/5.0
- Rent growth +2.5/5.0
- Condition / age +2.5/5.0
$149,000
🖨 Deal sheet (PDF) 📄 Offer letter ✓ Due diligence
Listing remarks
Welcome to this inviting home with a spacious open-concept living and dining area designed to make the most of everyday living and entertaining. The kitchen offers convenient bar seating and flows seamlessly into the main living space, creating a comfortable and connected layout. The large primary bedroom features an ensuite bath and a walk-in closet with built-in storage, while two additional bedrooms provide flexibility for guests, work-from-home needs, or hobbies. Step outside to a generous deck, partially covered and extending right to the river behind the home—an ideal spot to relax, entertain, or enjoy peaceful water views. Nestled in the quiet Goodrich area, this home offers a
Key facts
- 7,949 sq ft lot
- 2 parking spots
- Built 1967
Property features AI
Finance
- Other: Seller disclosure available
- Financial info: Lease not considered
- HOA & community: Holiday Lake Estates Civic Club; Annual association fee of $180
Exterior
- Parking: Attached carport; Carport with 2 spaces
- Security: No security details provided
- Utilities: Public water; Public sewer
- Home design: Residential property; Full ownership; Slab foundation; Built in 1967; Composition roof
- Construction: Built in 1967; Slab foundation; Composition roof; Construction material details not provided
- Exterior features: Private yard; Fenced backyard; Property backs to greenbelt/park; Located on a cul-de-sac in a subdivision
Interior
- Kitchen: Dishwasher; Disposal; Microwave; Trash compactor
- Bedrooms: Three bedrooms total; Primary bedroom on the first floor (approx. 15 x 14); Second bedroom on the first floor (approx. 12 x 10); Third bedroom on the first floor (approx. 11 x 11)
- Flooring: Tile flooring
- Bathrooms: Two full bathrooms
- Heating & cooling: Central heating (electric); Central air conditioning (electric)
- Interior features: Breakfast bar; Kitchen and family room combined; Tub with shower; Window treatments; Ceiling fans; Combined living and dining area
- Laundry & utility: No laundry details provided
Neighborhood map
What this means for you Summary
Snapshot
- This is a 3-bed/2.0-bath single-family listed at $149k.
Deal economics
- At list price, monthly cash flow is $-206 ($-2k/yr) — negative.
- To cash-flow at today's rent, offer at most $113k (24.5% below list).
- To meet the 1% rule (rent ≥ 1% of price), the offer needs to be $124k (16.7% below list).
- Recommended offer: $113k (24.5% below list) — sets the bar for cash-flow.
- Cap rate 5.6% vs local median 3.8% in Goodrich — top-decile yield for the area; either an underpriced asset or a hidden risk that comps aren't pricing in. Stress-test before assuming the spread holds.
Location & tenants
- Location reads 60/100 on livability (#1,053 in TX) — a middle-class / working-renter tenant base. Strengths: cost of living A+, housing A+; Watch: employment C-, crime F, amenities F.
- Goodrich ISD (rural): math 45% / reading 30% proficiency, ranked #849 of 1,141 in TX (top 74%) — families likely to look elsewhere, expect single-tenant / working-renter base with shorter leases; 74% free/reduced lunch — lower-income household profile, screen leases tightly.
- Zoned schools: Goodrich El (math 34% / reading 24%, grade F, #2,525 of 4,322 statewide, top 62%, 140 students, 85% FRL); Goodrich Middle (math 34% / reading 34%, grade F, #858 of 1,662 statewide, top 54%, 48 students, 79% FRL); Goodrich H S (math 50% / reading 30%, grade F, #813 of 1,632 statewide, top 50%, 74 students, 86% FRL).
- Market conditions: 34 active listings in the ZIP; 769 units permitted in Polk County in 2024 (0 in 5+ unit buildings).
Forward outlook
- In year one you build about $6k of equity ($1k loan paydown + $4k appreciation (3.0% local appreciation)).
- Polk County population projected at +16% by 2050 — long-run rental-demand tailwind backs the buy-and-hold thesis.
- By year 7, paydown + projected appreciation supports a ~$35k cash-out refi (75% LTV) — recoverable capital for the next deal without selling this one.
Negotiation context
- It's been on market 44 days — a 3% lower offer ($145k) is reasonable based on typical stale-listing flexibility.
- 8 sale attempts since 7y ago with the ask held roughly flat each time — persistent listings suggest the price (not the market) is what's stuck; bring a comps-based counter.
Risks & watch-outs
- Watch-outs: flood insurance adds $125/mo.
- Climate carrying-cost: in FEMA flood zone A (mandatory federal flood insurance); severe wind risk, 99% chance of damaging wind over 30y; extreme-heat days projected 7→24/yr by 2055 (HVAC capex compounding) — expect insurance premiums to compound above CPI over the hold.
Questions for the listing agent
- What do current leases actually rent for vs. the listed asking? Can we see a recent rent roll and the last 12 months of T-12 income?
- It's been on market 44 days. Have you received any prior offers? Is the seller open to a 24% concession, seller financing, or rate buy-down credit?
- Built in 1967 — when were the roof, HVAC, electrical panel, plumbing, and water heater last replaced?
- What's the actual annual flood-insurance premium (NFIP or private), and is the property in a SFHA with mandatory coverage?
- What does the HOA fee cover, when was the last increase, and are there any pending special assessments or reserve-fund shortfalls?
- Is there a deadline driving the sale (1031 exchange, divorce, estate, relocation)? That informs how much negotiation room exists.
- Schools are D-rated, which usually means shorter tenancies and higher turnover. Who's the typical renter profile here, and what's been the actual vacancy rate?
- Crime grade is F in this area — have there been break-ins, vandalism, or insurance claims at this property in the last 3 years? What carrier currently insures it and at what premium?
- The area grade is low — what's the realistic commute time and amenity access for the typical tenant pool here? Any planned neighborhood developments (good or bad) we should know about?
- This sits on a lake — are riparian / water-frontage rights deeded with the parcel? Any dock permits, shoreline easements, or HOA water-use restrictions?
- What's the documented flood / surge / shoreline-erosion history here (FEMA AND non-FEMA — e.g., storm surge, creek backup, septic-field saturation)?
- Any water-quality or seasonal algae-bloom issues that affect tenant satisfaction or short-term-rental demand?
- What's the average days-on-market for RENTAL listings here right now (not sales)? A rising rental-DOM trend means longer vacancies and softer asking-rent achievability than the comps imply.
- What's the recent tenant-quality profile in this submarket — average credit score on applications, eviction rate, late-payment / NSF rate, and stable-employment percentage? A property-management company in the area should have these aggregated.
- How much new for-sale + rental construction is in the pipeline within 1–3 miles? Heavy new supply typically softens prices + rents 12–24 months out; constrained supply supports both.
Investment metrics
- 1% rule
- 0.83% ✗
- Cap rate
- 5.64%
- Cash-on-cash
- -2.33%
- DSCR
- 0.90
- GRM
- 10.0
CMA / ARV
- ARV (median comp)
- $236,889
- List price
- $149,000
- Delta
- -37.10%
- Verdict
- UNDERPRICED
- Comps
- 20 within 1.0 mi
Show comp detail 6 sales within ~0.75 mi
| Address | Dist | Beds/Ba | Sqft | Sold | Price | $/sf | Match |
|---|---|---|---|---|---|---|---|
| 319 River Rd | 0.21mi | 2/2.0 (-1) | 1,509 (+11%) | 4mo | $149,000 | $99 | 64 |
| 238 Lakeside Ct | 0.09mi | 2/1.5 (-1) | 1,260 (-8%) | 17mo | $230,000 | $183 | 62 |
| 270 John Ln Ln | 0.62mi | 3/2.0 | 1,456 (+7%) | 13mo | $175,000 | $120 | 49 |
| 238 Ridgewood Rd | 0.53mi | 2/2.0 (-1) | 1,468 (+8%) | 12mo | $129,000 | $88 | 48 |
| 161 Eastridge Rd | 0.71mi | 3/2.0 | 1,510 (+11%) | 9mo | $220,000 | $146 | 41 |
| 411 County Rd | 0.60mi | 2/2.0 (-1) | 1,204 (-12%) | 12mo | $260,000 | $216 | 38 |
Match score weights: distance 35% · size 25% · config 20% · recency 20%. Top-matched comps best support the ARV.
Projected returns pro-forma
3.0% appreciation · 3.0% rent growth · sell at horizon
- IRR
- 2.1%
- Equity multiple
- 1.12×
- Total profit
- $4,927
- Equity at exit
- $66,997
- IRR
- 5.7%
- Equity multiple
- 1.87×
- Total profit
- $36,134
- Equity at exit
- $103,250
Cash invested: $41,720 (down + closing). Projections, not guarantees.
Landlord ↔ Tenant lean methodology
- Overall (STATE)
- 87 Strongly Landlord-Friendly
- State Texas
- 87 Strongly Landlord-Friendly · R+5
- County
- — inherits STATE
- City
- — inherits STATE
ZIP-level market 77335
- Active inventory
- 34
- Price-to-rent
- 10.0×
Monthly cashflow live
- Estimated rent
- $1,242 medium interval (Pro) →
- Mortgage (P&I)
- −$781
- Tax from tax record
- −$203 /mo · $2,442/yr
- Insurance
- −$62
- Flood insurance flood zone
- −$125 /mo · $1,502/yr
- HOA
- −$15
- Vacancy / Maint / Mgmt
- −$261
- Net cashflow
- $-206
Break-even live
Sensitivity live
| Price | -10% $-122 | -5% $-164 | +0% $-206 | +5% $-248 | +10% $-291 |
|---|---|---|---|---|---|
| Rent | -10% $-304 | -5% $-255 | +0% $-206 | +5% $-157 | +10% $-108 |
| Rate | -1.0pp $-131 | -0.5pp $-168 | base $-206 | +0.5pp $-245 | +1.0pp $-284 |
UW: 25.0% down · 7.5% · 30yr · 1.5% tax · 5.0% vac · 8.0% maint · 8.0% mgmt
Financing live
Cash to close
- Down payment
- $37,250
- Closing costs
- $4,470
- Reserves months
- —
- Total cash needed
- —
Loan-product check · same deal, 3 products live
Conventional
25% down · 7.5% · 30yr
- Down + closing
- —
- Monthly P&I
- —
- Monthly cashflow
- —
- DSCR
- —
- Eligible?
- —
Personal DTI + credit; lowest rate.
DSCR
20% down · 8.5% · 30yr
- Down + closing
- —
- Monthly P&I
- —
- Monthly cashflow
- —
- DSCR
- —
- Eligible?
- —
No personal income docs; deal must DSCR.
Hard money
10% down · 12.0% · 12mo
- Down + closing
- —
- Monthly P&I
- —
- Monthly cashflow
- —
- DSCR
- —
- Eligible?
- —
Short-term bridge; refi at stabilization.
HOA detail
- Monthly dues
- $15 · $180/yr
- Likely covers
- water
Listing history 41 events
-
2026-06-21days on market $149,000 Active 44 DOM
-
2026-06-18days on market $149,000 Active 41 DOM
-
2026-06-17days on market $149,000 Active 40 DOM
-
2026-06-16days on market $149,000 Active 39 DOM
-
2026-06-15days on market $149,000 Active 38 DOM
-
2026-06-14days on market $149,000 Active 36 DOM
-
2026-06-13days on market $149,000 Active 35 DOM
-
2026-06-10days on market $149,000 Active 33 DOM
-
2026-06-09days on market $149,000 Active 32 DOM
-
2026-06-08days on market $149,000 Active 31 DOM
-
2026-06-07days on market $149,000 Active 30 DOM
-
2026-06-03days on market $149,000 Active 26 DOM
-
2026-06-02days on market $149,000 Active 25 DOM
-
2026-06-01days on market $149,000 Active 24 DOM
-
2026-05-31days on market $149,000 Active 23 DOM
-
2026-05-31days on market $149,000 Active 22 DOM
-
2026-05-08$149,000 Active 877-char remark
-
2026-05-07historical
-
2026-05-03price $149,000
-
2026-04-10price $165,000
-
2026-04-10status Active
-
2026-04-07status Pending
-
2026-02-12price $175,000
-
2026-01-28$199,900 Active
-
2025-11-30historical
-
2025-04-14$214,900 Active
-
2025-04-14historical
-
2025-02-27$227,500 Active
-
2025-02-24historical
-
2025-01-14$235,000 Active
-
2025-01-03historical
-
2021-09-01soldstatus
-
2021-08-31soldstatus Sold
-
2021-07-18status Pending
-
2021-07-07status Option Pending
-
2021-06-21price $164,900
-
2021-05-18price $179,500
-
2021-04-05$179,900 Active
-
2019-07-24historical
-
2019-06-05$129,900
-
2007-05-15soldstatus
ⓘ Source: listings_history table (triggers on properties + properties_extension) + one-shot
backfill from property_details.listing_events for pre-trigger history.
Tax reassessment forecast TX · Resets to sale price
- Current annual tax
- $2,442 · $203/mo
- Projected year-2 tax
- $2,727 · $227/mo
- Expected delta
- +$285/yr (+$24/mo · 11.7%)
ⓘ Screening estimate from a state-policy table — verify with the county assessor before closing.
Climate risk First Street
- Flood 9/10 Extreme FEMA zone A · 99% chance over 30 yrs
- Wildfire 4/10 Moderate
- Heat 8/10 Severe 7 d/yr ≥112°F today · 24 d/yr by 30 yrs out
- Wind 8/10 Severe 99% chance of damaging wind over 30 yrs
- Air quality 1/10 Low 0 unhealthy d/yr today · 0 by 30 yrs out
Nearby sold comps map
Loading sold comps map…
Walkable amenities ~0.75 mi
Loading nearby amenities…
Taxation est. · year 1
- Rental income
- $14,899
- − Mortgage interest
- −$8,346
- − Property taxes
- −$2,442
- − Insurance
- −$2,248
- − Repairs & maintenance
- −$1,192
- − Management
- −$1,192
- − HOA
- −$180
- − Depreciation
- −$4,335
- Taxable loss
- −$5,035
- Est. tax savings @ 24.0%
- +$1,208
- After-tax cash flow
- $-1,267/yr
For passive investors: Depreciation is non-cash, so a rental often shows a tax loss while cash-flowing — sheltering income. Rental losses are passive: they offset passive income freely, and up to $25,000/yr can offset ordinary (W-2) income if you actively participate and your MAGI is under $100k (phasing out to $0 by $150k); unused losses carry forward. On sale, claimed depreciation is recaptured at up to 25%, and gains may owe capital-gains tax (a 1031 exchange can defer both). Figures are a year-1 estimate at your 24.0% rate — not tax advice; consult a CPA.
Schools (NCES district)
- District
- Goodrich ISD
- NCES district ID
- 4821090
- Math proficiency
- 45% ▲ 15.00%
- Reading proficiency
- 30% ▲ 5.00%
- Median HH income
- $35,220
- Composite
- 33.57/100
- National rank
- #10494
- State rank
- #849 of 1141 in TX
Livability — Goodrich
- Score
- 60/100
- State rank
- #1053
- US rank
- #18692
Category grades
Schools grade is shown separately in the Schools card above.
Census & demographics
- Population (ZIP)
- 2,945
Population outlook (Polk County) Hauer SSP2
- Today (2025)
- 51,049 people
- By 2030
- 53,243 · +4.3%
- By 2040
- 56,528 · +10.7%
- By 2050
- 59,243 · +16.1%
- By 2075
- 63,528 · +24.4%
- By 2100
- 60,376 · +18.3%
Race, ethnicity, and origin ACS 2023
- Neighborhood character
- Predominantly White (71%)
- Race & ethnicity
- White 71% Hispanic / Latino 23% Two or more races 16% Black 5%
- Hispanic origin (detail)
- Mexican 21%
- Common ancestry
- Lithuanian 3% Slovak 2% Iranian 2%
- Foreign-born
- 2% · Canada
- Languages at home
- 85% English-only · Spanish 15%
Political lean MEDSL · Polk
- 2024 margin
- Solid R (+58.9) · D 20.2% · R 79.1%
- 2008→2024 swing
- -21.7pp toward R · 2008: -37.2pp · 2024: -58.9pp
- All cycles
- 2024: R+58.9 2020: R+54.5 2016: R+56.5 2012: R+48.2 2008: R+37.2
Not yet ingested
- Civics
- —
Market trends
- HPI YoY
- —
- Current HPI
- —
- Rent YoY
- —
- Metro
- —
- State GDP YoY
- ▲ 3.95%
- F500 in state
- 110
Industry mix (Fortune 500 HQ in TX)
| Industry | F500 HQs | Revenue |
|---|---|---|
| Energy | 16 | $1,198B |
|
||
| Technology | 5 | $198B |
|
||
| Engineering / Construction | 4 | $72B |
|
||
| Energy Services | 3 | $60B |
|
||
| Utilities | 3 | $41B |
|
||
| Healthcare | 2 | $330B |
|
||
Price history
+14.7% since first listed25 events — show timeline
- 2026-05-08 Listed $149,000 HARMLS
- 2026-05-07 Listing Removed — HARMLS
- 2026-05-03 Price Changed $149,000 HARMLS
- 2026-04-10 Price Changed $165,000 HARMLS
- 2026-04-10 Relisted — HARMLS
- 2026-04-07 Pending — HARMLS
- 2026-02-12 Price Changed $175,000 HARMLS
- 2026-01-28 Listed $199,900 HARMLS
- 2025-11-30 Listing Removed — HARMLS
- 2025-04-14 Listing Removed — HARMLS
- 2025-04-14 Listed $214,900 HARMLS
- 2025-02-27 Listed $227,500 HARMLS
- 2025-02-24 Listing Removed — HARMLS
- 2025-01-14 Listed $235,000 HARMLS
- 2025-01-03 Coming Soon — HARMLS
- 2021-09-01 Sold (Public Records) — Public Records
- 2021-08-31 Sold (MLS) — HARMLS
- 2021-07-18 Pending — HARMLS
- 2021-07-07 Pending — HARMLS
- 2021-06-21 Price Changed $164,900 HARMLS
- 2021-05-18 Price Changed $179,500 HARMLS
- 2021-04-05 Listed $179,900 HARMLS
- 2019-07-24 Listing Removed — HARMLS
- 2019-06-05 Listed $129,900 HARMLS
- 2007-05-15 Sold (Public Records) — Public Records
Property tax history
+4.5%/yrLatest (2025): $2,442 · +8.5% YoY. Source: county tax records.
Cash-flow waterfall
monthlySold comps — $/sqft
last 12 mo · ≤1 miLoading sold comps…