60 Red Bird Ln · Worthville, KY
Flood risk No data
- FEMA flood zone
- —
- Chance of flooding over 30 yrs
- —
- Est. flood insurance / yr
- —
Fire risk No data
- Est. fire insurance / yr
- —
Heat risk No data
- Hot days now (above threshold)
- —
- Hot days in 30 yrs
- —
Wind risk No data
- Chance of severe wind over 30 yrs
- —
Air-quality risk No data
- Unhealthy air days now
- —
- Unhealthy air days in 30 yrs
- —
Risk factors via First Street. Map © Google.
Why this score? — see what drove the B grade
The composite is a weighted blend of 9 inputs, each scored 0–100. Each bar is that input's sub-score; the figure is the points it added to the 100-point composite (weight × sub-score).
- Cash flow +30.0/30.0
- ARV discount +12.1/15.0
- DSCR +10.0/10.0
- 1% rule +9.2/10.0
- Appreciation +3.6/10.0
- Livability +2.6/5.0
- Rent growth +2.5/5.0
- Condition / age +2.5/5.0
- Schools +2.4/10.0
$59,900
🖨 Deal sheet 📄 Offer letter ✓ Due diligence
Listing remarks MLS
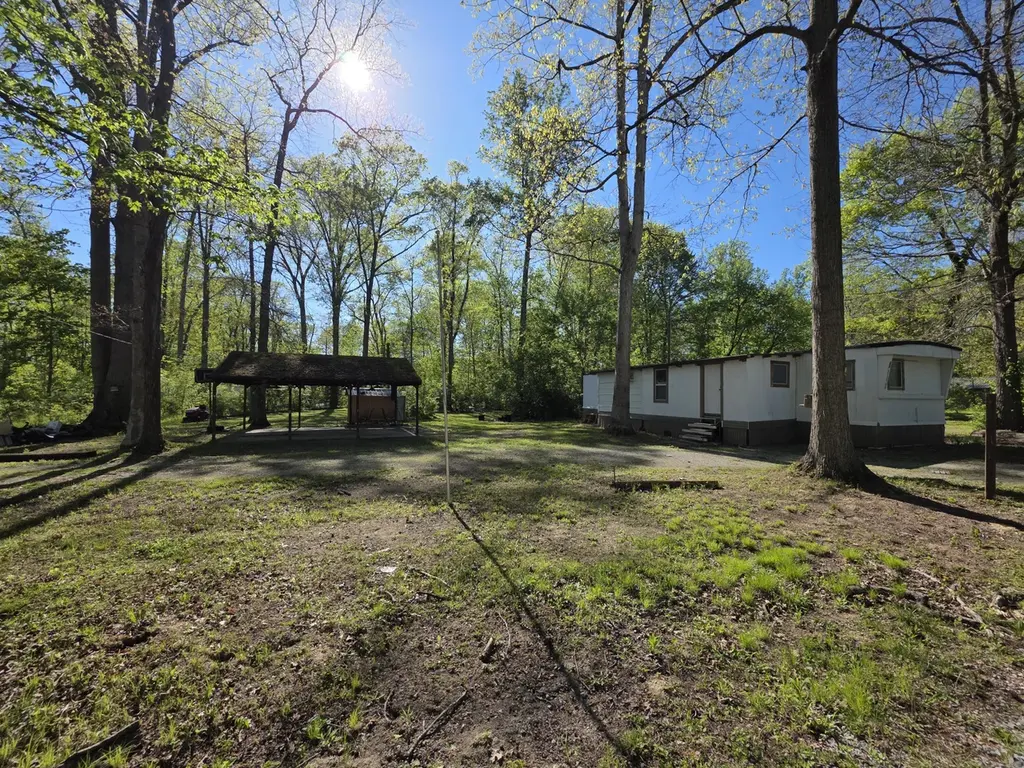
Here is a newly updated 2bed 1bath home located on a spacious, level half acre that is a total of 3 lots. There is plenty of space to entertain under the large awning and the lot and the home has been newly remodeled and is ready for you to purchase your very own slice of Eagle Creek Resort. Call today to schedule your private showing!
Key facts
- Large awning
- Newly remodeled
- 0.49 acre lot
Tags
Neighborhood map
What this means for you Summary
Snapshot
- This is a 2-bed/1.0-bath single-family listed at $60k.
Deal economics
- At list price, monthly cash flow is $283 ($3k/yr) — positive.
- The deal already cash-flows at list — no discount required.
- Meets the 1% rule at list price ($848 rent vs $60k).
- Recommended offer: $58k (3.0% below list) — sets the bar for market timing.
Location & tenants
- Location reads 52/100 on livability (#496 in KY) — a working-class tenant base; expect higher turnover. Strengths: cost of living A+; Watch: schools F, amenities F, commute F.
- Owen County (rural): math 24% / reading 32% proficiency, ranked #120 of 165 in KY (top 73%) — low school quality limits family demand, transient renter base, plan for 1-2y turnover.
- Market conditions: 13 active listings in the ZIP; 18 units permitted in Owen County in 2024 (0 in 5+ unit buildings).
Forward outlook
- Local home prices are declining (-2.7%/yr); year-one equity from $414 of loan paydown is wiped out by about $2k of value loss. Plan a longer hold.
- Owen County population projected at -14% by 2050 — secular population decline; favor cash flow + early exit over multi-decade hold.
- At projected returns (-2.7% appreciation + 3.0% rent growth), your $17k cash investment doubles in ~6 years — after that, you're playing with house money.
Negotiation context
- It's been on market 60 days — a 3% lower offer ($58k) is reasonable based on typical stale-listing flexibility.
- 2 sale attempts since 13y ago with the ask held roughly flat each time — persistent listings suggest the price (not the market) is what's stuck; bring a comps-based counter.
Questions for the listing agent
- It's been on market 60 days. Have you received any prior offers? Is the seller open to a 3% concession, seller financing, or rate buy-down credit?
- What does the HOA fee cover, when was the last increase, and are there any pending special assessments or reserve-fund shortfalls?
- Is there a deadline driving the sale (1031 exchange, divorce, estate, relocation)? That informs how much negotiation room exists.
- Schools are F-rated, which usually means shorter tenancies and higher turnover. Who's the typical renter profile here, and what's been the actual vacancy rate?
- What's the average days-on-market for RENTAL listings here right now (not sales)? A rising rental-DOM trend means longer vacancies and softer asking-rent achievability than the comps imply.
- What's the recent tenant-quality profile in this submarket — average credit score on applications, eviction rate, late-payment / NSF rate, and stable-employment percentage? A property-management company in the area should have these aggregated.
- How much new for-sale + rental construction is in the pipeline within 1–3 miles? Heavy new supply typically softens prices + rents 12–24 months out; constrained supply supports both.
Investment metrics
- 1% rule
- 1.42% ✓
- Cap rate
- 11.97%
- Cash-on-cash
- 20.28%
- DSCR
- 1.90
- GRM
- 5.9
CMA / ARV
- ARV (median comp)
- $66,755
- List price
- $59,900
- Delta
- -10.27%
- Verdict
- UNDERPRICED
- Comps
- 7 within 1.0 mi
Projected returns pro-forma
-2.74% appreciation · 3.0% rent growth · sell at horizon
- IRR
- 13.2%
- Equity multiple
- 1.54×
- Total profit
- $8,988
- Equity at exit
- $9,618
- IRR
- 21.7%
- Equity multiple
- 2.88×
- Total profit
- $31,610
- Equity at exit
- $6,366
Cash invested: $16,772 (down + closing). Projections, not guarantees.
Landlord ↔ Tenant lean methodology
- Overall (STATE)
- 83 Strongly Landlord-Friendly
- State Kentucky
- 83 Strongly Landlord-Friendly · R+16
- County
- — inherits STATE
- City
- — inherits STATE
ZIP-level market 41098
- Home prices YoY
- -1.5%
- Active inventory
- 13
- Price-to-rent
- 5.9×
Monthly cashflow live
- Estimated rent
- $848 medium interval (Pro) →
- Mortgage (P&I)
- −$314
- Tax from tax record
- −$30 /mo · $362/yr
- Insurance
- −$25
- HOA
- −$17
- Vacancy / Maint / Mgmt
- −$178
- Net cashflow
- $283
Break-even live
UW: 25.0% down · 7.5% · 30yr · 1.5% tax · 5.0% vac · 8.0% maint · 8.0% mgmt
Financing live
Cash to close
- Down payment
- $14,975
- Closing costs
- $1,797
- Reserves months
- —
- Total cash needed
- —
Loan-product check · same deal, 3 products live
Conventional
25% down · 7.5% · 30yr
- Down + closing
- —
- Monthly P&I
- —
- Monthly cashflow
- —
- DSCR
- —
- Eligible?
- —
Personal DTI + credit; lowest rate.
DSCR
20% down · 8.5% · 30yr
- Down + closing
- —
- Monthly P&I
- —
- Monthly cashflow
- —
- DSCR
- —
- Eligible?
- —
No personal income docs; deal must DSCR.
Hard money
10% down · 12.0% · 12mo
- Down + closing
- —
- Monthly P&I
- —
- Monthly cashflow
- —
- DSCR
- —
- Eligible?
- —
Short-term bridge; refi at stabilization.
HOA detail
- Monthly dues
- $17 · $204/yr
Listing history 19 events
-
2026-06-19days on market $59,900 Active 60 DOM
-
2026-06-18days on market $59,900 Active 59 DOM
-
2026-06-17days on market $59,900 Active 58 DOM
-
2026-06-16days on market $59,900 Active 57 DOM
-
2026-06-15days on market $59,900 Active 56 DOM
-
2026-06-14days on market $59,900 Active 54 DOM
-
2026-06-12days on market $59,900 Active 53 DOM
-
2026-06-09days on market $59,900 Active 50 DOM
-
2026-06-08days on market $59,900 Active 49 DOM
-
2026-06-07days on market $59,900 Active 48 DOM
-
2026-06-05days on market $59,900 Active 45 DOM
-
2026-06-03days on market $59,900 Active 44 DOM
-
2026-06-02days on market $59,900 Active 43 DOM
-
2026-06-01days on market $59,900 Active 42 DOM
-
2026-05-31days on market $59,900 Active 41 DOM
-
2026-05-30days on market $59,900 Active 40 DOM
-
2026-04-20$59,900 Active 337-char remark
Show marketing remark (337 chars)
Here is a newly updated 2bed 1bath home located on a spacious, level half acre that is a total of 3 lots. There is plenty of space to entertain under the large awning and the lot and the home has been newly remodeled and is ready for you to purchase your very own slice of Eagle Creek Resort. Call today to schedule your private showing!
-
2014-07-10historical
-
2013-07-10$28,000
ⓘ Source: listings_history table (triggers on properties + properties_extension) + one-shot
backfill from property_details.listing_events for pre-trigger history.
Tax reassessment forecast KY · Resets to sale price
- Current annual tax
- $362 · $30/mo
- Projected year-2 tax
- $515 · $43/mo
- Expected delta
- +$154/yr (+$13/mo · 42.5%)
ⓘ Screening estimate from a state-policy table — verify with the county assessor before closing.
Nearby sold comps map
Loading sold comps map…
Walkable amenities ~0.75 mi
Loading nearby amenities…
Taxation est. · year 1
- Rental income
- $10,172
- − Mortgage interest
- −$3,355
- − Property taxes
- −$362
- − Insurance
- −$300
- − Repairs & maintenance
- −$814
- − Management
- −$814
- − HOA
- −$204
- − Depreciation
- −$1,743
- Taxable income
- $2,582
- Est. tax owed @ 24.0%
- −$620
- After-tax cash flow
- $2,782/yr
For passive investors: Depreciation is non-cash, so a rental often shows a tax loss while cash-flowing — sheltering income. Rental losses are passive: they offset passive income freely, and up to $25,000/yr can offset ordinary (W-2) income if you actively participate and your MAGI is under $100k (phasing out to $0 by $150k); unused losses carry forward. On sale, claimed depreciation is recaptured at up to 25%, and gains may owe capital-gains tax (a 1031 exchange can defer both). Figures are a year-1 estimate at your 24.0% rate — not tax advice; consult a CPA.
Schools (NCES district)
- District
- Owen County
- NCES district ID
- 2104560
- Math proficiency
- 24% ▼ -19.00%
- Reading proficiency
- 32% ▼ -18.00%
- Median HH income
- $42,943
- Composite
- 23.84/100
- National rank
- #7804
- State rank
- #120 of 165 in KY
Livability — Worthville
- Score
- 52/100
- State rank
- #496
- US rank
- #25028
Category grades
Schools grade is shown separately in the Schools card above.
Census & demographics
- Population (ZIP)
- 1,138
Population outlook (Owen County) Hauer SSP2
- Today (2025)
- 10,496 people
- By 2030
- 10,251 · -2.3%
- By 2040
- 9,650 · -8.1%
- By 2050
- 8,984 · -14.4%
- By 2075
- 7,589 · -27.7%
- By 2100
- 6,380 · -39.2%
Race, ethnicity, and origin ACS 2023
- Neighborhood character
- Predominantly White (91%)
- Race & ethnicity
- White 91% Two or more races 9%
- Common ancestry
- Iranian 5% Slovak 4% Italian 4%
Political lean MEDSL · Owen
- 2024 margin
- Solid R (+62.7) · D 18.0% · R 80.7% · Other 1.3%
- 2008→2024 swing
- -35.9pp toward R · 2008: -26.8pp · 2024: -62.7pp
- All cycles
- 2024: R+62.7 2020: R+58.5 2016: R+53.7 2012: R+32.3 2008: R+26.8
Not yet ingested
- Civics
- —
Market trends
- HPI YoY
- ▼ -2.74%
- Current HPI
- 177.3618
- Rent YoY
- —
- Metro
- —
- State GDP YoY
- ▲ 1.81%
- F500 in state
- 4
Industry mix (Fortune 500 HQ in KY)
| Industry | F500 HQs | Revenue |
|---|---|---|
| Healthcare | 1 | $118B |
|
||
| Food / Beverage | 1 | $7B |
|
||
Price history
+113.9% since first listed3 events — show timeline
- 2026-04-20 Listed $59,900 NKMLS
- 2014-07-10 Listing Removed — NKMLS
- 2013-07-10 Listed $28,000 NKMLS
Property tax history
+3.1%/yrLatest (2025): $362 · +2.5% YoY. Source: county tax records.
Cash-flow waterfall
monthlySold comps — $/sqft
last 12 mo · ≤1 miLoading sold comps…