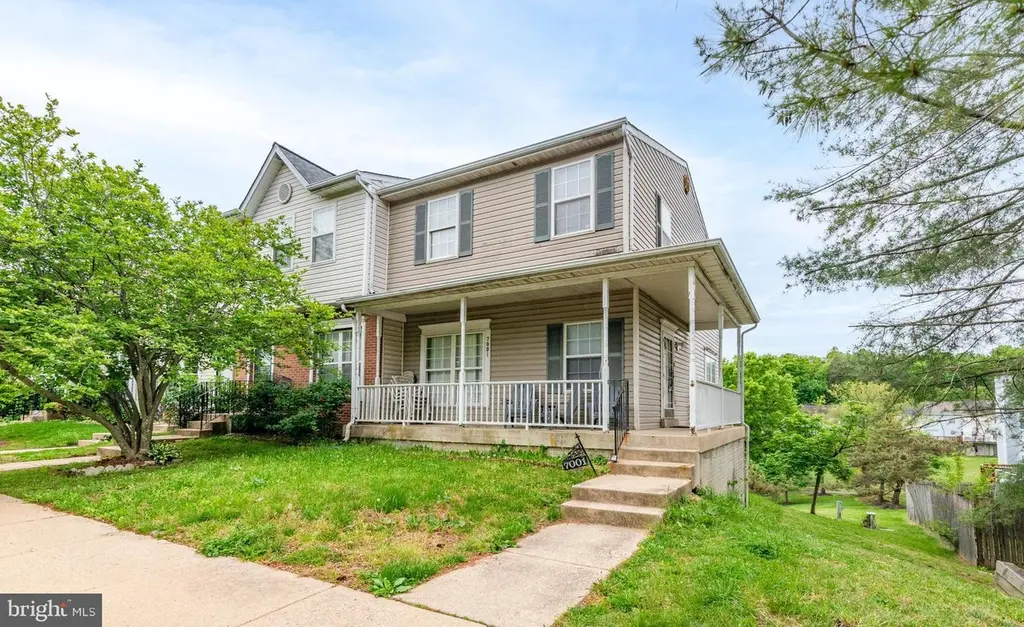
7001 Flag Harbor Dr · Walker Mill, MD
Flood risk 1/10 · Minimal
- FEMA flood zone
- X (unshaded)
- Chance of flooding over 30 yrs
- 0.0%
- Est. flood insurance / yr
- $473 – $860
Fire risk 1/10 · Minimal
- Est. fire insurance / yr
- $755 – $1,403
Heat risk 8/10 · Major
- Hot days now (above 102°F)
- 7 days/yr
- Hot days in 30 yrs
- 16 days/yr
Wind risk 5/10 · Moderate
- Chance of severe wind over 30 yrs
- 23.0%
Air-quality risk 4/10 · Minor
- Unhealthy air days now
- 4 days/yr
- Unhealthy air days in 30 yrs
- 5 days/yr
Risk factors via First Street. Map © Google.
Why this score? — see what drove the C+ grade
The composite is a weighted blend of 9 inputs, each scored 0–100. Each bar is that input's sub-score; the figure is the points it added to the 100-point composite (weight × sub-score).
- Cash flow +25.8/30.0
- 1% rule +9.5/10.0
- DSCR +8.6/10.0
- ARV discount +7.5/15.0
- Livability +3.2/5.0
- Rent growth +3.0/5.0
- Condition / age +2.5/5.0
- Schools +1.7/10.0
- Appreciation +0.0/10.0
$150,000
🖨 Deal sheet 📄 Offer letter ✓ Due diligence
Listing remarks MLS
If your looking for elegant this ia a must see townhome. Nice End unit with deck. Marble floors in dining droom and bathrooms. Ceramic tile in kitchen and wood flooring in living room. Full bath in master beddroom. Too see is to sell.
Key facts
- 1,875 sq ft lot
- Built 1996
- Listed 45 days
Property features AI
Finance
- Other: Fee simple ownership
- HOA & community: HOA dues of $110 per month
Exterior
- Parking: Parking lot
- Utilities: Public water; Public sewer; Electric hot water
- Home design: Detached structure
- Construction: Frame construction; Other foundation; Above-grade and below-grade structures; Built year per assessor
- Exterior features: Parking lot; No tidal water
Interior
- Bedrooms: Three bedrooms on the upper level
- Bathrooms: Two full bathrooms (upper level total); Two half bathrooms total (one on main level, one on lower level)
- Heating & cooling: Forced air heating; Electric heating fuel; Other cooling type
- Interior features: Unfinished basement; Multiple access exits (2+)
Neighborhood map
What this means for you Summary
Snapshot
- This is a 3-bed/2.5-bath townhouse listed at $150k.
Deal economics
- At list price, monthly cash flow is $365 ($4k/yr) — positive.
- The deal already cash-flows at list — no discount required.
- Meets the 1% rule at list price ($2k rent vs $150k).
- Recommended offer: $146k (3.0% below list) — sets the bar for market timing.
- Cap rate 9.2% vs local median 4.4% in Walker Mill — top-decile yield for the area; either an underpriced asset or a hidden risk that comps aren't pricing in. Stress-test before assuming the spread holds.
Location & tenants
- Location reads 63/100 on livability (#300 in MD) — a middle-class / working-renter tenant base. Strengths: commute A+, housing A+, employment A; Watch: crime D+, amenities F, cost of living F.
- Prince George'S County Public Schools (suburban): math 8% / reading 24% proficiency, ranked #21 of 24 in MD (top 88%) — low school quality limits family demand, transient renter base, plan for 1-2y turnover.
- Market conditions: Rents rising (+2.0%/yr); 114 active listings in the ZIP; 21 comparable units currently listed for rent nearby; rentals at typical pace (median 19d on market — plan ~3-4 weeks tenant-placement turnaround); solid renter incomes; 1,481 units permitted in Prince George's County in 2024 (0 in 5+ unit buildings).
- This rent runs 34% of the median local income ($76k/yr) — at the standard rent-burdened threshold; future hikes will face affordability resistance.
Forward outlook
- Local home prices are declining (-3.0%/yr); year-one equity from $1k of loan paydown is wiped out by about $4k of value loss. Plan a longer hold.
- Prince George's County population projected at +18% by 2050 — long-run rental-demand tailwind backs the buy-and-hold thesis.
Negotiation context
- It's been on market 45 days — a 3% lower offer ($146k) is reasonable based on typical stale-listing flexibility.
- 3 sale attempts since 25y ago with the ask held roughly flat each time — persistent listings suggest the price (not the market) is what's stuck; bring a comps-based counter.
Risks & watch-outs
- Watch-outs: property tax is 3.1% of price.
- Climate carrying-cost: moderate wind risk, 23% chance of damaging wind over 30y; extreme-heat days projected 7→16/yr by 2055 (HVAC capex compounding) — expect insurance premiums to compound above CPI over the hold.
Questions for the listing agent
- It's been on market 45 days. Have you received any prior offers? Is the seller open to a 3% concession, seller financing, or rate buy-down credit?
- Property tax is high relative to price — has the assessment been appealed recently, and will the sale trigger a re-assessment?
- What does the HOA fee cover, when was the last increase, and are there any pending special assessments or reserve-fund shortfalls?
- Is there a deadline driving the sale (1031 exchange, divorce, estate, relocation)? That informs how much negotiation room exists.
- Schools are B-rated — typically a magnet for longer-tenancy family renters. What's the average tenant stay here, and is there a school-zone premium baked into asking?
- Crime grade is D in this area — have there been break-ins, vandalism, or insurance claims at this property in the last 3 years? What carrier currently insures it and at what premium?
- What's the average days-on-market for RENTAL listings here right now (not sales)? A rising rental-DOM trend means longer vacancies and softer asking-rent achievability than the comps imply.
- What's the recent tenant-quality profile in this submarket — average credit score on applications, eviction rate, late-payment / NSF rate, and stable-employment percentage? A property-management company in the area should have these aggregated.
- How much new for-sale + rental construction is in the pipeline within 1–3 miles? Heavy new supply typically softens prices + rents 12–24 months out; constrained supply supports both.
Investment metrics
- 1% rule
- 1.45% ✓
- Cap rate
- 9.22%
- Cash-on-cash
- 10.44%
- DSCR
- 1.46
- GRM
- 5.8
CMA / ARV
- ARV (median comp)
- $418,957
- List price
- $150,000
- Delta
- -64.20%
- Verdict
- UNDERPRICED
- Comps
- 20 within 1.0 mi
Show comp detail 12 sales within ~0.75 mi
| Address | Dist | Beds/Ba | Sqft | Sold | Price | $/sf | Match |
|---|---|---|---|---|---|---|---|
| 7244 Flag Harbor Dr | 0.14mi | 3/2.5 | 1,320 (0%) | 3mo | $335,000 | $254 | 91 |
| 7017 Migliori | 0.36mi | 3/2.5 | 1,320 (0%) | 1mo | $345,000 | $261 | 83 |
| 1547 Karen Blvd | 0.24mi | 3/2.5 | 1,312 (-1%) | 9mo | $328,000 | $250 | 80 |
| 7001 Migliori Ct | 0.33mi | 3/3.0 | 1,332 (+1%) | 4mo | $385,000 | $289 | 77 |
| 7132 Marbury Ct | 0.16mi | 3/1.5 | 1,200 (-9%) | 2mo | $270,000 | $225 | 71 |
| 1871 Addison Rd S | 0.14mi | 3/1.5 | 1,154 (-13%) | 1mo | $185,001 | $160 | 68 |
| 1705 Addison Rd S | 0.18mi | 3/1.5 | 1,156 (-12%) | 3mo | $185,000 | $160 | 65 |
| 1891 Addison Rd S | 0.15mi | 3/1.5 | 1,129 (-14%) | 1mo | $178,200 | $158 | 64 |
| 1601 Addison Rd S | 0.24mi | 3/1.5 | 1,154 (-13%) | 5mo | $167,500 | $145 | 60 |
| 1621 Addison Rd S | 0.21mi | 3/1.5 | 1,128 (-14%) | 4mo | $180,000 | $160 | 59 |
| 1631 Addison Rd S #1631 | 0.30mi | 3/1.5 | 1,128 (-14%) | 2mo | $179,000 | $159 | 56 |
| 6929 Bank Run Ter | 0.27mi | 3/1.5 | 1,136 (-14%) | 8mo | $299,000 | $263 | 54 |
Match score weights: distance 35% · size 25% · config 20% · recency 20%. Top-matched comps best support the ARV.
Projected returns pro-forma
-3.0% appreciation · 2.0% rent growth · sell at horizon
- IRR
- -1.9%
- Equity multiple
- 0.93×
- Total profit
- $-2,968
- Equity at exit
- $22,365
- IRR
- 6.6%
- Equity multiple
- 1.47×
- Total profit
- $19,601
- Equity at exit
- $12,969
Cash invested: $42,000 (down + closing). Projections, not guarantees.
Landlord ↔ Tenant lean methodology
- Overall (STATE)
- 27 Tenant-Leaning
- State Maryland
- 27 Tenant-Leaning · D+14
- County
- — inherits STATE
- City
- — inherits STATE
ZIP-level market 20747
- Home prices YoY
- -19.0%
- Rents YoY
- 2.0%
- Active inventory
- 114
- Price-to-rent
- 5.8×
Monthly cashflow live
- Estimated rent
- $2,173 high interval (Pro) →
- Mortgage (P&I)
- −$787
- Tax from tax record
- −$392 /mo · $4,705/yr
- Insurance
- −$62
- HOA
- −$110
- Vacancy / Maint / Mgmt
- −$456
- Net cashflow
- $365
Break-even live
UW: 25.0% down · 7.5% · 30yr · 1.5% tax · 5.0% vac · 8.0% maint · 8.0% mgmt
Financing live
Cash to close
- Down payment
- $37,500
- Closing costs
- $4,500
- Reserves months
- —
- Total cash needed
- —
Loan-product check · same deal, 3 products live
Conventional
25% down · 7.5% · 30yr
- Down + closing
- —
- Monthly P&I
- —
- Monthly cashflow
- —
- DSCR
- —
- Eligible?
- —
Personal DTI + credit; lowest rate.
DSCR
20% down · 8.5% · 30yr
- Down + closing
- —
- Monthly P&I
- —
- Monthly cashflow
- —
- DSCR
- —
- Eligible?
- —
No personal income docs; deal must DSCR.
Hard money
10% down · 12.0% · 12mo
- Down + closing
- —
- Monthly P&I
- —
- Monthly cashflow
- —
- DSCR
- —
- Eligible?
- —
Short-term bridge; refi at stabilization.
Rent comps 21 comps
| Address | Beds | Baths | Sqft | Rent | $/sqft | DOM | Units | Dist |
|---|---|---|---|---|---|---|---|---|
| 1925 Addison Rd S District Heights, MD | 3.0 | 1.5 | 1182 | $2,242 | $1.90 | 24d | 1 | 0.10mi |
| 1901 Addison Rd S District Heights, MD | 3.0 | 1.5 | 1154 | $2,100 | $1.82 | 44d | 1 | 0.12mi |
| 1741 Addison Rd S District Heights, MD | 3.0 | 1.5 | 1300 | $1,950 | $1.50 | 19d | 1 | 0.18mi |
| 6769 Milltown Ct District Heights, MD | 2.0 | 1.5 | 1100 | $2,299 | $2.09 | 11d | 1 | 0.33mi |
| 7017 Migliori Ct District Heights, MD | 3.0 | 2.5 | 1320 | $2,650 | $2.01 | 5d | 1 | 0.35mi |
| 6957 Walker Mill Rd Capitol Heights, MD | 3.0 | 2.5 | 1320 | $2,650 | $2.01 | 44d | 1 | 0.38mi |
| 1341 Karen Blvd Capitol Heights, MD | 2.0 | 2.0 | 950 | $2,300 | $2.42 | 44d | 1 | 0.40mi |
| 6936 Walker Mill Rd Capitol Heights, MD | 1.0–3.0 | 1.0–1.5 | 806 | $1,700 | $2.11 | 13d | 11 | 0.48mi |
| 6565 Ronald Rd Capitol Heights, MD | 3.0 | 3.5 | 1350 | $2,650 | $1.96 | 44d | 1 | 0.58mi |
| 2610 Lakehurst Ave District Heights, MD | 3.0 | 1.0 | 1096 | $2,150 | $1.96 | 44d | 1 | 0.97mi |
| 5806 Burgess Rd District Heights, MD | 2.0 | 1.0 | 1324 | $1,950 | $1.47 | 19d | 1 | 1.08mi |
| 2908 Walters Ln Unit 1 District Heights, MD | 2.0 | 1.0 | 1100 | $1,400 | $1.27 | 24d | 1 | 1.11mi |
| 6525 Kenova St District Heights, MD | 2.0 | 1.0 | 1075 | $1,500 | $1.40 | 44d | 1 | 1.26mi |
| 1634 Brooksquare Dr Capitol Heights, MD | 3.0 | 1.5 | 1317 | $2,250 | $1.71 | 5d | 1 | 1.27mi |
| 6311 Pennsylvania Ave District Heights, MD | 1.0–3.0 | 1.0 | 883 | $1,867 | $2.11 | 1d | 10 | 1.35mi |
| 1209 Brooke Rd Capitol Heights, MD | 3.0 | 2.0 | 1000 | $3,200 | $3.20 | 19d | 1 | 1.36mi |
| 6024 Surrey Square Ln District Heights, MD | 1.0–3.0 | 1.0–2.0 | 1059 | $2,102 | $1.98 | 2d | 22 | 1.42mi |
| 2354 Seton Way District Heights, MD | 2.0 | 2.5 | 1200 | $2,500 | $2.08 | 44d | 1 | 1.45mi |
| 7169 Cross St Unit T1 District Heights, MD | 2.0 | 2.0 | 906 | $1,850 | $2.04 | 18d | 1 | 1.47mi |
| 3253 Walters Ln District Heights, MD | 1.0–3.0 | 1.0–1.5 | 941 | $2,060 | $2.19 | 3d | 17 | 1.48mi |
| 1935 Brooks Dr Capitol Heights, MD | 1.0–3.0 | 1.0–1.5 | 865 | $1,785 | $2.06 | 2d | 9 | 1.49mi |
HOA detail
- Monthly dues
- $110 · $1,320/yr
Listing history 24 events
-
2026-06-18days on market $150,000 Active 45 DOM
-
2026-06-17days on market $150,000 Active 44 DOM
-
2026-06-16days on market $150,000 Active 43 DOM
-
2026-06-15days on market $150,000 Active 42 DOM
-
2026-06-13days on market $150,000 Active 40 DOM
-
2026-06-10days on market $150,000 Active 36 DOM
-
2026-06-08days on market $150,000 Active 35 DOM
-
2026-06-07days on market $150,000 Active 34 DOM
-
2026-06-04days on market $150,000 Active 31 DOM
-
2026-06-03days on market $150,000 Active 30 DOM
-
2026-06-02days on market $150,000 Active 29 DOM
-
2026-06-01days on market $150,000 Active 28 DOM
-
2026-05-31days on market $150,000 Active 27 DOM
-
2026-05-04$150,000 Active 1446-char remark
-
2004-12-28soldstatus $199,900
-
2004-10-30soldstatus $199,900 234-char remark
Show marketing remark (234 chars)
If your looking for elegant this ia a must see townhome. Nice End unit with deck. Marble floors in dining droom and bathrooms. Ceramic tile in kitchen and wood flooring in living room. Full bath in master beddroom. Too see is to sell.
-
2004-08-30historical 234-char remark
Show marketing remark (234 chars)
If your looking for elegant this ia a must see townhome. Nice End unit with deck. Marble floors in dining droom and bathrooms. Ceramic tile in kitchen and wood flooring in living room. Full bath in master beddroom. Too see is to sell.
-
2004-08-23$199,900 234-char remark
Show marketing remark (234 chars)
If your looking for elegant this ia a must see townhome. Nice End unit with deck. Marble floors in dining droom and bathrooms. Ceramic tile in kitchen and wood flooring in living room. Full bath in master beddroom. Too see is to sell.
-
2001-05-18soldstatus $120,500
-
2001-03-12historical
-
2001-02-09$120,500
-
1996-04-01soldstatus $137,825
-
1994-03-14soldstatus $1,000,000
-
1990-05-02soldstatus $880,000
ⓘ Source: listings_history table (triggers on properties + properties_extension) + one-shot
backfill from property_details.listing_events for pre-trigger history.
Tax reassessment forecast MD · Partial reset (capped growth)
- Current annual tax
- $4,705 · $392/mo
- Projected year-2 tax
- $4,705 · $392/mo
- Expected delta
- $0/yr ($0/mo · 0.0%)
ⓘ Screening estimate from a state-policy table — verify with the county assessor before closing.
Climate risk First Street
- Flood 1/10 Low FEMA zone X (unshaded) · 0% chance over 30 yrs
- Wildfire 1/10 Low
- Heat 8/10 Severe 7 d/yr ≥102°F today · 16 d/yr by 30 yrs out
- Wind 5/10 Major 23% chance of damaging wind over 30 yrs
- Air quality 4/10 Moderate 4 unhealthy d/yr today · 5 by 30 yrs out
Nearby sold comps map
Loading sold comps map…
Walkable amenities ~0.75 mi
Loading nearby amenities…
Taxation est. · year 1
- Rental income
- $26,076
- − Mortgage interest
- −$8,402
- − Property taxes
- −$4,705
- − Insurance
- −$750
- − Repairs & maintenance
- −$2,086
- − Management
- −$2,086
- − HOA
- −$1,320
- − Depreciation
- −$4,364
- Taxable income
- $2,363
- Est. tax owed @ 24.0%
- −$567
- After-tax cash flow
- $3,819/yr
For passive investors: Depreciation is non-cash, so a rental often shows a tax loss while cash-flowing — sheltering income. Rental losses are passive: they offset passive income freely, and up to $25,000/yr can offset ordinary (W-2) income if you actively participate and your MAGI is under $100k (phasing out to $0 by $150k); unused losses carry forward. On sale, claimed depreciation is recaptured at up to 25%, and gains may owe capital-gains tax (a 1031 exchange can defer both). Figures are a year-1 estimate at your 24.0% rate — not tax advice; consult a CPA.
Schools (NCES district)
- District
- Prince George'S County Public Schools
- NCES district ID
- 2400510
- Math proficiency
- 8% ▼ -11.00%
- Reading proficiency
- 24% ▼ -9.00%
- Median HH income
- $73,967
- Composite
- 16.82/100
- National rank
- #9151
- State rank
- #21 of 24 in MD
Livability — Walker Mill
- Score
- 63/100
- State rank
- #300
- US rank
- #15588
Category grades
Schools grade is shown separately in the Schools card above.
Census & demographics
- Census place
- Walker Mill, MD
- County
- Prince Georges County · 919,866 people
- City population
- 39,439
- Metro
- Washington-Arlington-Alexandria, DC-VA-MD-WV
- Population (ZIP)
- 38,301
- Household income
- $76,298
- Rent vs Own
- Severe rent burden
- 2132.0
Population outlook (Prince George's County) Hauer SSP2
- Today (2025)
- 1,005,426 people
- By 2030
- 1,048,416 · +4.3%
- By 2040
- 1,123,425 · +11.7%
- By 2050
- 1,183,220 · +17.7%
- By 2075
- 1,306,202 · +29.9%
- By 2100
- 1,408,179 · +40.1%
Race, ethnicity, and origin ACS 2023
- Neighborhood character
- Predominantly Black (86%)
- Race & ethnicity
- Black 86% Hispanic / Latino 7% Two or more races 5% White 2%
- Hispanic origin (detail)
- Foreign-born
- 8% · Canada
- Languages at home
- 89% English-only · Spanish 6% French/Haitian/Cajun 1%
Political lean MEDSL · Prince George's
- 2024 margin
- Solid D (+75.2) · D 86.3% · R 11.2% · Other 2.5%
- 2008→2024 swing
- -3.3pp toward R · 2008: 78.5pp · 2024: 75.2pp
- All cycles
- 2024: D+75.2 2020: D+80.5 2016: D+81.0 2012: D+80.9 2008: D+78.5
Not yet ingested
- Civics
- —
Market trends
- HPI YoY
- ▼ -67.90%
- Current HPI
- 289.095
- Rent YoY
- ▲ 2.00%
- Metro
- Washington-Arlington-Alexandria, DC-VA-MD-WV
- State GDP YoY
- ▲ 2.97%
- F500 in state
- 12
Industry mix (Fortune 500 HQ in MD)
| Industry | F500 HQs | Revenue |
|---|---|---|
| Aerospace / Defense | 1 | $71B |
|
||
| Utilities | 1 | $25B |
|
||
| Hotels | 1 | $24B |
|
||
| Consumer Goods | 1 | $7B |
|
||
| Real Estate | 1 | $6B |
|
||
| Chemicals | 1 | $2B |
|
||
Price history
-83.0% since first listed11 events — show timeline
- 2026-05-04 Listed $150,000 BRIGHT MLS
- 2004-12-28 Sold (Public Records) $199,900 Public Records
- 2004-10-30 Sold (MLS) $199,900 MRIS
- 2004-08-30 Delisted — MRIS
- 2004-08-23 Listed $199,900 MRIS
- 2001-05-18 Sold (MLS) $120,500 MRIS
- 2001-03-12 Delisted — MRIS
- 2001-02-09 Listed $120,500 MRIS
- 1996-04-01 Sold (Public Records) $137,825 Public Records
- 1994-03-14 Sold (Public Records) $1,000,000 Public Records
- 1990-05-02 Sold (Public Records) $880,000 Public Records
Property tax history
+6.2%/yrLatest (2025): $4,705 · +6.9% YoY. Source: county tax records.
Cash-flow waterfall
monthlySold comps — $/sqft
last 12 mo · ≤1 miLoading sold comps…