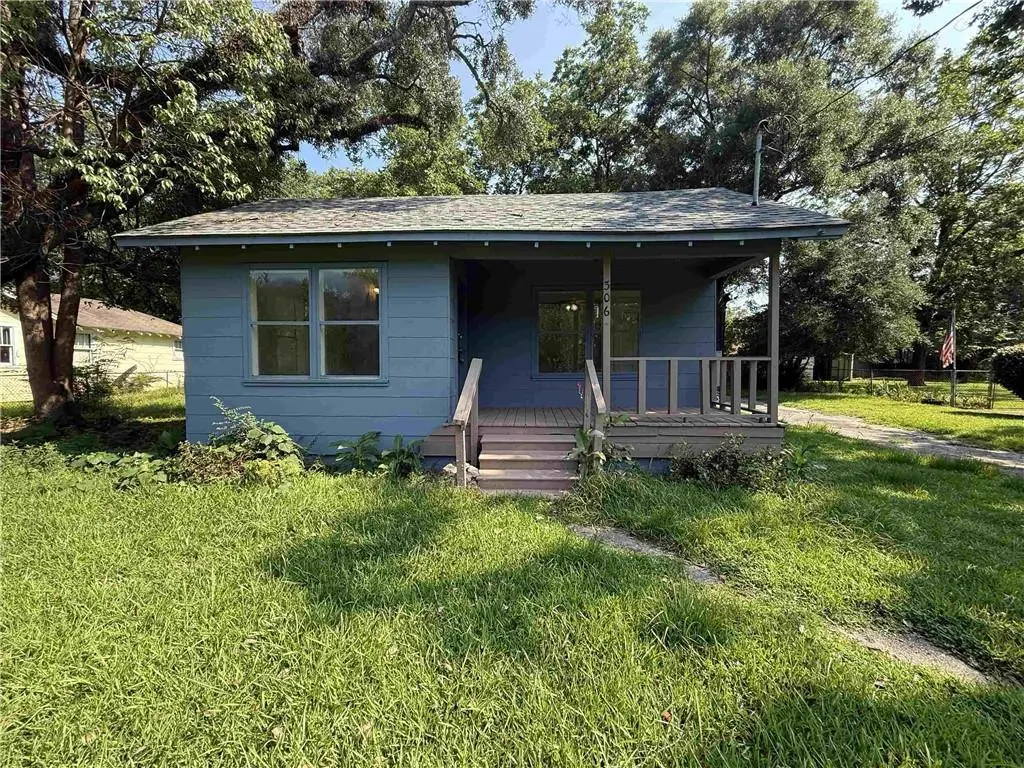
306 Hillside Dr · Chickasaw, AL
Flood risk 1/10 · Minimal
- FEMA flood zone
- X (unshaded)
- Chance of flooding over 30 yrs
- 0.0%
- Est. flood insurance / yr
- $507 – $1,088
Fire risk 3/10 · Minor
- Est. fire insurance / yr
- $916 – $1,700
Heat risk 9/10 · Severe
- Hot days now (above 104°F)
- 7 days/yr
- Hot days in 30 yrs
- 21 days/yr
Wind risk 9/10 · Severe
- Chance of severe wind over 30 yrs
- 99.0%
Air-quality risk 2/10 · Minimal
- Unhealthy air days now
- 1 days/yr
- Unhealthy air days in 30 yrs
- 2 days/yr
Risk factors via First Street. Map © Google.
Why this score? — see what drove the B grade
The composite is a weighted blend of 9 inputs, each scored 0–100. Each bar is that input's sub-score; the figure is the points it added to the 100-point composite (weight × sub-score).
- Cash flow +21.9/30.0
- ARV discount +15.0/15.0
- Appreciation +10.0/10.0
- DSCR +7.0/10.0
- Schools +5.0/10.0
- 1% rule +4.7/10.0
- Livability +3.1/5.0
- Rent growth +2.5/5.0
- Condition / age +2.5/5.0
$105,000
🖨 Deal sheet 📄 Offer letter ✓ Due diligence
Listing remarks
Cute as a button and in a fantastic location! This charming home sits on an oversized, level lot and has recently been remodeled, making it move in ready. Step inside to find fresh interior paint and durable luxury vinyl plank flooring throughout. If you're looking for a home that's both affordable and adorable, this may be the perfect fit. Major updates include a roof installed in 2021 and a central HVAC system replaced in 2019, providing peace of mind for years to come. The thoughtfully designed floor plan offers a surprisingly spacious feel, featuring a large living room and well-separated bedrooms for added privacy. Outside, you'll love the expansive backyard and the back deck overlooki
Key facts
- Recently remodeled
- Large living room
- Oversized level lot
Tags
Property features AI
Exterior
- Parking: Driveway; 2 parking spaces
- Utilities: Electricity available; 110V electrical service; Public sewer
- Home design: Single family residence; Residential property; Built in 1959; Composition roof; Pillar/post/pier foundation
- Construction: Asbestos construction materials
- Exterior features: Private yard; Partial fencing; View
Interior
- Kitchen: Gas range; Stained cabinets
- Bedrooms: 3 bedrooms
- Bathrooms: 1 full bathroom
- Heating & cooling: Central heating (natural gas); Central air; Ceiling fans
- Interior features: Other; No fireplace; Separate dining room
- Laundry & utility: 220V outlet in laundry
Neighborhood map
What this means for you Summary
Snapshot
- This is a 3-bed/1.0-bath single-family listed at $105k.
Deal economics
- At list price, monthly cash flow is $166 ($2k/yr) — positive.
- The deal already cash-flows at list — no discount required.
- To meet the 1% rule (rent ≥ 1% of price), the offer needs to be $102k (2.8% below list).
- Recommended offer: $102k (2.8% below list) — sets the bar for 1% rule.
Location & tenants
- Location reads 61/100 on livability (#237 in AL) — a middle-class / working-renter tenant base. Strengths: cost of living A+, housing A-, health & safety B; Watch: crime D-, amenities F, commute F.
- Zoned schools: Chickasaw City Elementary School (math 7% / reading 30%, grade F, #480 of 627 statewide, top 77%, 550 students, 80% FRL); Chickasaw City High School (math 5% / reading 15%, grade F, #248 of 305 statewide, top 82%, 224 students, 91% FRL).
- Market conditions: 45 active listings in the ZIP; 6 comparable units currently listed for rent nearby; rentals at typical pace (median 21d on market — plan ~3-4 weeks tenant-placement turnaround); 1,678 units permitted in Mobile County in 2024 (264 in 5+ unit buildings).
Forward outlook
- In year one you build about $11k of equity ($726 loan paydown + $10k appreciation (10.0% local appreciation)).
- Mobile County population projected to shrink 8% by 2050 — rents likely to lag national; underwrite the cash flow, not the appreciation.
- At projected returns (10.0% appreciation + 3.0% rent growth), your $29k cash investment doubles in ~3 years — after that, you're playing with house money.
- By year 4, paydown + projected appreciation supports a ~$40k cash-out refi (75% LTV) — recoverable capital for the next deal without selling this one.
Negotiation context
- Only 5 days on market — expect competitive offers; lowballing is unlikely to land.
- Current owner paid $75k; 40% above their basis — modest negotiation headroom, anchor on the comps not their cost.
Risks & watch-outs
- Watch-outs: built in 1959 — expect roof / HVAC / electrical / plumbing capex.
- Climate carrying-cost: severe wind risk, 99% chance of damaging wind over 30y; extreme-heat days projected 7→21/yr by 2055 (HVAC capex compounding) — expect insurance premiums to compound above CPI over the hold.
Questions for the listing agent
- Built in 1959 — when were the roof, HVAC, electrical panel, plumbing, and water heater last replaced?
- Is there a deadline driving the sale (1031 exchange, divorce, estate, relocation)? That informs how much negotiation room exists.
- Schools are F-rated, which usually means shorter tenancies and higher turnover. Who's the typical renter profile here, and what's been the actual vacancy rate?
- Crime grade is D in this area — have there been break-ins, vandalism, or insurance claims at this property in the last 3 years? What carrier currently insures it and at what premium?
- What's the average days-on-market for RENTAL listings here right now (not sales)? A rising rental-DOM trend means longer vacancies and softer asking-rent achievability than the comps imply.
- What's the recent tenant-quality profile in this submarket — average credit score on applications, eviction rate, late-payment / NSF rate, and stable-employment percentage? A property-management company in the area should have these aggregated.
- How much new for-sale + rental construction is in the pipeline within 1–3 miles? Heavy new supply typically softens prices + rents 12–24 months out; constrained supply supports both.
Investment metrics
- 1% rule
- 0.97% ✗
- Cap rate
- 8.19%
- Cash-on-cash
- 6.77%
- DSCR
- 1.30
- GRM
- 8.6
CMA / ARV
- ARV (on-the-fly)
- $127,676
- Comps found
- 12
Show comp detail 12 sales within ~0.75 mi
| Address | Dist | Beds/Ba | Sqft | Sold | Price | $/sf | Match |
|---|---|---|---|---|---|---|---|
| 206 Hillside Dr | 0.18mi | 3/1.0 | 1,080 (-0%) | 1mo | $80,000 | $74 | 91 |
| 309 Valley Rd | 0.06mi | 3/1.5 | 1,200 (+11%) | 9mo | $167,000 | $139 | 70 |
| 9 Elizabeth Ave | 0.58mi | 3/1.0 | 1,080 (-0%) | 6mo | $96,000 | $89 | 68 |
| 316 1st St | 0.52mi | 3/1.0 | 1,147 (+6%) | 0mo | $97,899 | $85 | 66 |
| 110 Idlewood Dr | 0.29mi | 3/2.0 | 1,192 (+10%) | 1mo | $160,000 | $134 | 65 |
| 714 Townsend Cir | 0.46mi | 3/1.5 | 1,161 (+7%) | 1mo | $137,000 | $118 | 63 |
| 116 Hillside Dr | 0.24mi | 3/1.0 | 960 (-11%) | 9mo | $105,000 | $109 | 63 |
| 605 Townsend Cir | 0.58mi | 3/1.0 | 1,099 (+2%) | 9mo | $115,000 | $105 | 63 |
| 419 Sutherland Cir | 0.36mi | 3/1.0 | 1,196 (+10%) | 6mo | $144,900 | $121 | 61 |
| 108 Idlewood Dr | 0.30mi | 3/1.5 | 1,200 (+11%) | 8mo | $156,000 | $130 | 59 |
| 206 1st St | 0.62mi | 2/1.5 (-1) | 1,049 (-3%) | 3mo | $115,000 | $110 | 57 |
| 97 Grant St | 0.72mi | 2/1.0 (-1) | 1,032 (-5%) | 1mo | $137,500 | $133 | 53 |
Match score weights: distance 35% · size 25% · config 20% · recency 20%. Top-matched comps best support the ARV.
Projected returns pro-forma
10.0% appreciation · 3.0% rent growth · sell at horizon
- IRR
- 29.2%
- Equity multiple
- 3.30×
- Total profit
- $67,720
- Equity at exit
- $94,592
- IRR
- 25.3%
- Equity multiple
- 7.50×
- Total profit
- $191,038
- Equity at exit
- $203,992
Cash invested: $29,400 (down + closing). Projections, not guarantees.
Landlord ↔ Tenant lean methodology
- Overall (STATE)
- 90 Strongly Landlord-Friendly
- State Alabama
- 90 Strongly Landlord-Friendly · R+15
- County
- — inherits STATE
- City
- — inherits STATE
ZIP-level market 36611
- Home prices YoY
- 7.0%
- Active inventory
- 45
- Price-to-rent
- 8.6×
Monthly cashflow live
- Estimated rent
- $1,020 high interval (Pro) →
- Mortgage (P&I)
- −$551
- Tax from tax record
- −$46 /mo · $549/yr
- Insurance
- −$44
- HOA
- −$0
- Vacancy / Maint / Mgmt
- −$214
- Net cashflow
- $166
Break-even live
UW: 25.0% down · 7.5% · 30yr · 1.5% tax · 5.0% vac · 8.0% maint · 8.0% mgmt
Financing live
Cash to close
- Down payment
- $26,250
- Closing costs
- $3,150
- Reserves months
- —
- Total cash needed
- —
Loan-product check · same deal, 3 products live
Conventional
25% down · 7.5% · 30yr
- Down + closing
- —
- Monthly P&I
- —
- Monthly cashflow
- —
- DSCR
- —
- Eligible?
- —
Personal DTI + credit; lowest rate.
DSCR
20% down · 8.5% · 30yr
- Down + closing
- —
- Monthly P&I
- —
- Monthly cashflow
- —
- DSCR
- —
- Eligible?
- —
No personal income docs; deal must DSCR.
Hard money
10% down · 12.0% · 12mo
- Down + closing
- —
- Monthly P&I
- —
- Monthly cashflow
- —
- DSCR
- —
- Eligible?
- —
Short-term bridge; refi at stabilization.
Rent comps 6 comps
| Address | Beds | Baths | Sqft | Rent | $/sqft | DOM | Units | Dist |
|---|---|---|---|---|---|---|---|---|
| 78 Lee St Chickasaw, AL | 3.0 | 1.0 | 1412 | $1,100 | $0.78 | 43d | 1 | 0.55mi |
| 311 Grant St Chickasaw, AL | 2.0 | 1.0 | 1000 | $850 | $0.85 | 43d | 1 | 0.58mi |
| 101 Grant St Chickasaw, AL | 3.0 | 1.0 | 1383 | $895 | $0.65 | 13d | 1 | 0.73mi |
| 55 Thompson Blvd Chickasaw, AL | 3.0 | 1.0 | 939 | $1,500 | $1.60 | 21d | 1 | 0.75mi |
| 156 9th Ave Chickasaw, AL | 2.0 | 1.0 | 720 | $950 | $1.32 | 21d | 1 | 1.02mi |
| 3 Southern St Chickasaw, AL | 3.0 | 1.0 | 1108 | $795 | $0.72 | 13d | 1 | 1.03mi |
Listing history 7 events
-
2026-06-18days on market $105,000 Active 5 DOM
-
2026-06-17days on market $105,000 Active 4 DOM
-
2026-06-16days on market $105,000 Active 3 DOM
-
2026-06-15days on market $105,000 Active 2 DOM
-
2026-06-14$105,000 Active 1 DOM
-
2026-06-13remarks 699-char remark
-
2026-06-13$105,000 Active 1 DOM
ⓘ Source: listings_history table (triggers on properties + properties_extension) + one-shot
backfill from property_details.listing_events for pre-trigger history.
Tax reassessment forecast AL · Resets to sale price
- Current annual tax
- $549 · $46/mo
- Projected year-2 tax
- $549 · $46/mo
- Expected delta
- $0/yr ($0/mo · 0.0%)
ⓘ Screening estimate from a state-policy table — verify with the county assessor before closing.
Climate risk First Street
- Flood 1/10 Low FEMA zone X (unshaded) · 0% chance over 30 yrs
- Wildfire 3/10 Moderate
- Heat 9/10 Extreme 7 d/yr ≥104°F today · 21 d/yr by 30 yrs out
- Wind 9/10 Extreme 99% chance of damaging wind over 30 yrs
- Air quality 2/10 Low 1 unhealthy d/yr today · 2 by 30 yrs out
Nearby sold comps map
Loading sold comps map…
Walkable amenities ~0.75 mi
Loading nearby amenities…
Taxation est. · year 1
- Rental income
- $12,245
- − Mortgage interest
- −$5,882
- − Property taxes
- −$549
- − Insurance
- −$525
- − Repairs & maintenance
- −$980
- − Management
- −$980
- − Depreciation
- −$3,055
- Taxable income
- $275
- Est. tax owed @ 24.0%
- −$66
- After-tax cash flow
- $1,926/yr
For passive investors: Depreciation is non-cash, so a rental often shows a tax loss while cash-flowing — sheltering income. Rental losses are passive: they offset passive income freely, and up to $25,000/yr can offset ordinary (W-2) income if you actively participate and your MAGI is under $100k (phasing out to $0 by $150k); unused losses carry forward. On sale, claimed depreciation is recaptured at up to 25%, and gains may owe capital-gains tax (a 1031 exchange can defer both). Figures are a year-1 estimate at your 24.0% rate — not tax advice; consult a CPA.
Schools (NCES district)
No district data.
Livability — Chickasaw
- Score
- 61/100
- State rank
- #237
- US rank
- #17438
Category grades
Schools grade is shown separately in the Schools card above.
Census & demographics
- Census place
- Chickasaw, AL
- City population
- 6,367
- Population (ZIP)
- 6,367
Population outlook (Mobile County) Hauer SSP2
- Today (2025)
- 415,303 people
- By 2030
- 411,755 · -0.9%
- By 2040
- 399,670 · -3.8%
- By 2050
- 382,616 · -7.9%
- By 2075
- 337,353 · -18.8%
- By 2100
- 283,391 · -31.8%
Race, ethnicity, and origin ACS 2023
- Neighborhood character
- Diverse neighborhood (Simpson 0.56)
- Race & ethnicity
- Black 55% White 38% Two or more races 4% Hispanic / Latino 2% Asian 2%
- Common ancestry
- Lithuanian 2% Serbian 1% Italian 1%
- Foreign-born
- 3% · Canada, China
- Languages at home
- 98% English-only · Spanish 1% French/Haitian/Cajun 1%
Political lean MEDSL · Mobile
- 2024 margin
- R (+16.4) · D 41.3% · R 57.7%
- 2008→2024 swing
- -7.7pp toward R · 2008: -8.7pp · 2024: -16.4pp
- All cycles
- 2024: R+16.4 2020: R+11.9 2016: R+13.9 2012: R+9.3 2008: R+8.7
Not yet ingested
- Civics
- —
Market trends
- HPI YoY
- ▲ 12.90%
- Current HPI
- 196.621
- Rent YoY
- —
- Metro
- —
- State GDP YoY
- ▲ 2.94%
- F500 in state
- 4
Industry mix (Fortune 500 HQ in AL)
| Industry | F500 HQs | Revenue |
|---|---|---|
| Financial Services | 1 | $8B |
|
||
| Healthcare | 1 | $5B |
|
||
Price history
+40.0% since first listed2 events — show timeline
- 2026-06-12 Listed $105,000 GCMLS AL
- 2019-02-05 Sold (Public Records) $75,000 Public Records
Property tax history
+1.8%/yrLatest (2025): $549 · +12.8% YoY. Source: county tax records.
Cash-flow waterfall
monthlySold comps — $/sqft
last 12 mo · ≤1 miLoading sold comps…