4808-1/2 OLD CLIFFS Rd · San Diego, CA
Flood risk 1/10 · Minimal
- FEMA flood zone
- X (unshaded)
- Chance of flooding over 30 yrs
- 0.0%
- Est. flood insurance / yr
- $507 – $1,088
Fire risk 4/10 · Minor
- Est. fire insurance / yr
- $659 – $1,223
Heat risk 4/10 · Minor
- Hot days now (above 92°F)
- 7 days/yr
- Hot days in 30 yrs
- 20 days/yr
Wind risk 1/10 · Minimal
- Chance of severe wind over 30 yrs
- —
Air-quality risk 3/10 · Minor
- Unhealthy air days now
- 4 days/yr
- Unhealthy air days in 30 yrs
- 4 days/yr
Risk factors via First Street. Map © Google.
Why this score? — see what drove the B- grade
The composite is a weighted blend of 9 inputs, each scored 0–100. Each bar is that input's sub-score; the figure is the points it added to the 100-point composite (weight × sub-score).
- Cash flow +30.0/30.0
- 1% rule +10.0/10.0
- DSCR +10.0/10.0
- ARV discount +7.5/15.0
- Livability +3.8/5.0
- Condition / age +2.5/5.0
- Rent growth +2.3/5.0
- Schools +2.2/10.0
- Appreciation +0.0/10.0
$95,000
🖨 Deal sheet 📄 Offer letter ✓ Due diligence
Listing remarks
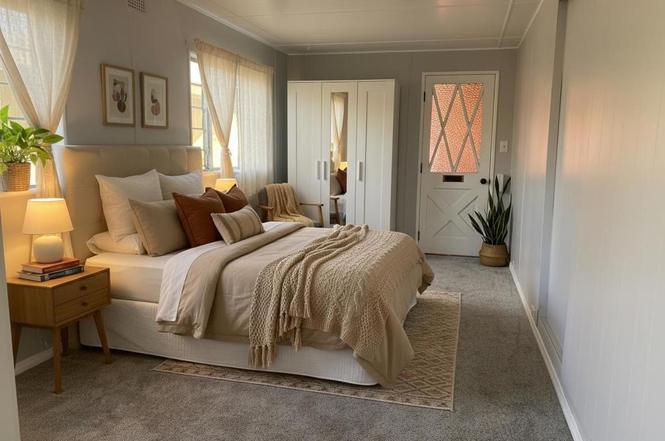
Welcome to this Charming Manufactured home at The Cliffs: its a 55+/21+ Community. The park is very quiet and gives off the feel of Mayberry in San Diego its move-in ready. Featuring numerous updates including a beautifully remodeled bathroom and shower. Skylights in both the kitchen and main bathroom fill the space with natural light and moon Light in the evening, while the open-concept layout seamlessly connects the kitchen and living room for easy entertaining. Convenience is key with a newer stackable washer and dryer located in the kitchen, and the main bathroom is equipped with safety rails for added accessibility. The second bedroom has its own entrance from home perfect for a roomma
Key facts
- Lush backyard
- Clubhouse
- Remodeled bathroom
Tags
Property features AI
Finance
- Other: Park name: THE CLIFFS; Directions: Mission Gorge to Old Cliffs Rd. Enter park and follow main road to the end, then turn right.
- HOA & community: Senior community; Manager approval required; Pets allowed; Community is mountainous; Land lease: $1,837 monthly
Exterior
- Parking: Two parking spaces; Two carport spaces
- Utilities: Public sewer
- Home design: Single-story mobile home (Model: FLAMINGO, 20 x 39); Mobile home remains on property
- Construction: Estimated lot size; Living area per public records
- Exterior features: Back yard; Community pool; Three storage sheds
Interior
- Kitchen: Kitchen included
- Bedrooms: Primary bedroom
- Bathrooms: One full bathroom; One half bathroom
- Heating & cooling: Central furnace
- Interior features: One-level home with front door entry; Has view
- Laundry & utility: Laundry inside
Neighborhood map
What this means for you Summary
Snapshot
- This is a 2-bed/1.5-bath manufactured listed at $95k.
Deal economics
- At list price, monthly cash flow is $2k ($18k/yr) — positive.
- The deal already cash-flows at list — no discount required.
- Meets the 1% rule at list price ($3k rent vs $95k).
- Recommended offer: $84k (12.0% below list) — sets the bar for market timing.
- Cap rate 25.7% vs local median 2.0% in San Diego — top-decile yield for the area; either an underpriced asset or a hidden risk that comps aren't pricing in. Stress-test before assuming the spread holds.
Location & tenants
- Location reads 75/100 on livability (#123 in CA, #4,206 nationally) — a middle-class / working-renter tenant base. Strengths: amenities A+, commute A+, employment A+; Watch: health & safety C-, crime D+, cost of living F.
- San Diego Unified (urban): math 19% / reading 29% proficiency, ranked #393 of 517 in CA (top 76%) — low school quality limits family demand, transient renter base, plan for 1-2y turnover.
- Market conditions: Rents soft (-0.7%/yr); 111 active listings in the ZIP; 26 comparable units currently listed for rent nearby; rentals leasing fast (median 5d on market — plan ~1-2 weeks tenant-placement turnaround); high-income renter base; 11,759 units permitted in San Diego County in 2024 (7,244 in 5+ unit buildings).
Forward outlook
- Local home prices are declining (-3.0%/yr); year-one equity from $657 of loan paydown is wiped out by about $3k of value loss. Plan a longer hold.
- San Diego County population projected at +20% by 2050 — long-run rental-demand tailwind backs the buy-and-hold thesis.
- At projected returns (-3.0% appreciation + 0.0% rent growth), your $27k cash investment doubles in ~2 years — after that, you're playing with house money.
Negotiation context
- It's been on market 310 days — a 12% lower offer ($84k) is reasonable based on typical stale-listing flexibility.
Questions for the listing agent
- It's been on market 310 days. Have you received any prior offers? Is the seller open to a 12% concession, seller financing, or rate buy-down credit?
- Built in 1961 — when were the roof, HVAC, electrical panel, plumbing, and water heater last replaced?
- Why hasn't it sold? Are there any deal-killer items the seller is aware of (foundation, flood, title, zoning, code violations)?
- Is there a deadline driving the sale (1031 exchange, divorce, estate, relocation)? That informs how much negotiation room exists.
- Schools are B-rated — typically a magnet for longer-tenancy family renters. What's the average tenant stay here, and is there a school-zone premium baked into asking?
- Crime grade is D in this area — have there been break-ins, vandalism, or insurance claims at this property in the last 3 years? What carrier currently insures it and at what premium?
- What's the average days-on-market for RENTAL listings here right now (not sales)? A rising rental-DOM trend means longer vacancies and softer asking-rent achievability than the comps imply.
- What's the recent tenant-quality profile in this submarket — average credit score on applications, eviction rate, late-payment / NSF rate, and stable-employment percentage? A property-management company in the area should have these aggregated.
- How much new for-sale + rental construction is in the pipeline within 1–3 miles? Heavy new supply typically softens prices + rents 12–24 months out; constrained supply supports both.
Investment metrics
- 1% rule
- 2.92% ✓
- Cap rate
- 25.66%
- Cash-on-cash
- 69.16%
- DSCR
- 4.08
- GRM
- 2.9
CMA / ARV
No comps found within radius.
Projected returns pro-forma
-3.0% appreciation · 0.0% rent growth · sell at horizon
- IRR
- 65.2%
- Equity multiple
- 3.79×
- Total profit
- $74,167
- Equity at exit
- $14,165
- IRR
- 68.6%
- Equity multiple
- 6.98×
- Total profit
- $159,092
- Equity at exit
- $8,214
Cash invested: $26,600 (down + closing). Projections, not guarantees.
Landlord ↔ Tenant lean methodology
- Overall (STATE)
- 18 Strongly Tenant-Friendly
- State California
- 18 Strongly Tenant-Friendly · D+13
- County
- — inherits STATE
- City
- — inherits STATE
ZIP-level market 92120
- Rents YoY
- -0.7%
- Active inventory
- 111
- Price-to-rent
- 2.9×
Monthly cashflow live
- Estimated rent
- $2,772 high interval (Pro) →
- Mortgage (P&I)
- −$498
- Tax est. 1.5%
- −$119 /mo · $1,425/yr
- Insurance
- −$40
- HOA
- −$0
- Vacancy / Maint / Mgmt
- −$582
- Net cashflow
- $1,533
Break-even live
UW: 25.0% down · 7.5% · 30yr · 1.5% tax · 5.0% vac · 8.0% maint · 8.0% mgmt
Financing live
Cash to close
- Down payment
- $23,750
- Closing costs
- $2,850
- Reserves months
- —
- Total cash needed
- —
Loan-product check · same deal, 3 products live
Conventional
25% down · 7.5% · 30yr
- Down + closing
- —
- Monthly P&I
- —
- Monthly cashflow
- —
- DSCR
- —
- Eligible?
- —
Personal DTI + credit; lowest rate.
DSCR
20% down · 8.5% · 30yr
- Down + closing
- —
- Monthly P&I
- —
- Monthly cashflow
- —
- DSCR
- —
- Eligible?
- —
No personal income docs; deal must DSCR.
Hard money
10% down · 12.0% · 12mo
- Down + closing
- —
- Monthly P&I
- —
- Monthly cashflow
- —
- DSCR
- —
- Eligible?
- —
Short-term bridge; refi at stabilization.
Rent comps 26 comps
| Address | Beds | Baths | Sqft | Rent | $/sqft | DOM | Units | Dist |
|---|---|---|---|---|---|---|---|---|
| 5215 Irwin Ave San Diego, CA | 3.0 | 1.0 | 1125 | $2,775 | $2.47 | 24d | 1 | 0.45mi |
| 6850 Mission Gorge Rd San Diego, CA | 1.0–2.0 | 1.0–2.0 | 867 | $3,496 | $4.03 | 2d | 13 | 0.55mi |
| 6675 Mission Gorge Rd San Diego, CA | 1.0 | 1.0 | 626 | $1,845 | $2.95 | 3d | 2 | 0.76mi |
| 4580 Zion Ave San Diego, CA | 1.0–2.0 | 1.0–2.0 | 911 | $2,725 | $2.99 | 3d | 14 | 0.77mi |
| 3828 Pendiente Ct San Diego, CA | 1.0–2.0 | 1.0–2.0 | 775 | $3,195 | $4.12 | 2d | 22 | 0.84mi |
| 11233 Tierrasanta Blvd #30 San Diego, CA | 1.0 | 1.5 | 854 | $2,750 | $3.22 | 24d | 1 | 0.88mi |
| 7647 Mission Gorge Rd #20 San Diego, CA | 2.0 | 2.0 | 1035 | $2,895 | $2.80 | 8d | 1 | 0.93mi |
| 7659 Mission Gorge Rd San Diego, CA | 2.0 | 2.0 | 1035 | $2,950 | $2.85 | 17d | 1 | 1.00mi |
| 6352 Holabird St San Diego, CA | 2.0 | 2.0 | 870 | $3,750 | $4.31 | 3d | 1 | 1.04mi |
| 4580 Glacier Ave San Diego, CA | 2.0 | 1.5 | 800 | $2,250 | $2.81 | 5d | 1 | 1.07mi |
| 7671 Mission Gorge Rd San Diego, CA | 2.0 | 2.0 | 1090 | $2,745 | $2.52 | 5d | 2 | 1.08mi |
| 7677 Mission Gorge Rd San Diego, CA | 2.0 | 2.0 | 1100 | $2,875 | $2.61 | 8d | 1 | 1.11mi |
| 4555 Vandever Ave San Diego, CA | 2.0 | 2.0 | 900 | $2,650 | $2.94 | 4d | 1 | 1.18mi |
| 7757 Margerum Ave San Diego, CA | 2.0 | 2.0 | 912 | $2,700 | $2.96 | 24d | 1 | 1.22mi |
| 7707 Mission Gorge Rd San Diego, CA | 1.0 | 1.0 | 587 | $2,490 | $4.24 | 15d | 11 | 1.25mi |
| 6120 Decena Dr #207 San Diego, CA | 1.0 | 1.0 | 891 | $1,500 | $1.68 | 4d | 1 | 1.28mi |
| 6120 Decena Dr #207 San Diego, CA | 2.0 | 2.0 | 891 | $2,895 | $3.25 | 4d | 1 | 1.28mi |
| 5310 Adobe Falls Rd San Diego, CA | 2.0 | 1.0–2.0 | 685 | $2,645 | $3.86 | 2d | 5 | 1.33mi |
| 5360 Adobe Falls Rd San Diego, CA | 2.0 | 1.0 | 1000 | $2,395 | $2.40 | 3d | 4 | 1.38mi |
| 5360 Adobe Falls Rd San Diego, CA | 2.0 | 1.0 | 1000 | $2,398 | $2.40 | 22d | 4 | 1.38mi |
| 4440 Twain Ave San Diego, CA | 3.0 | 1.0–2.0 | 1007 | $3,730 | $3.70 | 2d | 74 | 1.38mi |
| 4525 Twain Ave San Diego, CA | 1.0 | 1.0 | 700 | $2,188 | $3.12 | 3d | 3 | 1.39mi |
| 6555 Ambrosia Dr San Diego, CA | 1.0–3.0 | 1.0–2.5 | 985 | $3,370 | $3.42 | 2d | 11 | 1.41mi |
| 5432 Adobe Falls Rd #12 San Diego, CA | 2.0 | 1.5 | 884 | $2,350 | $2.66 | 5d | 1 | 1.41mi |
| 4560 Mission Gorge Pl San Diego, CA | 3.0 | 1.0–3.0 | 1066 | $3,968 | $3.72 | 2d | 29 | 1.43mi |
| 5503 Adobe Falls Rd San Diego, CA | 3.0 | 2.0 | 1116 | $2,995 | $2.68 | 24d | 1 | 1.46mi |
Listing history 16 events
-
2026-06-18days on market $95,000 Active 310 DOM
-
2026-06-17days on market $95,000 Active 309 DOM
-
2026-06-16days on market $95,000 Active 308 DOM
-
2026-06-15days on market $95,000 Active 307 DOM
-
2026-06-13days on market $95,000 Active 305 DOM
-
2026-06-09days on market $95,000 Active 301 DOM
-
2026-06-08days on market $95,000 Active 300 DOM
-
2026-06-07days on market $95,000 Active 299 DOM
-
2026-06-04days on market $95,000 Active 296 DOM
-
2026-06-03days on market $95,000 Active 295 DOM
-
2026-06-01days on market $95,000 Active 293 DOM
-
2026-05-31days on market $95,000 Active 292 DOM
-
2026-02-12price $95,000
-
2026-01-13price $125,000
-
2025-11-11price $129,900
-
2025-08-12$132,000 Active
ⓘ Source: listings_history table (triggers on properties + properties_extension) + one-shot
backfill from property_details.listing_events for pre-trigger history.
Climate risk First Street
- Flood 1/10 Low FEMA zone X (unshaded) · 0% chance over 30 yrs
- Wildfire 4/10 Moderate
- Heat 4/10 Moderate 7 d/yr ≥92°F today · 20 d/yr by 30 yrs out
- Wind 1/10 Low
- Air quality 3/10 Moderate 4 unhealthy d/yr today · 4 by 30 yrs out
Nearby sold comps map
Loading sold comps map…
Walkable amenities ~0.75 mi
Loading nearby amenities…
Taxation est. · year 1
- Rental income
- $33,260
- − Mortgage interest
- −$5,321
- − Property taxes
- −$1,425
- − Insurance
- −$475
- − Repairs & maintenance
- −$2,661
- − Management
- −$2,661
- − Depreciation
- −$2,764
- Taxable income
- $17,953
- Est. tax owed @ 24.0%
- −$4,309
- After-tax cash flow
- $14,088/yr
For passive investors: Depreciation is non-cash, so a rental often shows a tax loss while cash-flowing — sheltering income. Rental losses are passive: they offset passive income freely, and up to $25,000/yr can offset ordinary (W-2) income if you actively participate and your MAGI is under $100k (phasing out to $0 by $150k); unused losses carry forward. On sale, claimed depreciation is recaptured at up to 25%, and gains may owe capital-gains tax (a 1031 exchange can defer both). Figures are a year-1 estimate at your 24.0% rate — not tax advice; consult a CPA.
Schools (NCES district)
- District
- San Diego Unified
- NCES district ID
- 0634320
- Math proficiency
- 19% ▼ -29.00%
- Reading proficiency
- 29% ▼ -28.00%
- Median HH income
- $61,673
- Composite
- 22.31/100
- National rank
- #8135
- State rank
- #393 of 517 in CA
Livability — San Diego
- Score
- 75/100
- State rank
- #123
- US rank
- #4206
Category grades
Schools grade is shown separately in the Schools card above.
Census & demographics
- Census place
- San Diego, CA
- County
- San Diego County · 3,178,799 people
- City population
- 1,397,612
- Metro
- San Diego-Chula Vista-Carlsbad, CA
- Population (ZIP)
- 31,915
- Household income
- $120,661
- Rent vs Own
- Severe rent burden
- 1287.0
Population outlook (San Diego County) Hauer SSP2
- Today (2025)
- 3,678,185 people
- By 2030
- 3,856,546 · +4.8%
- By 2040
- 4,171,407 · +13.4%
- By 2050
- 4,421,607 · +20.2%
- By 2075
- 4,831,599 · +31.4%
- By 2100
- 4,832,502 · +31.4%
Race, ethnicity, and origin ACS 2023
- Neighborhood character
- Diverse neighborhood (Simpson 0.59)
- Race & ethnicity
- White 60% Hispanic / Latino 20% Two or more races 12% Asian 7% Black 6%
- Hispanic origin (detail)
- Mexican 15%
- Common ancestry
- Italian 3% Lithuanian 3% Slovak 2%
- Foreign-born
- 12% · Canada, China, Vietnam
- Languages at home
- 79% English-only · Spanish 10% Arabic 2% Other Indo-European 2%
Political lean MEDSL · San Diego
- 2024 margin
- D (+16.8) · D 56.9% · R 40.1% · Other 2.9%
- 2008→2024 swing
- +6.6pp toward D · 2008: 10.2pp · 2024: 16.8pp
- All cycles
- 2024: D+16.8 2020: D+22.8 2016: D+17.8 2012: D+5.1 2008: D+10.2
Not yet ingested
- Civics
- —
Market trends
- HPI YoY
- ▼ -704.25%
- Current HPI
- 387.6538
- Rent YoY
- ▼ -0.70%
- Metro
- San Diego-Chula Vista-Carlsbad, CA
- State GDP YoY
- ▲ 3.21%
- F500 in state
- 116
Industry mix (Fortune 500 HQ in CA)
| Industry | F500 HQs | Revenue |
|---|---|---|
| Technology | 27 | $1,492B |
|
||
| Financial Services | 3 | $174B |
|
||
| Retail | 3 | $44B |
|
||
| Insurance | 3 | $26B |
|
||
| Media / Entertainment | 2 | $115B |
|
||
| Pharmaceuticals / Biotech | 2 | $62B |
|
||
Price history
-28.0% since first listed4 events — show timeline
- 2026-02-12 Price Changed $95,000 CRMLS
- 2026-01-13 Price Changed $125,000 CRMLS
- 2025-11-11 Price Changed $129,900 CRMLS
- 2025-08-12 Listed $132,000 CRMLS
Cash-flow waterfall
monthlySold comps — $/sqft
last 12 mo · ≤1 miLoading sold comps…