356 Lucas Rd · Browndell, TX
Flood risk 1/10 · Minimal
- FEMA flood zone
- X (unshaded)
- Chance of flooding over 30 yrs
- 0.0%
- Est. flood insurance / yr
- $507 – $1,088
Fire risk 6/10 · Moderate
- Est. fire insurance / yr
- $1,222 – $2,270
Heat risk 8/10 · Major
- Hot days now (above 111°F)
- 7 days/yr
- Hot days in 30 yrs
- 22 days/yr
Wind risk 8/10 · Major
- Chance of severe wind over 30 yrs
- 96.0%
Air-quality risk 1/10 · Minimal
- Unhealthy air days now
- 0 days/yr
- Unhealthy air days in 30 yrs
- 0 days/yr
Risk factors via First Street. Map © Google.
Why this score? — see what drove the C grade
The composite is a weighted blend of 9 inputs, each scored 0–100. Each bar is that input's sub-score; the figure is the points it added to the 100-point composite (weight × sub-score).
- Cash flow +21.2/30.0
- ARV discount +7.5/15.0
- DSCR +6.8/10.0
- Appreciation +5.6/10.0
- 1% rule +4.3/10.0
- Schools +4.3/10.0
- Rent growth +2.5/5.0
- Condition / age +2.5/5.0
- Livability +2.4/5.0
$94,900
🖨 Deal sheet 📄 Offer letter ✓ Due diligence
Listing remarks
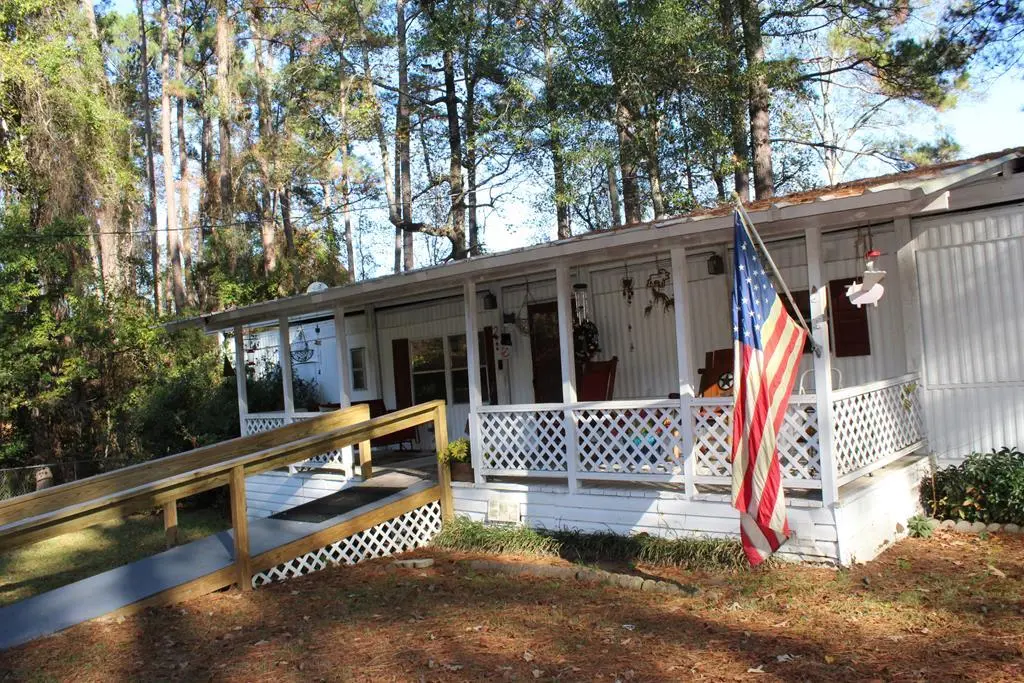
MOTIVATED SELLER! Great Weekend Home Near Sam Rayburn Lake! Just miles from beautiful Sam Rayburn, this clean and well-kept 2-bedroom, 1.5-bath manufactured home is ready for your next getaway. The home features a durable metal roof cover, a spacious covered front porch complete with a relaxing swing, and a fully fenced yard with ample room to store recreational items. Located on a quiet dead-end street, you'll enjoy peace, privacy, and plenty of outdoor space to unwind and entertain. Don't miss your chance to see this weekend jewel — call today for a showing!
Key facts
- Covered front porch
- Sam rayburn lake
- Metal roof cover
Tags
Property features AI
Exterior
- Parking: Attached parking
- Security: Smoke detector(s)
- Utilities: Public water
- Home design: Residential mobile home; Located on a 0.5-acre lot
- Exterior features: Fenced yard; Metal roof
Interior
- Flooring: Vinyl; Wood
- Bathrooms: 1 full bathroom; 1 half bathroom
- Heating & cooling: Central heating (electric); Central air conditioning
- Interior features: Vinyl and wood flooring; Central heating; Electric heating; Central air conditioning; Smoke detector(s)
Neighborhood map
What this means for you Summary
Snapshot
- This is a 2-bed/1.5-bath manufactured listed at $95k.
Deal economics
- At list price, monthly cash flow is $138 ($2k/yr) — positive.
- The deal already cash-flows at list — no discount required.
- To meet the 1% rule (rent ≥ 1% of price), the offer needs to be $89k (6.5% below list).
- Recommended offer: $89k (6.5% below list) — sets the bar for 1% rule.
Location & tenants
- Location reads 48/100 on livability (#1,526 in TX) — a working-class tenant base; expect higher turnover. Strengths: cost of living A+; Watch: housing C-, schools F, crime F.
- Brookeland ISD (rural): math 43% / reading 53% proficiency, ranked #445 of 1,141 in TX (top 39%) — families likely to look elsewhere, expect single-tenant / working-renter base with shorter leases.
- Market conditions: 419 active listings in the ZIP; 45 units permitted in Jasper County in 2024 (0 in 5+ unit buildings).
Forward outlook
- In year one you build about $2k of equity ($656 loan paydown + $1k appreciation (1.3% local appreciation)).
- Jasper County population projected at -15% by 2050 — secular population decline; favor cash flow + early exit over multi-decade hold.
- At projected returns (1.3% appreciation + 3.0% rent growth), your $27k cash investment doubles in ~7 years — after that, you're playing with house money.
Negotiation context
- It's been on market 47 days — a 3% lower offer ($92k) is reasonable based on typical stale-listing flexibility.
- 2 sale attempts with the ask held roughly flat each time — persistent listings suggest the price (not the market) is what's stuck; bring a comps-based counter.
Risks & watch-outs
- Climate carrying-cost: severe wind risk, 96% chance of damaging wind over 30y; major wildfire risk; extreme-heat days projected 7→22/yr by 2055 (HVAC capex compounding) — expect insurance premiums to compound above CPI over the hold.
Questions for the listing agent
- It's been on market 47 days. Have you received any prior offers? Is the seller open to a 7% concession, seller financing, or rate buy-down credit?
- Is there a deadline driving the sale (1031 exchange, divorce, estate, relocation)? That informs how much negotiation room exists.
- Schools are F-rated, which usually means shorter tenancies and higher turnover. Who's the typical renter profile here, and what's been the actual vacancy rate?
- Crime grade is F in this area — have there been break-ins, vandalism, or insurance claims at this property in the last 3 years? What carrier currently insures it and at what premium?
- What's the average days-on-market for RENTAL listings here right now (not sales)? A rising rental-DOM trend means longer vacancies and softer asking-rent achievability than the comps imply.
- What's the recent tenant-quality profile in this submarket — average credit score on applications, eviction rate, late-payment / NSF rate, and stable-employment percentage? A property-management company in the area should have these aggregated.
- How much new for-sale + rental construction is in the pipeline within 1–3 miles? Heavy new supply typically softens prices + rents 12–24 months out; constrained supply supports both.
Investment metrics
- 1% rule
- 0.93% ✗
- Cap rate
- 8.04%
- Cash-on-cash
- 6.23%
- DSCR
- 1.28
- GRM
- 8.9
CMA / ARV
No comps found within radius.
Projected returns pro-forma
1.28% appreciation · 3.0% rent growth · sell at horizon
- IRR
- 8.6%
- Equity multiple
- 1.44×
- Total profit
- $11,808
- Equity at exit
- $33,773
- IRR
- 12.3%
- Equity multiple
- 2.54×
- Total profit
- $40,847
- Equity at exit
- $45,965
Cash invested: $26,572 (down + closing). Projections, not guarantees.
Landlord ↔ Tenant lean methodology
- Overall (STATE)
- 87 Strongly Landlord-Friendly
- State Texas
- 87 Strongly Landlord-Friendly · R+5
- County
- — inherits STATE
- City
- — inherits STATE
ZIP-level market 75931
- Home prices YoY
- 0.6%
- Active inventory
- 419
- Price-to-rent
- 8.9×
Monthly cashflow live
- Estimated rent
- $887 medium interval (Pro) →
- Mortgage (P&I)
- −$498
- Tax from tax record
- −$26 /mo · $309/yr
- Insurance
- −$40
- HOA
- −$0
- Vacancy / Maint / Mgmt
- −$186
- Net cashflow
- $138
Break-even live
UW: 25.0% down · 7.5% · 30yr · 1.5% tax · 5.0% vac · 8.0% maint · 8.0% mgmt
Financing live
Cash to close
- Down payment
- $23,725
- Closing costs
- $2,847
- Reserves months
- —
- Total cash needed
- —
Loan-product check · same deal, 3 products live
Conventional
25% down · 7.5% · 30yr
- Down + closing
- —
- Monthly P&I
- —
- Monthly cashflow
- —
- DSCR
- —
- Eligible?
- —
Personal DTI + credit; lowest rate.
DSCR
20% down · 8.5% · 30yr
- Down + closing
- —
- Monthly P&I
- —
- Monthly cashflow
- —
- DSCR
- —
- Eligible?
- —
No personal income docs; deal must DSCR.
Hard money
10% down · 12.0% · 12mo
- Down + closing
- —
- Monthly P&I
- —
- Monthly cashflow
- —
- DSCR
- —
- Eligible?
- —
Short-term bridge; refi at stabilization.
Listing history 12 events
-
2026-06-18days on market $94,900 Active 47 DOM
-
2026-06-17days on market $94,900 Active 46 DOM
-
2026-06-17pricedays on market $94,900 Active 45 DOM
-
2026-06-09days on market $98,000 Active 43 DOM
-
2026-06-08days on market $98,000 Active 42 DOM
-
2026-06-08days on market $98,000 Active 41 DOM
-
2026-06-07days on market $98,000 Active 40 DOM
-
2026-06-03days on market $98,000 Active 37 DOM
-
2026-06-02days on market $98,000 Active 36 DOM
-
2026-06-01days on market $98,000 Active 35 DOM
-
2026-05-31days on market $98,000 Active 34 DOM
-
2025-12-10$98,000 Active 572-char remark
ⓘ Source: listings_history table (triggers on properties + properties_extension) + one-shot
backfill from property_details.listing_events for pre-trigger history.
Tax reassessment forecast TX · Resets to sale price
- Current annual tax
- $309 · $26/mo
- Projected year-2 tax
- $1,737 · $145/mo
- Expected delta
- +$1,427/yr (+$119/mo · 461.6%)
ⓘ Screening estimate from a state-policy table — verify with the county assessor before closing.
Climate risk First Street
- Flood 1/10 Low FEMA zone X (unshaded) · 0% chance over 30 yrs
- Wildfire 6/10 Major
- Heat 8/10 Severe 7 d/yr ≥111°F today · 22 d/yr by 30 yrs out
- Wind 8/10 Severe 96% chance of damaging wind over 30 yrs
- Air quality 1/10 Low 0 unhealthy d/yr today · 0 by 30 yrs out
Nearby sold comps map
Loading sold comps map…
Walkable amenities ~0.75 mi
Loading nearby amenities…
Taxation est. · year 1
- Rental income
- $10,646
- − Mortgage interest
- −$5,316
- − Property taxes
- −$309
- − Insurance
- −$474
- − Repairs & maintenance
- −$852
- − Management
- −$852
- − Depreciation
- −$2,761
- Taxable income
- $83
- Est. tax owed @ 24.0%
- −$20
- After-tax cash flow
- $1,635/yr
For passive investors: Depreciation is non-cash, so a rental often shows a tax loss while cash-flowing — sheltering income. Rental losses are passive: they offset passive income freely, and up to $25,000/yr can offset ordinary (W-2) income if you actively participate and your MAGI is under $100k (phasing out to $0 by $150k); unused losses carry forward. On sale, claimed depreciation is recaptured at up to 25%, and gains may owe capital-gains tax (a 1031 exchange can defer both). Figures are a year-1 estimate at your 24.0% rate — not tax advice; consult a CPA.
Schools (NCES district)
- District
- Brookeland ISD
- NCES district ID
- 4811520
- Math proficiency
- 43% ▼ -1.00%
- Reading proficiency
- 53% ▼ -1.00%
- Median HH income
- $45,145
- Composite
- 42.74/100
- National rank
- #6781
- State rank
- #445 of 1141 in TX
Livability — Browndell
- Score
- 48/100
- State rank
- #1526
- US rank
- #26081
Category grades
Schools grade is shown separately in the Schools card above.
Census & demographics
- Census place
- Browndell, TX
- Population (ZIP)
- 2,209
Population outlook (Jasper County) Hauer SSP2
- Today (2025)
- 33,986 people
- By 2030
- 32,965 · -3.0%
- By 2040
- 30,908 · -9.1%
- By 2050
- 28,893 · -15.0%
- By 2075
- 24,828 · -26.9%
- By 2100
- 19,987 · -41.2%
Race, ethnicity, and origin ACS 2023
- Neighborhood character
- Predominantly White (93%)
- Race & ethnicity
- White 93% Two or more races 4% Hispanic / Latino 3% Black 1%
- Common ancestry
- Italian 4% Lithuanian 2% Romanian 1%
- Foreign-born
- 2%
- Languages at home
- 97% English-only · German/W. Germanic 2% Other Indo-European 1%
Political lean MEDSL · Jasper
- 2024 margin
- Solid R (+66.6) · D 16.5% · R 83.1%
- 2008→2024 swing
- -24.6pp toward R · 2008: -42.0pp · 2024: -66.6pp
- All cycles
- 2024: R+66.6 2020: R+61.4 2016: R+59.9 2012: R+48.4 2008: R+42.0
Not yet ingested
- Civics
- —
Market trends
- HPI YoY
- ▲ 1.28%
- Current HPI
- 231.9835
- Rent YoY
- —
- Metro
- —
- State GDP YoY
- ▲ 3.95%
- F500 in state
- 110
Industry mix (Fortune 500 HQ in TX)
| Industry | F500 HQs | Revenue |
|---|---|---|
| Energy | 16 | $1,198B |
|
||
| Technology | 5 | $198B |
|
||
| Engineering / Construction | 4 | $72B |
|
||
| Energy Services | 3 | $60B |
|
||
| Utilities | 3 | $41B |
|
||
| Healthcare | 2 | $330B |
|
||
Price history
-3.2% since first listed3 events — show timeline
- 2026-06-16 Relisted — Deep East Texas MLS
- 2026-06-16 Price Changed $94,900 Deep East Texas MLS
- 2025-12-10 Listed $98,000 Deep East Texas MLS
Property tax history
+1.1%/yrLatest (2025): $309 · -0.2% YoY. Source: county tax records.
Cash-flow waterfall
monthlySold comps — $/sqft
last 12 mo · ≤1 miLoading sold comps…