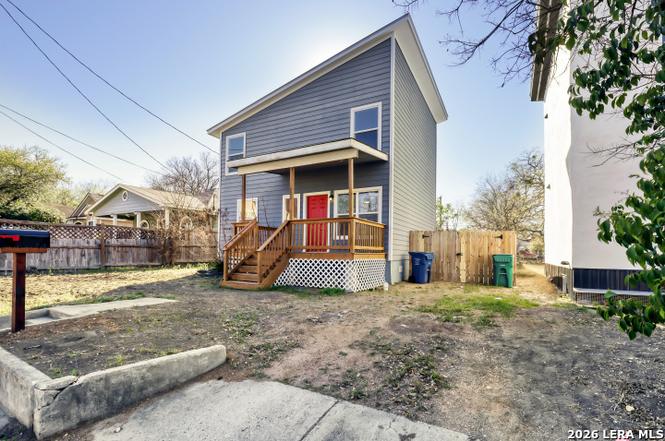
323 Moselle · San Antonio, TX
Flood risk 1/10 · Minimal
- FEMA flood zone
- X (unshaded)
- Chance of flooding over 30 yrs
- 0.0%
- Est. flood insurance / yr
- $507 – $1,088
Fire risk 1/10 · Minimal
- Est. fire insurance / yr
- $1,222 – $2,270
Heat risk 8/10 · Major
- Hot days now (above 108°F)
- 7 days/yr
- Hot days in 30 yrs
- 22 days/yr
Wind risk 6/10 · Moderate
- Chance of severe wind over 30 yrs
- 74.0%
Air-quality risk 2/10 · Minimal
- Unhealthy air days now
- 1 days/yr
- Unhealthy air days in 30 yrs
- 1 days/yr
Risk factors via First Street. Map © Google.
Why this score? — see what drove the D- grade
The composite is a weighted blend of 9 inputs, each scored 0–100. Each bar is that input's sub-score; the figure is the points it added to the 100-point composite (weight × sub-score).
- Appreciation +10.0/10.0
- ARV discount +7.5/15.0
- Cash flow +6.3/30.0
- Rent growth +4.0/5.0
- Livability +4.0/5.0
- Condition / age +2.5/5.0
- 1% rule +2.1/10.0
- Schools +1.3/10.0
- DSCR +0.6/10.0
$199,800
🖨 Deal sheet 📄 Offer letter ✓ Due diligence
Listing remarks MLS
This beautiful modern home design is a 3 bedroom/3 full bath house is a must see. This lovely house has new flooring, new light fixtures and ceiling fans, stainless steel appliances, refrigerator is virturally staged, new tubs and shower and vanities, new cabinets and seamless counter tops. You can enjoy a quiet starry night out in your front porch or entertain family and friends out on your spacious backyard. Buyer to pay for survey. Located near Ingram Park Mall, San Antonio Mission Stadium, San Antonio Event Center, and Sea World. Please verify all measurements.
Key facts
- Walk-in closet
- Eat-in kitchen
- Private bathroom
Tags
Property features AI
Finance
- Other: Possession at closing/funding; For sale
- Financial info: Down payment assistance resources available
- HOA & community: Located in the Los Jardines subdivision
Exterior
- Utilities: City water and sewer service; Electric service via CPS; City garbage service; Drought-tolerant landscaping and low-flow toilet
- Home design: Pre-owned; Approximately 8 years old
- Construction: Composition roof
- Exterior features: Siding exterior; Recent rehab
Interior
- Kitchen: Eat-in kitchen; Breakfast bar; Refrigerator; Dishwasher; Vent fan
- Bedrooms: Primary bedroom on lower level with walk-in closet and ceiling fan; Three bedrooms approximately 18 x 11
- Flooring: Vinyl flooring; Laminate flooring
- Bathrooms: Three full bathrooms; Primary bath with tub/shower combination (approx. 9 x 9)
- Heating & cooling: Central heating (electric); Central air conditioning
- Interior features: Ceiling fans throughout; Eat-in kitchen with breakfast bar and open floor plan; Utility room inside; Walk-in closets; All window coverings remain; City garbage service
- Laundry & utility: Washer and dryer included; Utility room inside
Neighborhood map
What this means for you Summary
Snapshot
- This is a 3-bed/3.0-bath single-family listed at $200k.
Deal economics
- At list price, monthly cash flow is $-356 ($-4k/yr) — negative.
- To cash-flow at today's rent, offer at most $137k (31.4% below list).
- To meet the 1% rule (rent ≥ 1% of price), the offer needs to be $142k (28.8% below list).
- Recommended offer: $137k (31.4% below list) — sets the bar for cash-flow.
Location & tenants
- Location reads 80/100 on livability (#31 in TX, #1,616 nationally) — a professional / high-income tenant draw. Strengths: amenities A+, commute A+, cost of living A+; Watch: schools C-, crime F.
- Edgewood ISD (urban): math 12% / reading 21% proficiency, ranked #812 of 826 in TX (top 98%) — low school quality limits family demand, transient renter base, plan for 1-2y turnover.
- Market conditions: Rents rising fast (+6.1%/yr); 127 active listings in the ZIP; lower-income renter base — watch delinquency; 8,308 units permitted in Bexar County in 2024 (2,506 in 5+ unit buildings).
- This rent runs 40% of the median local income ($43k/yr) — at the standard rent-burdened threshold; future hikes will face affordability resistance.
Forward outlook
- In year one you build about $21k of equity ($1k loan paydown + $20k appreciation (10.0% local appreciation)).
- Bexar County population projected at +50% by 2050 — long-run rental-demand tailwind backs the buy-and-hold thesis.
- By year 2, paydown + projected appreciation supports a ~$34k cash-out refi (75% LTV) — recoverable capital for the next deal without selling this one.
Negotiation context
- It's been on market 97 days — a 9% lower offer ($182k) is reasonable based on typical stale-listing flexibility.
- 4 sale attempts since 14y ago with the ask held roughly flat each time — persistent listings suggest the price (not the market) is what's stuck; bring a comps-based counter.
Risks & watch-outs
- Climate carrying-cost: major wind risk, 74% chance of damaging wind over 30y; extreme-heat days projected 7→22/yr by 2055 (HVAC capex compounding) — expect insurance premiums to compound above CPI over the hold.
Questions for the listing agent
- What do current leases actually rent for vs. the listed asking? Can we see a recent rent roll and the last 12 months of T-12 income?
- It's been on market 97 days. Have you received any prior offers? Is the seller open to a 31% concession, seller financing, or rate buy-down credit?
- Why hasn't it sold? Are there any deal-killer items the seller is aware of (foundation, flood, title, zoning, code violations)?
- Is there a deadline driving the sale (1031 exchange, divorce, estate, relocation)? That informs how much negotiation room exists.
- Crime grade is F in this area — have there been break-ins, vandalism, or insurance claims at this property in the last 3 years? What carrier currently insures it and at what premium?
- The area grade is low — what's the realistic commute time and amenity access for the typical tenant pool here? Any planned neighborhood developments (good or bad) we should know about?
- What's the average days-on-market for RENTAL listings here right now (not sales)? A rising rental-DOM trend means longer vacancies and softer asking-rent achievability than the comps imply.
- What's the recent tenant-quality profile in this submarket — average credit score on applications, eviction rate, late-payment / NSF rate, and stable-employment percentage? A property-management company in the area should have these aggregated.
- How much new for-sale + rental construction is in the pipeline within 1–3 miles? Heavy new supply typically softens prices + rents 12–24 months out; constrained supply supports both.
Investment metrics
- 1% rule
- 0.71% ✗
- Cap rate
- 4.16%
- Cash-on-cash
- -7.63%
- DSCR
- 0.66
- GRM
- 11.7
CMA / ARV
No comps found within radius.
Projected returns pro-forma
10.0% appreciation · 6.13% rent growth · sell at horizon
- IRR
- 19.8%
- Equity multiple
- 2.62×
- Total profit
- $90,874
- Equity at exit
- $179,996
- IRR
- 18.9%
- Equity multiple
- 6.30×
- Total profit
- $296,224
- Equity at exit
- $388,167
Cash invested: $55,944 (down + closing). Projections, not guarantees.
Landlord ↔ Tenant lean methodology
- Overall (STATE)
- 87 Strongly Landlord-Friendly
- State Texas
- 87 Strongly Landlord-Friendly · R+5
- County
- — inherits STATE
- City
- — inherits STATE
ZIP-level market 78237
- Home prices YoY
- 14.1%
- Rents YoY
- 6.1%
- Active inventory
- 127
- Price-to-rent
- 11.7×
Monthly cashflow live
- Estimated rent
- $1,423 medium interval (Pro) →
- Mortgage (P&I)
- −$1,048
- Tax from tax record
- −$349 /mo · $4,186/yr
- Insurance
- −$83
- HOA
- −$0
- Vacancy / Maint / Mgmt
- −$299
- Net cashflow
- $-356
Break-even live
UW: 25.0% down · 7.5% · 30yr · 1.5% tax · 5.0% vac · 8.0% maint · 8.0% mgmt
Financing live
Cash to close
- Down payment
- $49,950
- Closing costs
- $5,994
- Reserves months
- —
- Total cash needed
- —
Loan-product check · same deal, 3 products live
Conventional
25% down · 7.5% · 30yr
- Down + closing
- —
- Monthly P&I
- —
- Monthly cashflow
- —
- DSCR
- —
- Eligible?
- —
Personal DTI + credit; lowest rate.
DSCR
20% down · 8.5% · 30yr
- Down + closing
- —
- Monthly P&I
- —
- Monthly cashflow
- —
- DSCR
- —
- Eligible?
- —
No personal income docs; deal must DSCR.
Hard money
10% down · 12.0% · 12mo
- Down + closing
- —
- Monthly P&I
- —
- Monthly cashflow
- —
- DSCR
- —
- Eligible?
- —
Short-term bridge; refi at stabilization.
Listing history 15 events
-
2026-06-18days on market $199,800 Active 97 DOM
-
2026-06-17days on market $199,800 Active 96 DOM
-
2026-06-16days on market $199,800 Active 95 DOM
-
2026-06-15days on market $199,800 Active 94 DOM
-
2026-06-13days on market $199,800 Active 92 DOM
-
2026-06-12days on market $199,800 Active 91 DOM
-
2026-06-09days on market $199,800 Active 88 DOM
-
2026-06-08days on market $199,800 Active 87 DOM
-
2026-06-08statusdays on market $199,800 Active 86 DOM
-
2026-06-07days on market $199,800 Price Change 85 DOM
-
2026-06-03days on market $199,800 Price Change 82 DOM
-
2026-06-02days on market $199,800 Price Change 81 DOM
-
2026-06-01days on market $199,800 Price Change 80 DOM
-
2026-05-31remarks 699-char remark
-
2026-05-31$199,800 Price Change 79 DOM
ⓘ Source: listings_history table (triggers on properties + properties_extension) + one-shot
backfill from property_details.listing_events for pre-trigger history.
Tax reassessment forecast TX · Resets to sale price
- Current annual tax
- $4,186 · $349/mo
- Projected year-2 tax
- $4,186 · $349/mo
- Expected delta
- $0/yr ($0/mo · 0.0%)
ⓘ Screening estimate from a state-policy table — verify with the county assessor before closing.
Climate risk First Street
- Flood 1/10 Low FEMA zone X (unshaded) · 0% chance over 30 yrs
- Wildfire 1/10 Low
- Heat 8/10 Severe 7 d/yr ≥108°F today · 22 d/yr by 30 yrs out
- Wind 6/10 Major 74% chance of damaging wind over 30 yrs
- Air quality 2/10 Low 1 unhealthy d/yr today · 1 by 30 yrs out
Nearby sold comps map
Loading sold comps map…
Walkable amenities ~0.75 mi
Loading nearby amenities…
Taxation est. · year 1
- Rental income
- $17,077
- − Mortgage interest
- −$11,192
- − Property taxes
- −$4,186
- − Insurance
- −$999
- − Repairs & maintenance
- −$1,366
- − Management
- −$1,366
- − Depreciation
- −$5,812
- Taxable loss
- −$7,844
- Est. tax savings @ 24.0%
- +$1,883
- After-tax cash flow
- $-2,384/yr
For passive investors: Depreciation is non-cash, so a rental often shows a tax loss while cash-flowing — sheltering income. Rental losses are passive: they offset passive income freely, and up to $25,000/yr can offset ordinary (W-2) income if you actively participate and your MAGI is under $100k (phasing out to $0 by $150k); unused losses carry forward. On sale, claimed depreciation is recaptured at up to 25%, and gains may owe capital-gains tax (a 1031 exchange can defer both). Figures are a year-1 estimate at your 24.0% rate — not tax advice; consult a CPA.
Schools (NCES district)
- District
- Edgewood ISD
- NCES district ID
- 4818150
- Math proficiency
- 12% ▼ -18.00%
- Reading proficiency
- 21% ▼ -5.00%
- Median HH income
- $27,419
- Composite
- 12.82/100
- National rank
- #9597
- State rank
- #812 of 826 in TX
Livability — San Antonio
- Score
- 80/100
- State rank
- #31
- US rank
- #1616
Category grades
Schools grade is shown separately in the Schools card above.
Census & demographics
- Census place
- San Antonio, TX
- County
- Bexar County · 1,990,555 people
- City population
- 1,806,925
- Metro
- San Antonio-New Braunfels, TX
- Population (ZIP)
- 37,379
- Household income
- $42,772
- Rent vs Own
- Severe rent burden
- 1185.0
Population outlook (Bexar County) Hauer SSP2
- Today (2025)
- 2,336,851 people
- By 2030
- 2,560,728 · +9.6%
- By 2040
- 3,020,569 · +29.3%
- By 2050
- 3,493,522 · +49.5%
- By 2075
- 4,668,459 · +99.8%
- By 2100
- 5,533,242 · +136.8%
Race, ethnicity, and origin ACS 2023
- Neighborhood character
- Predominantly Hispanic (95%)
- Race & ethnicity
- Hispanic / Latino 95% Two or more races 50% White 3% Native American 2% Black 2%
- Hispanic origin (detail)
- Mexican 84%
- Foreign-born
- 18% · Canada
- Languages at home
- 34% English-only · Spanish 66%
Political lean MEDSL · Bexar
- 2024 margin
- Lean D (+9.8) · D 54.3% · R 44.6% · Other 1.1%
- 2008→2024 swing
- +4.2pp toward D · 2008: 5.6pp · 2024: 9.8pp
- All cycles
- 2024: D+9.8 2020: D+18.2 2016: D+13.5 2012: D+4.6 2008: D+5.6
Not yet ingested
- Civics
- —
Market trends
- HPI YoY
- ▲ 30.52%
- Current HPI
- 247.7257
- Rent YoY
- ▲ 6.13%
- Metro
- San Antonio-New Braunfels, TX
- State GDP YoY
- ▲ 3.95%
- F500 in state
- 110
Industry mix (Fortune 500 HQ in TX)
| Industry | F500 HQs | Revenue |
|---|---|---|
| Energy | 16 | $1,198B |
|
||
| Technology | 5 | $198B |
|
||
| Engineering / Construction | 4 | $72B |
|
||
| Energy Services | 3 | $60B |
|
||
| Utilities | 3 | $41B |
|
||
| Healthcare | 2 | $330B |
|
||
Price history
+2484.7% since first listed19 events — show timeline
- 2026-05-28 Price Changed $199,800 LERA
- 2026-03-13 Listed $199,900 LERA
- 2024-10-30 Sold (Public Records) — Public Records
- 2021-11-15 Sold (Public Records) — Public Records
- 2021-11-08 Sold (MLS) — LERA
- 2021-10-24 Contingent — LERA
- 2021-09-28 Price Changed $194,999 LERA
- 2021-08-18 Price Changed $199,999 LERA
- 2021-08-06 Listed $201,000 LERA
- 2020-12-18 Sold (Public Records) — Public Records
- 2019-06-18 Sold (Public Records) — Public Records
- 2019-06-18 Sold (Public Records) — Public Records
- 2018-10-18 Sold (Public Records) — Public Records
- 2014-10-27 Sold (MLS) — LERA
- 2014-10-02 Pending — LERA
- 2013-12-02 Relisted — LERA
- 2013-11-30 Listing Removed — LERA
- 2012-11-27 Listed $7,730 LERA
- 2006-03-10 Sold (Public Records) — Public Records
Property tax history
+23.9%/yrLatest (2025): $4,186 · +2.2% YoY. Source: county tax records.
Cash-flow waterfall
monthlySold comps — $/sqft
last 12 mo · ≤1 miLoading sold comps…