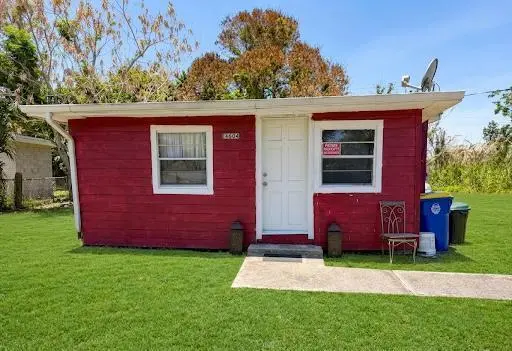
14604 SW 169th Ave · Indiantown, FL
Flood risk 1/10 · Minimal
- FEMA flood zone
- X (unshaded)
- Chance of flooding over 30 yrs
- 0.0%
- Est. flood insurance / yr
- $507 – $1,088
Fire risk 3/10 · Minor
- Est. fire insurance / yr
- $947 – $1,759
Heat risk 9/10 · Severe
- Hot days now (above 108°F)
- 7 days/yr
- Hot days in 30 yrs
- 24 days/yr
Wind risk 10/10 · Severe
- Chance of severe wind over 30 yrs
- 99.0%
Air-quality risk 2/10 · Minimal
- Unhealthy air days now
- 0 days/yr
- Unhealthy air days in 30 yrs
- 1 days/yr
Risk factors via First Street. Map © Google.
Why this score? — see what drove the B+ grade
The composite is a weighted blend of 9 inputs, each scored 0–100. Each bar is that input's sub-score; the figure is the points it added to the 100-point composite (weight × sub-score).
- Cash flow +30.0/30.0
- 1% rule +10.0/10.0
- DSCR +10.0/10.0
- Appreciation +8.3/10.0
- ARV discount +7.5/15.0
- Schools +4.5/10.0
- Livability +3.0/5.0
- Rent growth +2.5/5.0
- Condition / age +2.5/5.0
$150,000
🖨 Deal sheet 📄 Offer letter ✓ Due diligence
Listing remarks MLS
Vacant residential lot opportunity in growing Indiantown! This spacious parcel offers excellent potential for new construction, investment, or future development. No HOA and plenty of potential in a developing market. Great opportunity for builders, investors, and buyers looking for affordable land in Martin County.
Key facts
- No hoa
- Investor opportunity
- 5,000 sq ft lot
Tags
Property features AI
Finance
- Other: Pets allowed with no restrictions
- Financial info: No investor or income/expense details listed
- HOA & community: No HOA information listed
Exterior
- Parking: Two parking spaces
- Security: No security features listed
- Utilities: Public water; Public sewer; Electricity connected; Water connected; Sewer connected
- Home design: Single-family residence; One story; Resale property; Faces east
- Construction: Wood frame construction; Composition roof; Built using public records as building area source
- Exterior features: Not waterfront; Unpaved parking area
Interior
- Kitchen: Refrigerator; Electric cooktop
- Bedrooms: One bedroom on the main level
- Flooring: Wood flooring
- Bathrooms: One full bathroom (main level)
- Heating & cooling: Wall/window air conditioning units
- Interior features: No special interior features listed
- Laundry & utility: No specific laundry or utility appliances listed
Neighborhood map
What this means for you Summary
Snapshot
- This is a 2-bed/1.0-bath single-family listed at $150k.
Deal economics
- At list price, monthly cash flow is $855 ($10k/yr) — positive.
- The deal already cash-flows at list — no discount required.
- Meets the 1% rule at list price ($2k rent vs $150k).
- Cap rate 13.1% vs local median 10.9% in Indiantown — meaningfully above typical; check what's discounted (condition, days-on-market, listing class) to confirm the premium yield is real.
Location & tenants
- Location reads 59/100 on livability (#829 in FL) — a working-class tenant base; expect higher turnover. Strengths: cost of living A+, housing A+; Watch: amenities F, commute F, employment F.
- Martin (suburban): math 52% / reading 53% proficiency, ranked #24 of 73 in FL (top 33%) — acceptable for families but not a draw, mixed tenant base, ~2y average lease.
- Zoned schools: Warfield Elementary School (math 22% / reading 19%, grade F, #2,094 of 2,144 statewide, top 98%, 686 students, 79% FRL); Indiantown Middle School (math 42% / reading 29%, grade F, #414 of 571 statewide, top 73%, 646 students, 75% FRL); South Fork High School (math 36% / reading 48%, grade F, #275 of 667 statewide, top 42%, 1,810 students, 51% FRL) — zoned schools average 68% FRL vs 41% district-wide (27 pts higher); higher-poverty schools than district average — tighter screening recommended.
- Zoned-school proficiency averages 33% at this address vs 52% district-wide (-20 pts) — the specific schools serving this property underperform the Martin average; the district grade overstates school quality for this exact location.
- Market conditions: 135 active listings in the ZIP; 2 comparable units currently listed for rent nearby; 737 units permitted in Martin County in 2024 (167 in 5+ unit buildings).
Forward outlook
- In year one you build about $11k of equity ($1k loan paydown + $10k appreciation (6.7% local appreciation)).
- Martin County population projected at +19% by 2050 — long-run rental-demand tailwind backs the buy-and-hold thesis.
- At projected returns (6.7% appreciation + 3.0% rent growth), your $42k cash investment doubles in ~2 years — after that, you're playing with house money.
- By year 4, paydown + projected appreciation supports a ~$38k cash-out refi (75% LTV) — recoverable capital for the next deal without selling this one.
Negotiation context
- Only 14 days on market — expect competitive offers; lowballing is unlikely to land.
- 4 sale attempts with the ask held roughly flat each time — persistent listings suggest the price (not the market) is what's stuck; bring a comps-based counter.
Risks & watch-outs
- Watch-outs: built in 1959 — expect roof / HVAC / electrical / plumbing capex.
- Climate carrying-cost: severe wind risk, 99% chance of damaging wind over 30y; extreme-heat days projected 7→24/yr by 2055 (HVAC capex compounding) — expect insurance premiums to compound above CPI over the hold.
Questions for the listing agent
- Built in 1959 — when were the roof, HVAC, electrical panel, plumbing, and water heater last replaced?
- Is there a deadline driving the sale (1031 exchange, divorce, estate, relocation)? That informs how much negotiation room exists.
- Schools are F-rated, which usually means shorter tenancies and higher turnover. Who's the typical renter profile here, and what's been the actual vacancy rate?
- What's the average days-on-market for RENTAL listings here right now (not sales)? A rising rental-DOM trend means longer vacancies and softer asking-rent achievability than the comps imply.
- What's the recent tenant-quality profile in this submarket — average credit score on applications, eviction rate, late-payment / NSF rate, and stable-employment percentage? A property-management company in the area should have these aggregated.
- How much new for-sale + rental construction is in the pipeline within 1–3 miles? Heavy new supply typically softens prices + rents 12–24 months out; constrained supply supports both.
Investment metrics
- 1% rule
- 1.56% ✓
- Cap rate
- 13.13%
- Cash-on-cash
- 24.42%
- DSCR
- 2.09
- GRM
- 5.3
CMA / ARV
- ARV (median comp)
- $317,749
- List price
- $150,000
- Delta
- -52.79%
- Verdict
- UNDERPRICED
- Comps
- 11 within 1.0 mi
Projected returns pro-forma
6.65% appreciation · 3.0% rent growth · sell at horizon
- IRR
- 37.1%
- Equity multiple
- 3.47×
- Total profit
- $103,633
- Equity at exit
- $100,538
- IRR
- 34.0%
- Equity multiple
- 7.21×
- Total profit
- $260,905
- Equity at exit
- $187,968
Cash invested: $42,000 (down + closing). Projections, not guarantees.
Landlord ↔ Tenant lean methodology
- Overall (STATE)
- 87 Strongly Landlord-Friendly
- State Florida
- 87 Strongly Landlord-Friendly · R+3
- County
- — inherits STATE
- City
- — inherits STATE
ZIP-level market 34956
- Home prices YoY
- 1.2%
- Active inventory
- 135
- Price-to-rent
- 5.3×
Monthly cashflow live
- Estimated rent
- $2,343 medium interval (Pro) →
- Mortgage (P&I)
- −$787
- Tax from tax record
- −$147 /mo · $1,764/yr
- Insurance
- −$62
- HOA
- −$0
- Vacancy / Maint / Mgmt
- −$492
- Net cashflow
- $855
Break-even live
UW: 25.0% down · 7.5% · 30yr · 1.5% tax · 5.0% vac · 8.0% maint · 8.0% mgmt
Financing live
Cash to close
- Down payment
- $37,500
- Closing costs
- $4,500
- Reserves months
- —
- Total cash needed
- —
Loan-product check · same deal, 3 products live
Conventional
25% down · 7.5% · 30yr
- Down + closing
- —
- Monthly P&I
- —
- Monthly cashflow
- —
- DSCR
- —
- Eligible?
- —
Personal DTI + credit; lowest rate.
DSCR
20% down · 8.5% · 30yr
- Down + closing
- —
- Monthly P&I
- —
- Monthly cashflow
- —
- DSCR
- —
- Eligible?
- —
No personal income docs; deal must DSCR.
Hard money
10% down · 12.0% · 12mo
- Down + closing
- —
- Monthly P&I
- —
- Monthly cashflow
- —
- DSCR
- —
- Eligible?
- —
Short-term bridge; refi at stabilization.
Rent comps 2 comps
| Address | Beds | Baths | Sqft | Rent | $/sqft | DOM | Units | Dist |
|---|---|---|---|---|---|---|---|---|
| 15817 SW Winter Rd Indiantown, FL | 3.0 | 2.5 | 1428 | $2,300 | $1.61 | 13d | 1 | 1.09mi |
| 15760 SW Hammock Way Indiantown, FL | 3.0–4.0 | 2.0–3.5 | 1918 | $2,420 | $1.26 | 1d | 41 | 1.45mi |
Listing history 4 events
-
2026-05-31status $150,000 Pending 14 DOM
Show marketing remark (317 chars)
Vacant residential lot opportunity in growing Indiantown! This spacious parcel offers excellent potential for new construction, investment, or future development. No HOA and plenty of potential in a developing market. Great opportunity for builders, investors, and buyers looking for affordable land in Martin County.
-
2026-05-31days on market $150,000 Active 14 DOM
Show marketing remark (317 chars)
Vacant residential lot opportunity in growing Indiantown! This spacious parcel offers excellent potential for new construction, investment, or future development. No HOA and plenty of potential in a developing market. Great opportunity for builders, investors, and buyers looking for affordable land in Martin County.
-
2026-05-12$35,000 Active 317-char remark
Show marketing remark (317 chars)
Vacant residential lot opportunity in growing Indiantown! This spacious parcel offers excellent potential for new construction, investment, or future development. No HOA and plenty of potential in a developing market. Great opportunity for builders, investors, and buyers looking for affordable land in Martin County.
-
2026-05-12$150,000 Active 227-char remark
Show marketing remark (317 chars)
Vacant residential lot opportunity in growing Indiantown! This spacious parcel offers excellent potential for new construction, investment, or future development. No HOA and plenty of potential in a developing market. Great opportunity for builders, investors, and buyers looking for affordable land in Martin County.
ⓘ Source: listings_history table (triggers on properties + properties_extension) + one-shot
backfill from property_details.listing_events for pre-trigger history.
Tax reassessment forecast FL · Resets to sale price
- Current annual tax
- $1,764 · $147/mo
- Projected year-2 tax
- $1,764 · $147/mo
- Expected delta
- $0/yr ($0/mo · 0.0%)
ⓘ Screening estimate from a state-policy table — verify with the county assessor before closing.
Climate risk First Street
- Flood 1/10 Low FEMA zone X (unshaded) · 0% chance over 30 yrs
- Wildfire 3/10 Moderate
- Heat 9/10 Extreme 7 d/yr ≥108°F today · 24 d/yr by 30 yrs out
- Wind 10/10 Extreme 99% chance of damaging wind over 30 yrs
- Air quality 2/10 Low 0 unhealthy d/yr today · 1 by 30 yrs out
Nearby sold comps map
Loading sold comps map…
Walkable amenities ~0.75 mi
Loading nearby amenities…
Taxation est. · year 1
- Rental income
- $28,116
- − Mortgage interest
- −$8,402
- − Property taxes
- −$1,764
- − Insurance
- −$750
- − Repairs & maintenance
- −$2,249
- − Management
- −$2,249
- − Depreciation
- −$4,364
- Taxable income
- $8,338
- Est. tax owed @ 24.0%
- −$2,001
- After-tax cash flow
- $8,257/yr
For passive investors: Depreciation is non-cash, so a rental often shows a tax loss while cash-flowing — sheltering income. Rental losses are passive: they offset passive income freely, and up to $25,000/yr can offset ordinary (W-2) income if you actively participate and your MAGI is under $100k (phasing out to $0 by $150k); unused losses carry forward. On sale, claimed depreciation is recaptured at up to 25%, and gains may owe capital-gains tax (a 1031 exchange can defer both). Figures are a year-1 estimate at your 24.0% rate — not tax advice; consult a CPA.
Schools (NCES district)
- District
- Martin
- NCES district ID
- 1201290
- Math proficiency
- 52% ▼ -14.00%
- Reading proficiency
- 53% ▼ -4.00%
- Median HH income
- $52,482
- Composite
- 45.1/100
- National rank
- #2690
- State rank
- #24 of 73 in FL
Livability — Indiantown
- Score
- 59/100
- State rank
- #829
- US rank
- #20298
Category grades
Schools grade is shown separately in the Schools card above.
Census & demographics
- Census place
- Indiantown, FL
- Population (ZIP)
- 9,639
Population outlook (Martin County) Hauer SSP2
- Today (2025)
- 172,383 people
- By 2030
- 180,192 · +4.5%
- By 2040
- 194,114 · +12.6%
- By 2050
- 204,992 · +18.9%
- By 2075
- 229,641 · +33.2%
- By 2100
- 232,146 · +34.7%
Race, ethnicity, and origin ACS 2023
- Neighborhood character
- Diverse neighborhood (Simpson 0.64)
- Race & ethnicity
- Hispanic / Latino 49% Black 24% White 24% Two or more races 16% Native American 5% Asian 1%
- Hispanic origin (detail)
- Mexican 21% Puerto Rican 4% Cuban 1%
- Common ancestry
- Lithuanian 1% Italian 1% Slovak 1%
- Foreign-born
- 22% · Canada
- Languages at home
- 55% English-only · Spanish 42%
Political lean MEDSL · Martin
- 2024 margin
- Solid R (+31.1) · D 34.1% · R 65.2%
- 2008→2024 swing
- -17.5pp toward R · 2008: -13.6pp · 2024: -31.1pp
- All cycles
- 2024: R+31.1 2020: R+24.6 2016: R+26.9 2012: R+22.9 2008: R+13.6
Not yet ingested
- Civics
- —
Market trends
- HPI YoY
- ▲ 6.65%
- Current HPI
- 561.896
- Rent YoY
- —
- Metro
- —
- State GDP YoY
- ▲ 3.28%
- F500 in state
- 36
Industry mix (Fortune 500 HQ in FL)
| Industry | F500 HQs | Revenue |
|---|---|---|
| Industrial Technology | 2 | $29B |
|
||
| Insurance | 2 | $17B |
|
||
| Retail | 1 | $60B |
|
||
| Technology Distribution | 1 | $58B |
|
||
| Homebuilding | 1 | $35B |
|
||
| Technology Manufacturing | 1 | $35B |
|
||
Price history
+328.6% since first listed8 events — show timeline
- 2026-05-31 Pending — Beaches MLS
- 2026-05-31 Pending — Beaches MLS
- 2026-05-27 Relisted — Beaches MLS
- 2026-05-27 Relisted — Beaches MLS
- 2026-05-23 Pending — Beaches MLS
- 2026-05-23 Pending — Beaches MLS
- 2026-05-12 Listed $150,000 Beaches MLS
- 2026-05-12 Listed $35,000 Beaches MLS
Property tax history
+9.9%/yrLatest (2025): $1,764 · -4.5% YoY. Source: county tax records.
Cash-flow waterfall
monthlySold comps — $/sqft
last 12 mo · ≤1 miLoading sold comps…