1153 E Elm St · Morrisville, MO
Flood risk 1/10 · Minimal
- FEMA flood zone
- X (unshaded)
- Chance of flooding over 30 yrs
- 0.0%
- Est. flood insurance / yr
- $507 – $1,088
Fire risk 5/10 · Moderate
- Est. fire insurance / yr
- $1,054 – $1,958
Heat risk 5/10 · Moderate
- Hot days now (above 106°F)
- 7 days/yr
- Hot days in 30 yrs
- 20 days/yr
Wind risk 2/10 · Minimal
- Chance of severe wind over 30 yrs
- 0.0%
Air-quality risk 2/10 · Minimal
- Unhealthy air days now
- 0 days/yr
- Unhealthy air days in 30 yrs
- 1 days/yr
Risk factors via First Street. Map © Google.
Why this score? — see what drove the B grade
The composite is a weighted blend of 9 inputs, each scored 0–100. Each bar is that input's sub-score; the figure is the points it added to the 100-point composite (weight × sub-score).
- Cash flow +27.9/30.0
- DSCR +9.9/10.0
- ARV discount +7.5/15.0
- 1% rule +6.7/10.0
- Appreciation +6.4/10.0
- Livability +3.4/5.0
- Schools +3.2/10.0
- Rent growth +2.5/5.0
- Condition / age +2.5/5.0
$109,900
🖨 Deal sheet 📄 Offer letter ✓ Due diligence
Listing remarks
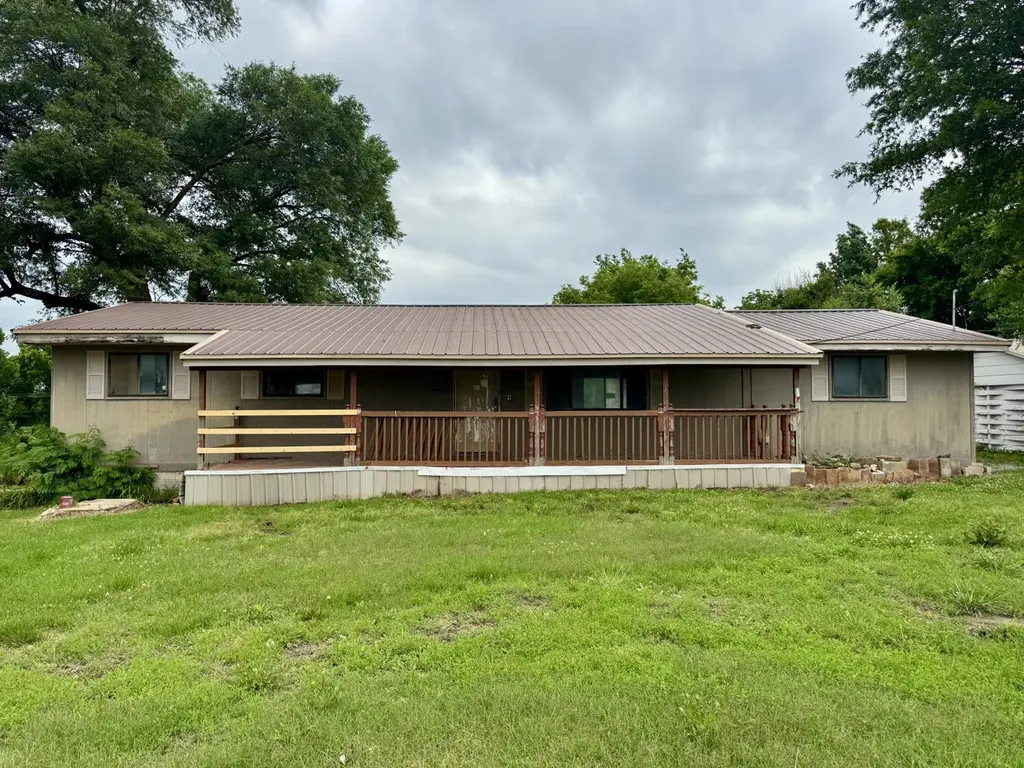
Fixer-upper opportunity! This 4-bedroom, 2-bath home offers 1,612 sq. ft. of living space on a generous 0.7-acre lot with a detached 2-car garage. Foreclosure property being sold as-is. Great potential for investors or buyers ready to add their personal touch. Don't miss this chance to transform this property into something special!
Key facts
- Metal roof
- Big front porch
- Large lot
Tags
Property features AI
Exterior
- Parking: 2-car garage
- Utilities: Public water; Public sewer
- Home design: Single-family residence; One level
- Exterior features: Metal roof; Public maintained road access; City street frontage; Approximately 0.7 acre lot
Interior
- Bedrooms: Laundry on main level
- Bathrooms: 2 full bathrooms; 1 half bathroom
- Heating & cooling: Electric central heating; Central air with ceiling fans
- Interior features: Ceiling fans
- Laundry & utility: Main-level laundry
Neighborhood map
What this means for you Summary
Snapshot
- This is a 4-bed/2.5-bath other listed at $110k.
Deal economics
- At list price, monthly cash flow is $338 ($4k/yr) — positive.
- The deal already cash-flows at list — no discount required.
- Meets the 1% rule at list price ($1k rent vs $110k).
- Recommended offer: $108k (1.5% below list) — sets the bar for market timing.
Location & tenants
- Location reads 68/100 on livability (#191 in MO) — a middle-class / working-renter tenant base. Strengths: cost of living A+, housing A+; Watch: crime F, amenities F, commute F.
- Marion C. Early R-V (rural): math 37% / reading 39% proficiency, ranked #175 of 324 in MO (top 54%) — families likely to look elsewhere, expect single-tenant / working-renter base with shorter leases.
- Zoned schools: Marion C. Early Elem. (math 37% / reading 42%, grade F, #537 of 1,115 statewide, top 53%, 259 students, 52% FRL); Marion C. Early Junior High (math 37% / reading 32%, grade F, #243 of 391 statewide, top 65%, 146 students, 45% FRL); Marion C. Early High (math 34% / reading 64%, grade D, #124 of 521 statewide, top 28%, 161 students, 40% FRL) — zoned schools at 46% FRL track the district average.
- Market conditions: 15 active listings in the ZIP; 188 units permitted in Polk County in 2024 (40 in 5+ unit buildings).
Forward outlook
- In year one you build about $4k of equity ($760 loan paydown + $3k appreciation (2.9% local appreciation)).
- At projected returns (2.9% appreciation + 3.0% rent growth), your $31k cash investment doubles in ~4 years — after that, you're playing with house money.
- By year 9, paydown + projected appreciation supports a ~$33k cash-out refi (75% LTV) — recoverable capital for the next deal without selling this one.
Negotiation context
- It's been on market 16 days — a 2% lower offer ($108k) is reasonable based on typical stale-listing flexibility.
Risks & watch-outs
- Climate carrying-cost: moderate wildfire risk; extreme-heat days projected 7→20/yr by 2055 (HVAC capex compounding) — expect insurance premiums to compound above CPI over the hold.
Questions for the listing agent
- Built in 1973 — when were the roof, HVAC, electrical panel, plumbing, and water heater last replaced?
- Is there a deadline driving the sale (1031 exchange, divorce, estate, relocation)? That informs how much negotiation room exists.
- Schools are D-rated, which usually means shorter tenancies and higher turnover. Who's the typical renter profile here, and what's been the actual vacancy rate?
- Crime grade is F in this area — have there been break-ins, vandalism, or insurance claims at this property in the last 3 years? What carrier currently insures it and at what premium?
- What's the average days-on-market for RENTAL listings here right now (not sales)? A rising rental-DOM trend means longer vacancies and softer asking-rent achievability than the comps imply.
- What's the recent tenant-quality profile in this submarket — average credit score on applications, eviction rate, late-payment / NSF rate, and stable-employment percentage? A property-management company in the area should have these aggregated.
- How much new for-sale + rental construction is in the pipeline within 1–3 miles? Heavy new supply typically softens prices + rents 12–24 months out; constrained supply supports both.
Investment metrics
- 1% rule
- 1.17% ✓
- Cap rate
- 9.98%
- Cash-on-cash
- 13.18%
- DSCR
- 1.59
- GRM
- 7.1
CMA / ARV
No comps found within radius.
Projected returns pro-forma
2.88% appreciation · 3.0% rent growth · sell at horizon
- IRR
- 19.6%
- Equity multiple
- 2.11×
- Total profit
- $34,034
- Equity at exit
- $48,677
- IRR
- 20.9%
- Equity multiple
- 3.98×
- Total profit
- $91,842
- Equity at exit
- $74,447
Cash invested: $30,772 (down + closing). Projections, not guarantees.
Landlord ↔ Tenant lean methodology
- Overall (STATE)
- 81 Strongly Landlord-Friendly
- State Missouri
- 81 Strongly Landlord-Friendly · R+10
- County
- — inherits STATE
- City
- — inherits STATE
ZIP-level market 65710
- Home prices YoY
- 1.7%
- Active inventory
- 15
- Price-to-rent
- 7.1×
Monthly cashflow live
- Estimated rent
- $1,288 medium interval (Pro) →
- Mortgage (P&I)
- −$576
- Tax from tax record
- −$58 /mo · $690/yr
- Insurance
- −$46
- HOA
- −$0
- Vacancy / Maint / Mgmt
- −$270
- Net cashflow
- $338
Break-even live
UW: 25.0% down · 7.5% · 30yr · 1.5% tax · 5.0% vac · 8.0% maint · 8.0% mgmt
Financing live
Cash to close
- Down payment
- $27,475
- Closing costs
- $3,297
- Reserves months
- —
- Total cash needed
- —
Loan-product check · same deal, 3 products live
Conventional
25% down · 7.5% · 30yr
- Down + closing
- —
- Monthly P&I
- —
- Monthly cashflow
- —
- DSCR
- —
- Eligible?
- —
Personal DTI + credit; lowest rate.
DSCR
20% down · 8.5% · 30yr
- Down + closing
- —
- Monthly P&I
- —
- Monthly cashflow
- —
- DSCR
- —
- Eligible?
- —
No personal income docs; deal must DSCR.
Hard money
10% down · 12.0% · 12mo
- Down + closing
- —
- Monthly P&I
- —
- Monthly cashflow
- —
- DSCR
- —
- Eligible?
- —
Short-term bridge; refi at stabilization.
Listing history 12 events
-
2026-06-18days on market $109,900 Active 16 DOM
-
2026-06-17days on market $109,900 Active 15 DOM
-
2026-06-16days on market $109,900 Active 14 DOM
-
2026-06-15days on market $109,900 Active 13 DOM
-
2026-06-14days on market $109,900 Active 11 DOM
-
2026-06-10days on market $109,900 Active 8 DOM
-
2026-06-09days on market $109,900 Active 7 DOM
-
2026-06-08days on market $109,900 Active 6 DOM
-
2026-06-07days on market $109,900 Active 5 DOM
-
2026-06-03remarks 334-char remark
-
2026-06-03remarks 182-char remark
-
2026-06-03$109,900 Active 1 DOM
ⓘ Source: listings_history table (triggers on properties + properties_extension) + one-shot
backfill from property_details.listing_events for pre-trigger history.
Tax reassessment forecast MO · Resets to sale price
- Current annual tax
- $690 · $58/mo
- Projected year-2 tax
- $1,066 · $89/mo
- Expected delta
- +$376/yr (+$31/mo · 54.4%)
ⓘ Screening estimate from a state-policy table — verify with the county assessor before closing.
Climate risk First Street
- Flood 1/10 Low FEMA zone X (unshaded) · 0% chance over 30 yrs
- Wildfire 5/10 Major
- Heat 5/10 Major 7 d/yr ≥106°F today · 20 d/yr by 30 yrs out
- Wind 2/10 Low 0% chance of damaging wind over 30 yrs
- Air quality 2/10 Low 0 unhealthy d/yr today · 1 by 30 yrs out
Nearby sold comps map
Loading sold comps map…
Walkable amenities ~0.75 mi
Loading nearby amenities…
Taxation est. · year 1
- Rental income
- $15,456
- − Mortgage interest
- −$6,156
- − Property taxes
- −$690
- − Insurance
- −$550
- − Repairs & maintenance
- −$1,236
- − Management
- −$1,236
- − Depreciation
- −$3,197
- Taxable income
- $2,390
- Est. tax owed @ 24.0%
- −$574
- After-tax cash flow
- $3,481/yr
For passive investors: Depreciation is non-cash, so a rental often shows a tax loss while cash-flowing — sheltering income. Rental losses are passive: they offset passive income freely, and up to $25,000/yr can offset ordinary (W-2) income if you actively participate and your MAGI is under $100k (phasing out to $0 by $150k); unused losses carry forward. On sale, claimed depreciation is recaptured at up to 25%, and gains may owe capital-gains tax (a 1031 exchange can defer both). Figures are a year-1 estimate at your 24.0% rate — not tax advice; consult a CPA.
Schools (NCES district)
- District
- Marion C. Early R-V
- NCES district ID
- 2920160
- Math proficiency
- 37% ▼ -3.00%
- Reading proficiency
- 39% ▼ -3.00%
- Median HH income
- $44,928
- Composite
- 32.35/100
- National rank
- #5741
- State rank
- #175 of 324 in MO
Livability — Morrisville
- Score
- 68/100
- State rank
- #191
- US rank
- #9999
Category grades
Schools grade is shown separately in the Schools card above.
Census & demographics
- Census place
- Morrisville, MO
- Population (ZIP)
- 1,333
Population outlook (Polk County) Hauer SSP2
- Today (2025)
- 31,229 people
- By 2030
- 31,227 · +-0.0%
- By 2040
- 31,104 · -0.4%
- By 2050
- 30,553 · -2.2%
- By 2075
- 29,332 · -6.1%
- By 2100
- 26,387 · -15.5%
Race, ethnicity, and origin ACS 2023
- Neighborhood character
- Predominantly White (95%)
- Race & ethnicity
- White 95% Two or more races 2% Native American 2%
- Common ancestry
- Italian 9% Romanian 3% Iranian 2%
Political lean MEDSL · Polk
- 2024 margin
- Solid R (+61.6) · D 18.6% · R 80.2% · Other 1.1%
- 2008→2024 swing
- -29.5pp toward R · 2008: -32.1pp · 2024: -61.6pp
- All cycles
- 2024: R+61.6 2020: R+59.5 2016: R+56.9 2012: R+43.2 2008: R+32.1
Not yet ingested
- Civics
- —
Market trends
- HPI YoY
- ▲ 2.88%
- Current HPI
- 168.9089
- Rent YoY
- —
- Metro
- —
- State GDP YoY
- ▲ 1.84%
- F500 in state
- 20
Industry mix (Fortune 500 HQ in MO)
| Industry | F500 HQs | Revenue |
|---|---|---|
| Healthcare | 1 | $163B |
|
||
| Insurance | 1 | $21B |
|
||
| Industrial Technology | 1 | $17B |
|
||
| Retail | 1 | $16B |
|
||
| Industrial Distribution | 1 | $10B |
|
||
| Utilities | 1 | $9B |
|
||
Price history
2 events — show timeline
- 2026-06-02 Listed $109,900 SOMO
- 2011-01-14 Sold (Public Records) — Public Records
Property tax history
+3.7%/yrLatest (2025): $690 · -4.1% YoY. Source: county tax records.
Cash-flow waterfall
monthlySold comps — $/sqft
last 12 mo · ≤1 miLoading sold comps…