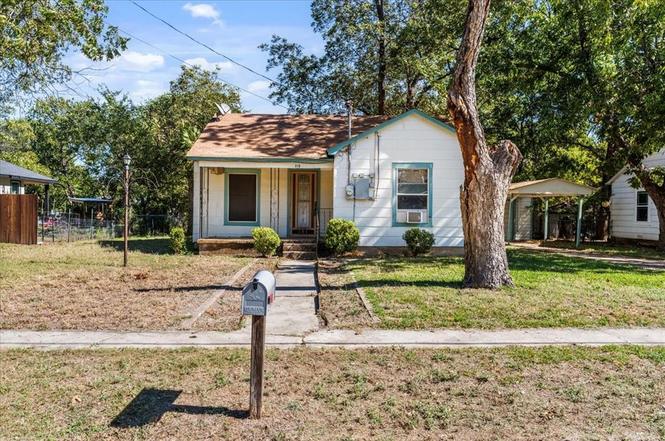
316 Ritchey St · Gainesville, TX
Flood risk 1/10 · Minimal
- FEMA flood zone
- X (unshaded)
- Chance of flooding over 30 yrs
- 0.0%
- Est. flood insurance / yr
- $507 – $1,088
Fire risk 7/10 · Major
- Est. fire insurance / yr
- $1,222 – $2,270
Heat risk 7/10 · Major
- Hot days now (above 110°F)
- 7 days/yr
- Hot days in 30 yrs
- 21 days/yr
Wind risk 4/10 · Minor
- Chance of severe wind over 30 yrs
- 17.0%
Air-quality risk 3/10 · Minor
- Unhealthy air days now
- 3 days/yr
- Unhealthy air days in 30 yrs
- 4 days/yr
Risk factors via First Street. Map © Google.
Why this score? — see what drove the B grade
The composite is a weighted blend of 9 inputs, each scored 0–100. Each bar is that input's sub-score; the figure is the points it added to the 100-point composite (weight × sub-score).
- Cash flow +28.9/30.0
- ARV discount +15.0/15.0
- DSCR +10.0/10.0
- 1% rule +8.7/10.0
- Livability +3.3/5.0
- Schools +2.6/10.0
- Rent growth +2.5/5.0
- Condition / age +2.5/5.0
- Appreciation +0.0/10.0
$140,000
🖨 Deal sheet 📄 Offer letter ✓ Due diligence
Listing remarks MLS
Great first time home buyer or investment property. Additional appliances included are Refrigerator, Microwave, Washer and Dryer without guarantee or warranty of operation. All Furniture not marked also conveys with property. Buyer to verify all taxes, measurements, and schools. Property being sold as is.
Key facts
- Covered front porch
- Walk-in laundry room
- 0.28 acre lot
Tags
Property features AI
Finance
- Other: Property subtype: Single Family Residence; Lot about 0.282 acres; Subdivision: Cunningham Add
- Financial info: Listing terms include Cash and Conventional; Second mortgage: No
- HOA & community: No association
Exterior
- Parking: Driveway; Garage (1-car, faces front); Covered parking for 2 vehicles; Carport for 1 vehicle
- Security: No specific security features provided
- Utilities: City water; City sewer / sewer available; Not in a municipal utility district
- Home design: Single-family residence; One story; Residential property
- Construction: Built in 1940; Siding and other exterior materials; Shingle roof; Other foundation details
- Exterior features: Covered front porch; Patio; Covered porch(es); Back yard fencing; Grassed yard; Few trees; Interior lot
Interior
- Kitchen: Dishwasher; Gas range; Built-in cabinets; Eat-in kitchen; Solid surface/non-natural countertops
- Bedrooms: Primary bedroom (main level); Total of 3 bedrooms
- Flooring: Carpet; Laminate
- Bathrooms: 1 full bathroom
- Heating & cooling: Central heating; Ceiling fan(s); Window unit(s)
- Interior features: Built-in features; Eat-in kitchen; Other
- Laundry & utility: No specific laundry details provided
Neighborhood map
What this means for you Summary
Snapshot
- This is a 3-bed/1.0-bath single-family listed at $140k.
Deal economics
- At list price, monthly cash flow is $477 ($6k/yr) — positive.
- The deal already cash-flows at list — no discount required.
- Meets the 1% rule at list price ($2k rent vs $140k).
- Recommended offer: $123k (12.0% below list) — sets the bar for market timing.
- Cap rate 10.4% vs local median 3.7% in Gainesville — top-decile yield for the area; either an underpriced asset or a hidden risk that comps aren't pricing in. Stress-test before assuming the spread holds.
Location & tenants
- Location reads 66/100 on livability (#602 in TX) — a middle-class / working-renter tenant base. Strengths: cost of living A+, housing A+, crime B+; Watch: amenities F, commute F, employment F.
- Gainesville ISD (rural): math 33% / reading 29% proficiency, ranked #606 of 826 in TX (top 73%) — families likely to look elsewhere, expect single-tenant / working-renter base with shorter leases; 72% free/reduced lunch — lower-income household profile, screen leases tightly.
- Zoned schools: W E Chalmers El (math 28% / reading 24%, grade F, #2,954 of 4,322 statewide, top 69%, 716 students, 67% FRL) — zoned schools at 67% FRL track the district average.
- Market conditions: 462 active listings in the ZIP; 5 comparable units currently listed for rent nearby; rentals lingering (median 44d on market — plan ~5-8 weeks vacancy on turnover, expect pricing pressure); 100% of comp listings sitting > 30 days — soft ceiling on asking rent; 190 units permitted in Cooke County in 2024 (0 in 5+ unit buildings).
- This rent runs 32% of the median local income ($72k/yr) — at the standard rent-burdened threshold; future hikes will face affordability resistance.
Forward outlook
- Local home prices are declining (-3.0%/yr); year-one equity from $968 of loan paydown is wiped out by about $4k of value loss. Plan a longer hold.
- At projected returns (-3.0% appreciation + 3.0% rent growth), your $39k cash investment doubles in ~8 years — after that, you're playing with house money.
Negotiation context
- It's been on market 203 days — a 12% lower offer ($123k) is reasonable based on typical stale-listing flexibility.
- 6 sale attempts since 19y ago; this cycle's ask has dropped $27k (16%) from the opening price — seller is motivated, your offer sets the floor, not the list.
Risks & watch-outs
- Watch-outs: built in 1940 — expect roof / HVAC / electrical / plumbing capex.
- Climate carrying-cost: major wildfire risk; extreme-heat days projected 7→21/yr by 2055 (HVAC capex compounding) — expect insurance premiums to compound above CPI over the hold.
Questions for the listing agent
- It's been on market 203 days. Have you received any prior offers? Is the seller open to a 12% concession, seller financing, or rate buy-down credit?
- Built in 1940 — when were the roof, HVAC, electrical panel, plumbing, and water heater last replaced?
- Why hasn't it sold? Are there any deal-killer items the seller is aware of (foundation, flood, title, zoning, code violations)?
- Is there a deadline driving the sale (1031 exchange, divorce, estate, relocation)? That informs how much negotiation room exists.
- Schools are F-rated, which usually means shorter tenancies and higher turnover. Who's the typical renter profile here, and what's been the actual vacancy rate?
- What's the average days-on-market for RENTAL listings here right now (not sales)? A rising rental-DOM trend means longer vacancies and softer asking-rent achievability than the comps imply.
- What's the recent tenant-quality profile in this submarket — average credit score on applications, eviction rate, late-payment / NSF rate, and stable-employment percentage? A property-management company in the area should have these aggregated.
- How much new for-sale + rental construction is in the pipeline within 1–3 miles? Heavy new supply typically softens prices + rents 12–24 months out; constrained supply supports both.
Investment metrics
- 1% rule
- 1.37% ✓
- Cap rate
- 10.38%
- Cash-on-cash
- 14.59%
- DSCR
- 1.65
- GRM
- 6.1
CMA / ARV
- ARV (on-the-fly)
- $204,340
- Comps found
- 12
Show comp detail 12 sales within ~0.75 mi
| Address | Dist | Beds/Ba | Sqft | Sold | Price | $/sf | Match |
|---|---|---|---|---|---|---|---|
| 316 Ritchey St | 0.00mi | 3/1.0 | 1,202 (0%) | 1mo | $140,000 | $116 | 99 |
| 315 N Morris St | 0.22mi | 3/2.0 | 1,200 (-0%) | 2mo | $199,800 | $167 | 84 |
| 811 Ritchey St | 0.41mi | 3/2.0 | 1,250 (+4%) | 3mo | $235,000 | $188 | 68 |
| 1103 Fair Ave | 0.73mi | 2/1.0 (-1) | 1,206 (+0%) | 3mo | $167,500 | $139 | 58 |
| 1016 N Howeth St | 0.65mi | 2/1.0 (-1) | 1,152 (-4%) | 1mo | $100,000 | $87 | 57 |
| 809 S Wine St | 0.62mi | 3/2.0 | 1,288 (+7%) | 4mo | $174,000 | $135 | 52 |
| 415 2nd St | 0.64mi | 3/2.0 | 1,232 (+2%) | 12mo | $115,000 | $93 | 52 |
| 1704 Harris St | 0.70mi | 2/1.0 (-1) | 1,117 (-7%) | 2mo | $220,000 | $197 | 49 |
| 1209 E Garnett St | 0.45mi | 2/1.0 (-1) | 1,058 (-12%) | 11mo | $180,000 | $170 | 45 |
| 1104 Fair Ave | 0.74mi | 3/2.0 | 1,140 (-5%) | 11mo | $198,500 | $174 | 43 |
| 333 N Red River St | 0.74mi | 2/1.0 (-1) | 1,288 (+7%) | 9mo | $232,550 | $181 | 42 |
| 831 Lawrence St | 0.60mi | 2/2.0 (-1) | 1,090 (-9%) | 9mo | $185,000 | $170 | 40 |
Match score weights: distance 35% · size 25% · config 20% · recency 20%. Top-matched comps best support the ARV.
Projected returns pro-forma
-3.0% appreciation · 3.0% rent growth · sell at horizon
- IRR
- 5.1%
- Equity multiple
- 1.20×
- Total profit
- $7,741
- Equity at exit
- $20,874
- IRR
- 14.6%
- Equity multiple
- 2.18×
- Total profit
- $46,130
- Equity at exit
- $12,105
Cash invested: $39,200 (down + closing). Projections, not guarantees.
Landlord ↔ Tenant lean methodology
- Overall (STATE)
- 87 Strongly Landlord-Friendly
- State Texas
- 87 Strongly Landlord-Friendly · R+5
- County
- — inherits STATE
- City
- — inherits STATE
ZIP-level market 76240
- Active inventory
- 462
- Price-to-rent
- 6.1×
Monthly cashflow live
- Estimated rent
- $1,923 high interval (Pro) →
- Mortgage (P&I)
- −$734
- Tax from tax record
- −$250 /mo · $2,999/yr
- Insurance
- −$58
- HOA
- −$0
- Vacancy / Maint / Mgmt
- −$404
- Net cashflow
- $477
Break-even live
UW: 25.0% down · 7.5% · 30yr · 1.5% tax · 5.0% vac · 8.0% maint · 8.0% mgmt
Financing live
Cash to close
- Down payment
- $35,000
- Closing costs
- $4,200
- Reserves months
- —
- Total cash needed
- —
Loan-product check · same deal, 3 products live
Conventional
25% down · 7.5% · 30yr
- Down + closing
- —
- Monthly P&I
- —
- Monthly cashflow
- —
- DSCR
- —
- Eligible?
- —
Personal DTI + credit; lowest rate.
DSCR
20% down · 8.5% · 30yr
- Down + closing
- —
- Monthly P&I
- —
- Monthly cashflow
- —
- DSCR
- —
- Eligible?
- —
No personal income docs; deal must DSCR.
Hard money
10% down · 12.0% · 12mo
- Down + closing
- —
- Monthly P&I
- —
- Monthly cashflow
- —
- DSCR
- —
- Eligible?
- —
Short-term bridge; refi at stabilization.
Rent comps 5 comps
| Address | Beds | Baths | Sqft | Rent | $/sqft | DOM | Units | Dist |
|---|---|---|---|---|---|---|---|---|
| 426 N Clements St Gainesville, TX | 3.0 | 2.0 | 1408 | $2,307 | $1.64 | 43d | 1 | 0.10mi |
| 1010 E Main St Gainesville, TX | 3.0 | 1.0 | 1263 | $1,550 | $1.23 | 43d | 1 | 0.36mi |
| 1610 Elizabeth St Gainesville, TX | 3.0 | 1.0 | 1100 | $1,500 | $1.36 | 43d | 1 | 0.39mi |
| 1331 Lanius St Gainesville, TX | 3.0 | 2.0 | 1300 | $1,850 | $1.42 | 43d | 1 | 0.61mi |
| 923 S Wine St Gainesville, TX | 3.0 | 1.0 | 1216 | $1,550 | $1.27 | 43d | 1 | 0.74mi |
Listing history 19 events
-
2026-05-15status Pending
-
2026-05-13status Active
-
2026-04-28historical Active Option Contract
-
2026-04-04price $140,000
-
2026-03-14status Active
-
2026-03-03historical Active Option Contract
-
2025-12-24status Active
-
2025-12-18historical Active Option Contract
-
2025-12-18status Active
-
2025-12-17historical Active Option Contract
-
2025-11-20price $144,465
-
2025-10-22$167,000 Active
-
2011-10-28soldstatus
-
2007-09-14soldstatus
-
2007-09-13soldstatus 307-char remark
Show marketing remark (307 chars)
Great first time home buyer or investment property. Additional appliances included are Refrigerator, Microwave, Washer and Dryer without guarantee or warranty of operation. All Furniture not marked also conveys with property. Buyer to verify all taxes, measurements, and schools. Property being sold as is.
-
2007-08-25historical 307-char remark
Show marketing remark (307 chars)
Great first time home buyer or investment property. Additional appliances included are Refrigerator, Microwave, Washer and Dryer without guarantee or warranty of operation. All Furniture not marked also conveys with property. Buyer to verify all taxes, measurements, and schools. Property being sold as is.
-
2007-05-31$49,900 307-char remark
Show marketing remark (307 chars)
Great first time home buyer or investment property. Additional appliances included are Refrigerator, Microwave, Washer and Dryer without guarantee or warranty of operation. All Furniture not marked also conveys with property. Buyer to verify all taxes, measurements, and schools. Property being sold as is.
-
2003-01-20soldstatus
-
2003-01-20soldstatus
ⓘ Source: listings_history table (triggers on properties + properties_extension) + one-shot
backfill from property_details.listing_events for pre-trigger history.
Tax reassessment forecast TX · Resets to sale price
- Current annual tax
- $2,999 · $250/mo
- Projected year-2 tax
- $2,999 · $250/mo
- Expected delta
- $0/yr ($0/mo · 0.0%)
ⓘ Screening estimate from a state-policy table — verify with the county assessor before closing.
Climate risk First Street
- Flood 1/10 Low FEMA zone X (unshaded) · 0% chance over 30 yrs
- Wildfire 7/10 Severe
- Heat 7/10 Severe 7 d/yr ≥110°F today · 21 d/yr by 30 yrs out
- Wind 4/10 Moderate 17% chance of damaging wind over 30 yrs
- Air quality 3/10 Moderate 3 unhealthy d/yr today · 4 by 30 yrs out
Nearby sold comps map
Loading sold comps map…
Walkable amenities ~0.75 mi
Loading nearby amenities…
Taxation est. · year 1
- Rental income
- $23,073
- − Mortgage interest
- −$7,842
- − Property taxes
- −$2,999
- − Insurance
- −$700
- − Repairs & maintenance
- −$1,846
- − Management
- −$1,846
- − Depreciation
- −$4,073
- Taxable income
- $3,768
- Est. tax owed @ 24.0%
- −$904
- After-tax cash flow
- $4,815/yr
For passive investors: Depreciation is non-cash, so a rental often shows a tax loss while cash-flowing — sheltering income. Rental losses are passive: they offset passive income freely, and up to $25,000/yr can offset ordinary (W-2) income if you actively participate and your MAGI is under $100k (phasing out to $0 by $150k); unused losses carry forward. On sale, claimed depreciation is recaptured at up to 25%, and gains may owe capital-gains tax (a 1031 exchange can defer both). Figures are a year-1 estimate at your 24.0% rate — not tax advice; consult a CPA.
Schools (NCES district)
- District
- Gainesville ISD
- NCES district ID
- 4820220
- Math proficiency
- 33% ▼ -9.00%
- Reading proficiency
- 29% ▼ -2.00%
- Median HH income
- $41,772
- Composite
- 26.27/100
- National rank
- #7252
- State rank
- #606 of 826 in TX
Livability — Gainesville
- Score
- 66/100
- State rank
- #602
- US rank
- #11445
Category grades
Schools grade is shown separately in the Schools card above.
Census & demographics
- Census place
- Gainesville, TX
- County
- Cooke County · 29,419 people
- City population
- 29,419
- Metro
- Gainesville, TX
- Population (ZIP)
- 29,419
- Household income
- $71,502
- Rent vs Own
- Severe rent burden
- 660.0
Population outlook (Cooke County) Hauer SSP2
- Today (2025)
- 39,965 people
- By 2030
- 39,974 · +0.0%
- By 2040
- 39,772 · -0.5%
- By 2050
- 39,258 · -1.8%
- By 2075
- 37,262 · -6.8%
- By 2100
- 33,363 · -16.5%
Race, ethnicity, and origin ACS 2023
- Neighborhood character
- Predominantly White (66%)
- Race & ethnicity
- White 66% Hispanic / Latino 24% Two or more races 14% Black 5%
- Hispanic origin (detail)
- Mexican 21%
- Common ancestry
- Serbian 2% Lithuanian 2% Slovak 1%
- Foreign-born
- 8% · Canada
- Languages at home
- 83% English-only · Spanish 16% Other Indo-European 1%
Political lean MEDSL · Cooke
- 2024 margin
- Solid R (+66.9) · D 16.2% · R 83.1%
- 2008→2024 swing
- -8.2pp toward R · 2008: -58.7pp · 2024: -66.9pp
- All cycles
- 2024: R+66.9 2020: R+65.2 2016: R+68.1 2012: R+67.6 2008: R+58.7
Not yet ingested
- Civics
- —
Market trends
- HPI YoY
- ▼ -198.63%
- Current HPI
- 247.3822
- Rent YoY
- —
- Metro
- Gainesville, TX
- State GDP YoY
- ▲ 3.95%
- F500 in state
- 110
Industry mix (Fortune 500 HQ in TX)
| Industry | F500 HQs | Revenue |
|---|---|---|
| Energy | 16 | $1,198B |
|
||
| Technology | 5 | $198B |
|
||
| Engineering / Construction | 4 | $72B |
|
||
| Energy Services | 3 | $60B |
|
||
| Utilities | 3 | $41B |
|
||
| Healthcare | 2 | $330B |
|
||
Price history
+180.6% since first listed19 events — show timeline
- 2026-05-15 Pending — NTREIS
- 2026-05-13 Relisted — NTREIS
- 2026-04-28 Contingent — NTREIS
- 2026-04-04 Price Changed $140,000 NTREIS
- 2026-03-14 Relisted — NTREIS
- 2026-03-03 Contingent — NTREIS
- 2025-12-24 Relisted — NTREIS
- 2025-12-18 Contingent — NTREIS
- 2025-12-18 Relisted — NTREIS
- 2025-12-17 Contingent — NTREIS
- 2025-11-20 Price Changed $144,465 NTREIS
- 2025-10-22 Listed $167,000 NTREIS
- 2011-10-28 Sold (Public Records) — Public Records
- 2007-09-14 Sold (Public Records) — Public Records
- 2007-09-13 Sold (MLS) — NTREIS
- 2007-08-25 Listing Removed — NTREIS
- 2007-05-31 Listed $49,900 NTREIS
- 2003-01-20 Sold (Public Records) — Public Records
- 2003-01-20 Sold (Public Records) — Public Records
Property tax history
+8.4%/yrLatest (2025): $2,999 · +10.4% YoY. Source: county tax records.
Cash-flow waterfall
monthlySold comps — $/sqft
last 12 mo · ≤1 miLoading sold comps…