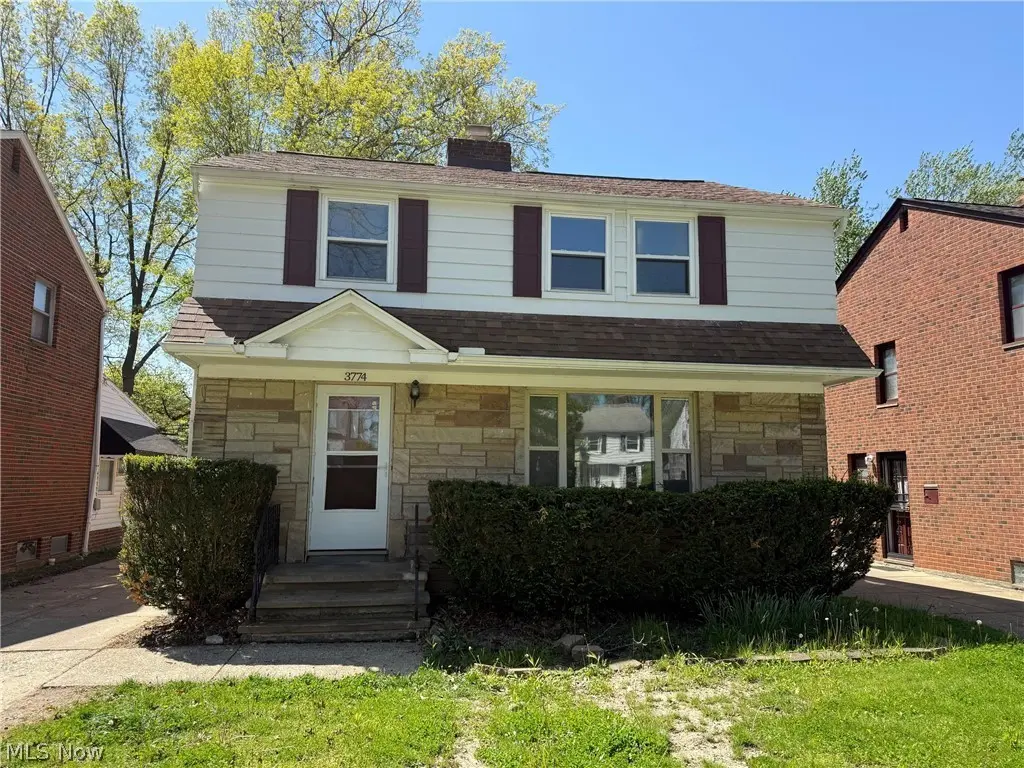
3774 Princeton Blvd · South Euclid, OH
Flood risk 1/10 · Minimal
- FEMA flood zone
- X (unshaded)
- Chance of flooding over 30 yrs
- 0.0%
- Est. flood insurance / yr
- $473 – $860
Fire risk 1/10 · Minimal
- Est. fire insurance / yr
- $713 – $1,323
Heat risk 2/10 · Minimal
- Hot days now (above 95°F)
- 6 days/yr
- Hot days in 30 yrs
- 14 days/yr
Wind risk 1/10 · Minimal
- Chance of severe wind over 30 yrs
- —
Air-quality risk 3/10 · Minor
- Unhealthy air days now
- 2 days/yr
- Unhealthy air days in 30 yrs
- 5 days/yr
Risk factors via First Street. Map © Google.
Why this score? — see what drove the D+ grade
The composite is a weighted blend of 9 inputs, each scored 0–100. Each bar is that input's sub-score; the figure is the points it added to the 100-point composite (weight × sub-score).
- Cash flow +18.6/30.0
- 1% rule +6.2/10.0
- DSCR +5.8/10.0
- Livability +4.4/5.0
- Rent growth +4.2/5.0
- ARV discount +3.6/15.0
- Schools +3.1/10.0
- Condition / age +2.5/5.0
- Appreciation +0.0/10.0
$170,000
🖨 Deal sheet 📄 Offer letter ✓ Due diligence
Listing remarks MLS
This Traditional Stone Front Colonial is Priced to Sell! * * * Check Out the 360 Degree Panoramic Virtual Tour * * * Spacious Living Room with Hardwood Floors and Wood Burning Fireplace! Large Eat-In Kitchen Opens to Formal Dining Area! Enclosed Sunroom off of Dining Room! Half Bath on First Floor! Three Large Bedrooms Feature Fresh Paint and Hardwood Floors! Updated Full Bath Completes the Second Floor! Lower Level Rec Room with Fireplace! Newer Windows, Furnace, and A/C! Two Car Garage! Home Warranty Included! Minutes from University Circle, Hospitals, Museums! Call to Schedule Private Showing Today!
Key facts
- Enclosed sunroom
- Modern furnace
- Lower level rec room
Tags
Property features AI
Finance
- Other: Above-grade finished area approximately 1,684
Exterior
- Parking: Detached garage; 2 garage spaces
- Utilities: Public water service; Public sewer service
- Home design: 2-story home; Asphalt and fiberglass roof; Aluminum siding and brick exterior; Home warranty included
- Construction: Built (year per public records); Aluminum siding and brick construction; Asphalt and fiberglass roof
- Exterior features: Public water; Public sewer
Interior
- Bedrooms: Total of 6 rooms (includes bedrooms and living spaces)
- Bathrooms: 1 full bathroom; 1 half bathroom; 1 main-level bathroom
- Heating & cooling: Forced air heating; Central air conditioning
- Interior features: Partially finished basement; Living room fireplace
Neighborhood map
What this means for you Summary
Snapshot
- This is a 3-bed/1.5-bath single-family listed at $170k.
Deal economics
- At list price, monthly cash flow is $165 ($2k/yr) — positive.
- The deal already cash-flows at list — no discount required.
- Meets the 1% rule at list price ($2k rent vs $170k).
- Recommended offer: $167k (1.5% below list) — sets the bar for market timing.
- Cap rate 7.5% vs local median 5.9% in South Euclid — meaningfully above typical; check what's discounted (condition, days-on-market, listing class) to confirm the premium yield is real.
Location & tenants
- Location reads 88/100 on livability (#22 in OH, #207 nationally) — a professional / high-income tenant draw. Strengths: commute A+, cost of living A+, housing A+.
- South Euclid-Lyndhurst City (suburban): math 23% / reading 45% proficiency, ranked #556 of 656 in OH (top 85%) — families likely to look elsewhere, expect single-tenant / working-renter base with shorter leases.
- Market conditions: Rents rising fast (+6.8%/yr); 148 active listings in the ZIP; 27 comparable units currently listed for rent nearby; rentals at typical pace (median 16d on market — plan ~3-4 weeks tenant-placement turnaround); solid renter incomes; 1,441 units permitted in Cuyahoga County in 2024 (700 in 5+ unit buildings).
Forward outlook
- Local home prices are declining (-3.0%/yr); year-one equity from $1k of loan paydown is wiped out by about $5k of value loss. Plan a longer hold.
- Cuyahoga County population projected to shrink 8% by 2050 — rents likely to lag national; underwrite the cash flow, not the appreciation.
- At projected returns (-3.0% appreciation + 6.8% rent growth), your $48k cash investment doubles in ~10 years — after that, you're playing with house money.
Negotiation context
- It's been on market 20 days — a 2% lower offer ($167k) is reasonable based on typical stale-listing flexibility.
- 6 sale attempts since 22y ago with the ask held roughly flat each time — persistent listings suggest the price (not the market) is what's stuck; bring a comps-based counter.
- Current owner paid $115k; 48% above their basis — modest negotiation headroom, anchor on the comps not their cost.
Risks & watch-outs
- Watch-outs: property tax is 2.6% of price; built in 1952 — expect roof / HVAC / electrical / plumbing capex.
Questions for the listing agent
- Built in 1952 — when were the roof, HVAC, electrical panel, plumbing, and water heater last replaced?
- Property tax is high relative to price — has the assessment been appealed recently, and will the sale trigger a re-assessment?
- Is there a deadline driving the sale (1031 exchange, divorce, estate, relocation)? That informs how much negotiation room exists.
- Schools are B-rated — typically a magnet for longer-tenancy family renters. What's the average tenant stay here, and is there a school-zone premium baked into asking?
- The area grade is low — what's the realistic commute time and amenity access for the typical tenant pool here? Any planned neighborhood developments (good or bad) we should know about?
- What's the average days-on-market for RENTAL listings here right now (not sales)? A rising rental-DOM trend means longer vacancies and softer asking-rent achievability than the comps imply.
- What's the recent tenant-quality profile in this submarket — average credit score on applications, eviction rate, late-payment / NSF rate, and stable-employment percentage? A property-management company in the area should have these aggregated.
- How much new for-sale + rental construction is in the pipeline within 1–3 miles? Heavy new supply typically softens prices + rents 12–24 months out; constrained supply supports both.
Investment metrics
- 1% rule
- 1.12% ✓
- Cap rate
- 7.46%
- Cash-on-cash
- 4.15%
- DSCR
- 1.18
- GRM
- 7.5
CMA / ARV
- ARV (on-the-fly)
- $156,400
- Comps found
- 12
Show comp detail 12 sales within ~0.75 mi
| Address | Dist | Beds/Ba | Sqft | Sold | Price | $/sf | Match |
|---|---|---|---|---|---|---|---|
| 3752 Wallingford Rd | 0.29mi | 3/1.5 | 1,314 (-3%) | 1mo | $190,000 | $145 | 80 |
| 220 Greenvale Rd | 0.35mi | 3/1.5 | 1,259 (-7%) | 3mo | $108,000 | $86 | 69 |
| 2078 Miami Rd | 0.58mi | 3/1.5 | 1,379 (+1%) | 3mo | $165,000 | $120 | 68 |
| 3867 Covington Rd | 0.41mi | 3/2.5 | 1,422 (+5%) | 5mo | $175,000 | $123 | 65 |
| 3570 Randolph Rd | 0.55mi | 3/1.0 | 1,286 (-5%) | 1mo | $147,500 | $115 | 62 |
| 3639 Randolph Rd | 0.54mi | 3/1.0 | 1,248 (-8%) | 2mo | $130,000 | $104 | 58 |
| 2017 Natona Rd | 0.66mi | 3/2.0 | 1,296 (-5%) | 3mo | $147,000 | $113 | 57 |
| 923 Cambridge Rd | 0.68mi | 3/1.5 | 1,472 (+8%) | 2mo | $217,000 | $147 | 53 |
| 2121 Alton Rd | 0.68mi | 3/1.0 | 1,218 (-10%) | 5mo | $90,000 | $74 | 45 |
| 862 Keystone Dr | 0.64mi | 4/1.5 (+1) | 1,549 (+14%) | 1mo | $229,900 | $148 | 41 |
| 2400 Noble Rd | 0.70mi | 4/1.0 (+1) | 1,220 (-10%) | 3mo | $139,900 | $115 | 40 |
| 952 Oxford Rd | 0.66mi | 4/2.0 (+1) | 1,560 (+15%) | 2mo | $180,000 | $115 | 37 |
Match score weights: distance 35% · size 25% · config 20% · recency 20%. Top-matched comps best support the ARV.
Projected returns pro-forma
-3.0% appreciation · 6.85% rent growth · sell at horizon
- IRR
- -5.0%
- Equity multiple
- 0.80×
- Total profit
- $-9,296
- Equity at exit
- $25,348
- IRR
- 9.1%
- Equity multiple
- 1.84×
- Total profit
- $39,835
- Equity at exit
- $14,698
Cash invested: $47,600 (down + closing). Projections, not guarantees.
Landlord ↔ Tenant lean methodology
- Overall (STATE)
- 73 Landlord-Friendly
- State Ohio
- 73 Landlord-Friendly · R+6
- County
- — inherits STATE
- City
- — inherits STATE
ZIP-level market 44121
- Rents YoY
- 6.8%
- Active inventory
- 148
- Price-to-rent
- 7.5×
Monthly cashflow live
- Estimated rent
- $1,897 high interval (Pro) →
- Mortgage (P&I)
- −$891
- Tax from tax record
- −$371 /mo · $4,457/yr
- Insurance
- −$71
- HOA
- −$0
- Vacancy / Maint / Mgmt
- −$398
- Net cashflow
- $165
Break-even live
UW: 25.0% down · 7.5% · 30yr · 1.5% tax · 5.0% vac · 8.0% maint · 8.0% mgmt
Financing live
Cash to close
- Down payment
- $42,500
- Closing costs
- $5,100
- Reserves months
- —
- Total cash needed
- —
Loan-product check · same deal, 3 products live
Conventional
25% down · 7.5% · 30yr
- Down + closing
- —
- Monthly P&I
- —
- Monthly cashflow
- —
- DSCR
- —
- Eligible?
- —
Personal DTI + credit; lowest rate.
DSCR
20% down · 8.5% · 30yr
- Down + closing
- —
- Monthly P&I
- —
- Monthly cashflow
- —
- DSCR
- —
- Eligible?
- —
No personal income docs; deal must DSCR.
Hard money
10% down · 12.0% · 12mo
- Down + closing
- —
- Monthly P&I
- —
- Monthly cashflow
- —
- DSCR
- —
- Eligible?
- —
Short-term bridge; refi at stabilization.
Rent comps 27 comps
| Address | Beds | Baths | Sqft | Rent | $/sqft | DOM | Units | Dist |
|---|---|---|---|---|---|---|---|---|
| 3802 Princeton Blvd Cleveland, OH | 3.0 | 1.5 | 1656 | $2,275 | $1.37 | 1d | 1 | 0.08mi |
| 303 S Green Rd Cleveland, OH | 4.0 | 2.0 | 1381 | $1,700 | $1.23 | 1d | 1 | 0.66mi |
| 994 Yellowstone Rd Cleveland, OH | 3.0 | 2.0 | 1475 | $1,395 | $0.95 | 2d | 1 | 0.78mi |
| 1007 Elbon Rd Cleveland, OH | 3.0 | 1.0 | 1386 | $1,400 | $1.01 | 10d | 1 | 0.88mi |
| 963 Selwyn Rd Cleveland, OH | 4.0 | 1.0 | 1300 | $2,650 | $2.04 | 1d | 1 | 0.91mi |
| 967 Selwyn Rd Cleveland, OH | 3.0 | 1.5 | 1214 | $1,595 | $1.31 | 16d | 1 | 0.91mi |
| 1035 Elbon Rd Cleveland, OH | 4.0 | 1.5 | 1304 | $1,675 | $1.28 | 16d | 1 | 0.93mi |
| 953 Whitby Rd Cleveland, OH | 3.0 | 2.0 | 1188 | $1,575 | $1.33 | 23d | 1 | 0.93mi |
| 915 Nela View Rd Cleveland, OH | 4.0 | 1.0 | 1300 | $2,600 | $2.00 | 16d | 1 | 0.94mi |
| 3430 Winsford Rd Cleveland, OH | 4.0 | 1.5 | 1800 | $1,590 | $0.88 | 16d | 1 | 0.96mi |
| 886 Helmsdale Rd Cleveland Heights, OH | 2.0 | 1.0 | 1037 | $995 | $0.96 | 16d | 1 | 0.96mi |
| 876 Eloise Dr Unit Upper Cleveland Heights, OH | 2.0 | 1.0 | 1233 | $1,200 | $0.97 | 16d | 1 | 0.99mi |
| 983 Greyton Rd Cleveland, OH | 3.0 | 2.0 | 1457 | $1,495 | $1.03 | 16d | 1 | 1.02mi |
| 1099 Woodview Rd Cleveland, OH | 4.0 | 1.0 | 1500 | $2,500 | $1.67 | 1d | 1 | 1.06mi |
| 3917 Bluestone Rd Cleveland, OH | 4.0 | 1.5 | 1700 | $1,650 | $0.97 | 21d | 1 | 1.09mi |
| 25 Trenton Sq Unit T54 Cleveland, OH | 3.0 | 2.0 | 1324 | $1,500 | $1.13 | 16d | 1 | 1.09mi |
| 16000 Terrace Rd Cleveland, OH | 1.0–3.0 | 1.0–2.0 | 1000 | $1,210 | $1.21 | 1d | 39 | 1.12mi |
| 910 Dresden Rd Cleveland, OH | 4.0 | 2.0 | 1839 | $1,800 | $0.98 | 16d | 1 | 1.20mi |
| 3406 Henderson Rd Cleveland, OH | 4.0 | 1.5 | 1343 | $2,250 | $1.68 | 16d | 1 | 1.21mi |
| 3337 Sylvanhurst Rd Cleveland, OH | 3.0 | 1.0 | 1334 | $1,800 | $1.35 | 7d | 1 | 1.25mi |
| 3808 Kirkwood Rd Cleveland, OH | 4.0 | 1.5 | 1740 | $2,150 | $1.24 | 14d | 1 | 1.25mi |
| 19750 Euclid Ave Euclid, OH | 1.0–3.0 | 1.0–1.5 | 840 | $1,350 | $1.61 | 16d | 3 | 1.31mi |
| 20051 Green Oak Dr Euclid, OH | 3.0 | 1.5 | 1092 | $1,550 | $1.42 | 14d | 1 | 1.33mi |
| 3810 Parkdale Rd Cleveland, OH | 3.0 | 1.5 | 1281 | $2,067 | $1.61 | 2d | 1 | 1.38mi |
| 2401 N Taylor Rd Cleveland, OH | 3.0 | 1.0 | 1347 | $1,325 | $0.98 | 7d | 1 | 1.42mi |
| 2868 Noble Rd Cleveland, OH | 3.0 | 1.5 | 1200 | $1,250 | $1.04 | 23d | 1 | 1.42mi |
| 2868 Noble Rd Unit 16 Cleveland Heights, OH | 3.0 | 1.5 | 1200 | $1,750 | $1.46 | 1d | 1 | 1.43mi |
Listing history 14 events
-
2026-06-18days on market $170,000 Active 20 DOM
-
2026-06-17days on market $170,000 Active 19 DOM
-
2026-06-16days on market $170,000 Active 18 DOM
-
2026-06-15days on market $170,000 Active 17 DOM
-
2026-06-13days on market $170,000 Active 15 DOM
-
2026-06-13days on market $170,000 Active 14 DOM
-
2026-06-09days on market $170,000 Active 11 DOM
-
2026-06-08days on market $170,000 Active 10 DOM
-
2026-06-07pricedays on market $170,000 Active 9 DOM
-
2026-06-05days on market $175,000 Active 6 DOM
-
2026-06-03days on market $175,000 Active 5 DOM
-
2026-06-02days on market $175,000 Active 4 DOM
-
2026-06-01days on market $175,000 Active 3 DOM
-
2026-05-31days on market $175,000 Active 2 DOM
ⓘ Source: listings_history table (triggers on properties + properties_extension) + one-shot
backfill from property_details.listing_events for pre-trigger history.
Tax reassessment forecast OH · Partial reset (capped growth)
- Current annual tax
- $4,457 · $371/mo
- Projected year-2 tax
- $4,457 · $371/mo
- Expected delta
- $0/yr ($0/mo · 0.0%)
ⓘ Screening estimate from a state-policy table — verify with the county assessor before closing.
Climate risk First Street
- Flood 1/10 Low FEMA zone X (unshaded) · 0% chance over 30 yrs
- Wildfire 1/10 Low
- Heat 2/10 Low 6 d/yr ≥95°F today · 14 d/yr by 30 yrs out
- Wind 1/10 Low
- Air quality 3/10 Moderate 2 unhealthy d/yr today · 5 by 30 yrs out
Nearby sold comps map
Loading sold comps map…
Walkable amenities ~0.75 mi
Loading nearby amenities…
Taxation est. · year 1
- Rental income
- $22,762
- − Mortgage interest
- −$9,523
- − Property taxes
- −$4,457
- − Insurance
- −$850
- − Repairs & maintenance
- −$1,821
- − Management
- −$1,821
- − Depreciation
- −$4,945
- Taxable loss
- −$655
- Est. tax savings @ 24.0%
- +$157
- After-tax cash flow
- $2,134/yr
For passive investors: Depreciation is non-cash, so a rental often shows a tax loss while cash-flowing — sheltering income. Rental losses are passive: they offset passive income freely, and up to $25,000/yr can offset ordinary (W-2) income if you actively participate and your MAGI is under $100k (phasing out to $0 by $150k); unused losses carry forward. On sale, claimed depreciation is recaptured at up to 25%, and gains may owe capital-gains tax (a 1031 exchange can defer both). Figures are a year-1 estimate at your 24.0% rate — not tax advice; consult a CPA.
Schools (NCES district)
- District
- South Euclid-Lyndhurst City
- NCES district ID
- 3904479
- Math proficiency
- 23% ▼ -22.00%
- Reading proficiency
- 45% ▼ -11.00%
- Median HH income
- $61,244
- Composite
- 30.51/100
- National rank
- #6212
- State rank
- #556 of 656 in OH
Livability — South Euclid
- Score
- 88/100
- State rank
- #22
- US rank
- #207
Category grades
Schools grade is shown separately in the Schools card above.
Census & demographics
- Census place
- South Euclid, OH
- County
- Cuyahoga County · 1,090,369 people
- City population
- 32,668
- Metro
- Cleveland-Elyria, OH
- Population (ZIP)
- 32,312
- Household income
- $76,767
- Rent vs Own
- Severe rent burden
- 672.0
Population outlook (Cuyahoga County) Hauer SSP2
- Today (2025)
- 1,244,621 people
- By 2030
- 1,230,093 · -1.2%
- By 2040
- 1,189,108 · -4.5%
- By 2050
- 1,145,706 · -7.9%
- By 2075
- 1,076,557 · -13.5%
- By 2100
- 978,987 · -21.3%
Race, ethnicity, and origin ACS 2023
- Neighborhood character
- Diverse neighborhood (Simpson 0.56)
- Race & ethnicity
- Black 55% White 36% Two or more races 4% Hispanic / Latino 3% Asian 2%
- Common ancestry
- Romanian 3% Italian 2% Scotch-Irish 2%
- Foreign-born
- 5% · Canada, China, India
- Languages at home
- 92% English-only · Spanish 2% Chinese 1% Other Indo-European 1%
Political lean MEDSL · Cuyahoga
- 2024 margin
- Solid D (+31.5) · D 65.4% · R 33.9%
- 2008→2024 swing
- -7.4pp toward R · 2008: 38.9pp · 2024: 31.5pp
- All cycles
- 2024: D+31.5 2020: D+34.1 2016: D+35.0 2012: D+38.7 2008: D+38.9
Not yet ingested
- Civics
- —
Market trends
- HPI YoY
- ▼ -180.15%
- Current HPI
- 173.7405
- Rent YoY
- ▲ 6.85%
- Metro
- Cleveland-Elyria, OH
- State GDP YoY
- ▲ 1.98%
- F500 in state
- 48
Industry mix (Fortune 500 HQ in OH)
| Industry | F500 HQs | Revenue |
|---|---|---|
| Insurance | 3 | $145B |
|
||
| Industrial Machinery | 3 | $49B |
|
||
| Financial Services | 3 | $24B |
|
||
| Consumer Goods | 2 | $93B |
|
||
| Aerospace / Defense | 2 | $47B |
|
||
| Utilities | 2 | $33B |
|
||
Price history
+503.4% since first listed21 events — show timeline
- 2026-05-28 Listed $175,000 MLSNOW
- 2024-10-24 Rental Removed $1,650 APPFOLIO
- 2024-10-15 Listed for Rent $1,650 APPFOLIO
- 2022-03-16 Sold (Public Records) $115,000 Public Records
- 2022-02-12 Listing Removed — MLSNOW
- 2022-01-26 Relisted — MLSNOW
- 2022-01-17 Contingent — MLSNOW
- 2021-12-29 Price Changed $130,000 MLSNOW
- 2021-08-17 Price Changed $138,000 MLSNOW
- 2021-08-12 Listed $126,000 MLSNOW
- 2016-02-16 Sold (Public Records) $65,500 Public Records
- 2016-02-16 Sold (MLS) $65,500 MLSNOW
- 2015-12-30 Contingent — MLSNOW
- 2015-11-05 Price Changed $74,500 MLSNOW
- 2015-08-31 Price Changed $78,500 MLSNOW
- 2015-07-16 Listed $85,000 MLSNOW
- 2004-07-16 Sold (Public Records) $129,000 Public Records
- 2004-07-16 Sold (MLS) $129,000 MLSNOW
- 2004-07-05 Listing Removed — MLSNOW
- 2004-04-05 Listed $129,900 MLSNOW
- 1972-07-01 Sold (Public Records) $29,000 Public Records
Property tax history
+3.9%/yrLatest (2025): $4,457 · +9.9% YoY. Source: county tax records.
Cash-flow waterfall
monthlySold comps — $/sqft
last 12 mo · ≤1 miLoading sold comps…