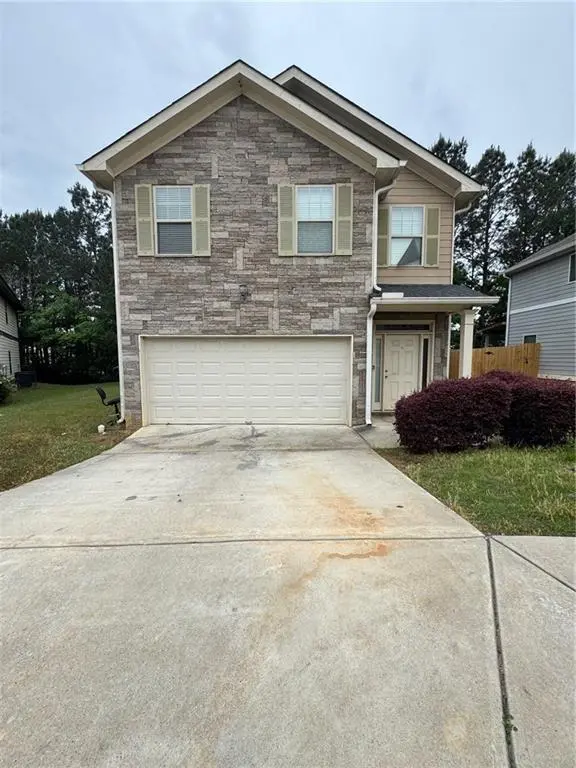
2283 Wentworth Dr · Forest Park, GA
Flood risk 1/10 · Minimal
- FEMA flood zone
- X (unshaded)
- Chance of flooding over 30 yrs
- 0.0%
- Est. flood insurance / yr
- $507 – $1,088
Fire risk 1/10 · Minimal
- Est. fire insurance / yr
- $963 – $1,789
Heat risk 6/10 · Moderate
- Hot days now (above 105°F)
- 7 days/yr
- Hot days in 30 yrs
- 19 days/yr
Wind risk 5/10 · Moderate
- Chance of severe wind over 30 yrs
- 26.0%
Air-quality risk 4/10 · Minor
- Unhealthy air days now
- 4 days/yr
- Unhealthy air days in 30 yrs
- 6 days/yr
Risk factors via First Street. Map © Google.
Why this score? — see what drove the D+ grade
The composite is a weighted blend of 9 inputs, each scored 0–100. Each bar is that input's sub-score; the figure is the points it added to the 100-point composite (weight × sub-score).
- Cash flow +14.8/30.0
- ARV discount +14.8/15.0
- 1% rule +4.6/10.0
- DSCR +4.5/10.0
- Livability +3.2/5.0
- Condition / age +2.5/5.0
- Rent growth +2.2/5.0
- Schools +1.3/10.0
- Appreciation +0.0/10.0
$230,000
🖨 Deal sheet 📄 Offer letter ✓ Due diligence
Listing remarks
Spacious 4-bedroom, 3-bath home in Morrow offering approximately 2,200 sq ft of opportunity! Ideal light fixer-upper for investors or buyers seeking a property with strong upside potential. Functional floorplan features one bedroom and a full bath with shower on the main level, offering flexible use options. Remaining bedrooms are upstairs with ample living space throughout. Home primarily needs light cosmetic updates, making it a great value-add project without major renovation scope. Conveniently located near shopping, dining, schools, and major interstates for easy commuting. Strong rental potential with nearby rents reportedly ranging approximately $2,050–$2,150/month. Great chanc
Key facts
- 4,547 sq ft lot
- 2 garage spots
- Built 2017
Property features AI
Finance
- Other: Road frontage on a city street; Directions: Please use Google Maps; Located in Clayton County, GA
- HOA & community: Property has an association
Exterior
- Parking: Detached or attached garage (2 garage spaces); Garage faces front; Driveway parking available; Open parking available
- Utilities: Public water; Sewer: Other; Electricity available; Natural gas available; Cable available
- Home design: Two levels; Vinyl siding construction; Shingle roof; Property listed as fixer
- Construction: Vinyl siding; Shingle roof
- Exterior features: Private yard; Patio; Back yard wood fencing
Interior
- Kitchen: Breakfast bar; Kitchen island; Stone countertops; Open view to family room; Dishwasher; Electric cooktop; Refrigerator
- Bedrooms: One main-level bedroom; Three upper-level bedrooms; Oversized master bedroom
- Flooring: Luxury vinyl flooring
- Bathrooms: Three full bathrooms; One main-level bathroom; Two full upper-level bathrooms; Master bath with double vanity, separate tub and shower, and soaking tub
- Heating & cooling: Central heating; Central air conditioning; Ceiling fans
- Interior features: Cathedral ceilings; Double vanities; Walk-in closets; No shared/common walls; Accessible bedroom and full bath; Attic space
- Laundry & utility: Upper-level laundry in hall/closet; Gas dryer hookup
Neighborhood map
What this means for you Summary
Snapshot
- This is a 4-bed/3.0-bath single-family listed at $230k.
Deal economics
- At list price, monthly cash flow is $65 ($781/yr) — positive.
- The deal already cash-flows at list — no discount required.
- To meet the 1% rule (rent ≥ 1% of price), the offer needs to be $221k (3.9% below list).
- Recommended offer: $221k (3.9% below list) — sets the bar for 1% rule.
- Cap rate 6.6% vs local median 5.2% in Forest Park — meaningfully above typical; check what's discounted (condition, days-on-market, listing class) to confirm the premium yield is real.
Location & tenants
- Location reads 65/100 on livability (#209 in GA) — a middle-class / working-renter tenant base. Strengths: cost of living A+, housing A+, health & safety A-; Watch: crime F, commute F, employment D-.
- Clayton County (suburban): math 11% / reading 20% proficiency, ranked #155 of 174 in GA (top 89%) — low school quality limits family demand, transient renter base, plan for 1-2y turnover; 78% free/reduced lunch — lower-income household profile, screen leases tightly.
- Zoned schools: Thurgood Marshall Elementary School (math 30% / reading 10%, grade F, #865 of 1,228 statewide, top 71%, 793 students, 90% FRL); Morrow Middle School (math 14% / reading 24%, grade F, #368 of 470 statewide, top 79%, 779 students, 90% FRL); Morrow High School (math 12% / reading 22%, grade F, #277 of 424 statewide, top 67%, 1,980 students, 91% FRL).
- Market conditions: Rents soft (-1.0%/yr); 166 active listings in the ZIP; 12 comparable units currently listed for rent nearby; rentals at typical pace (median 17d on market — plan ~3-4 weeks tenant-placement turnaround); 42% of comp listings sitting > 30 days — soft ceiling on asking rent; 865 units permitted in Clayton County in 2024 (448 in 5+ unit buildings).
- At $2,210/mo this rent would consume 50% of the median local household income ($53k/yr) (locally 1956% of renters already pay >50% of income on rent) — very limited rent-growth headroom before tenants either downsize or default.
Forward outlook
- Local home prices are declining (-3.0%/yr); year-one equity from $2k of loan paydown is wiped out by about $7k of value loss. Plan a longer hold.
- Clayton County population projected at +29% by 2050 — long-run rental-demand tailwind backs the buy-and-hold thesis.
Negotiation context
- It's been on market 34 days — a 3% lower offer ($223k) is reasonable based on typical stale-listing flexibility.
Risks & watch-outs
- Climate carrying-cost: moderate wind risk, 26% chance of damaging wind over 30y; extreme-heat days projected 7→19/yr by 2055 (HVAC capex compounding) — expect insurance premiums to compound above CPI over the hold.
Questions for the listing agent
- It's been on market 34 days. Have you received any prior offers? Is the seller open to a 4% concession, seller financing, or rate buy-down credit?
- Is there a deadline driving the sale (1031 exchange, divorce, estate, relocation)? That informs how much negotiation room exists.
- Schools are F-rated, which usually means shorter tenancies and higher turnover. Who's the typical renter profile here, and what's been the actual vacancy rate?
- Crime grade is F in this area — have there been break-ins, vandalism, or insurance claims at this property in the last 3 years? What carrier currently insures it and at what premium?
- The area grade is low — what's the realistic commute time and amenity access for the typical tenant pool here? Any planned neighborhood developments (good or bad) we should know about?
- What's the average days-on-market for RENTAL listings here right now (not sales)? A rising rental-DOM trend means longer vacancies and softer asking-rent achievability than the comps imply.
- What's the recent tenant-quality profile in this submarket — average credit score on applications, eviction rate, late-payment / NSF rate, and stable-employment percentage? A property-management company in the area should have these aggregated.
- How much new for-sale + rental construction is in the pipeline within 1–3 miles? Heavy new supply typically softens prices + rents 12–24 months out; constrained supply supports both.
Investment metrics
- 1% rule
- 0.96% ✗
- Cap rate
- 6.63%
- Cash-on-cash
- 1.21%
- DSCR
- 1.05
- GRM
- 8.7
CMA / ARV
- ARV (median comp)
- $274,425
- List price
- $230,000
- Delta
- -16.19%
- Verdict
- UNDERPRICED
- Comps
- 20 within 1.0 mi
Show comp detail 5 sales within ~0.75 mi
| Address | Dist | Beds/Ba | Sqft | Sold | Price | $/sf | Match |
|---|---|---|---|---|---|---|---|
| 2283 Wentworth Dr | 0.00mi | 4/3.0 | 2,200 (0%) | 1mo | $244,000 | $111 | 99 |
| 2286 Wentworth Dr | 0.04mi | 4/3.0 | 2,200 (0%) | 23mo | $320,000 | $145 | 80 |
| 5170 2nd St | 0.50mi | 4/3.5 | 2,080 (-6%) | 12mo | $248,700 | $120 | 56 |
| 1991 Summerview Ct | 0.57mi | 4/2.5 | 2,207 (+0%) | 21mo | $295,000 | $134 | 54 |
| 5140 4th St | 0.42mi | 3/2.0 (-1) | 2,000 (-9%) | 22mo | $250,000 | $125 | 38 |
Match score weights: distance 35% · size 25% · config 20% · recency 20%. Top-matched comps best support the ARV.
Projected returns pro-forma
-3.0% appreciation · 0.0% rent growth · sell at horizon
- IRR
- -17.9%
- Equity multiple
- 0.39×
- Total profit
- $-39,513
- Equity at exit
- $34,294
- IRR
- -17.9%
- Equity multiple
- 0.17×
- Total profit
- $-53,736
- Equity at exit
- $19,886
Cash invested: $64,400 (down + closing). Projections, not guarantees.
Landlord ↔ Tenant lean methodology
- Overall (STATE)
- 90 Strongly Landlord-Friendly
- State Georgia
- 90 Strongly Landlord-Friendly · R+3
- County
- — inherits STATE
- City
- — inherits STATE
ZIP-level market 30260
- Home prices YoY
- -33.8%
- Rents YoY
- -1.0%
- Active inventory
- 166
- Price-to-rent
- 8.7×
Monthly cashflow live
- Estimated rent
- $2,210 high interval (Pro) →
- Mortgage (P&I)
- −$1,206
- Tax from tax record
- −$379 /mo · $4,545/yr
- Insurance
- −$96
- HOA
- −$0
- Vacancy / Maint / Mgmt
- −$464
- Net cashflow
- $65
Break-even live
UW: 25.0% down · 7.5% · 30yr · 1.5% tax · 5.0% vac · 8.0% maint · 8.0% mgmt
Financing live
Cash to close
- Down payment
- $57,500
- Closing costs
- $6,900
- Reserves months
- —
- Total cash needed
- —
Loan-product check · same deal, 3 products live
Conventional
25% down · 7.5% · 30yr
- Down + closing
- —
- Monthly P&I
- —
- Monthly cashflow
- —
- DSCR
- —
- Eligible?
- —
Personal DTI + credit; lowest rate.
DSCR
20% down · 8.5% · 30yr
- Down + closing
- —
- Monthly P&I
- —
- Monthly cashflow
- —
- DSCR
- —
- Eligible?
- —
No personal income docs; deal must DSCR.
Hard money
10% down · 12.0% · 12mo
- Down + closing
- —
- Monthly P&I
- —
- Monthly cashflow
- —
- DSCR
- —
- Eligible?
- —
Short-term bridge; refi at stabilization.
Rent comps 12 comps
| Address | Beds | Baths | Sqft | Rent | $/sqft | DOM | Units | Dist |
|---|---|---|---|---|---|---|---|---|
| 2271 Wentworth Park Dr Ellenwood, GA | 4.0 | 2.5 | 1705 | $2,119 | $1.24 | 16d | 1 | 0.05mi |
| 2314 Shady Dr Morrow, GA | 4.0 | 2.5 | 1705 | $2,179 | $1.28 | 11d | 1 | 0.17mi |
| 2401 Bethune Cir Morrow, GA | 3.0 | 2.5 | 1696 | $2,095 | $1.24 | 5d | 1 | 0.67mi |
| 4974 Summersun Dr Morrow, GA | 4.0 | 2.0 | 1935 | $2,370 | $1.22 | 1d | 1 | 0.83mi |
| 2603 Old Rex Morrow Rd Ellenwood, GA | 4.0 | 3.0 | 1800 | $2,510 | $1.39 | 44d | 1 | 0.92mi |
| 5704 Wesson Dr Ellenwood, GA | 3.0 | 2.0 | 1480 | $1,710 | $1.16 | 43d | 1 | 0.94mi |
| 2617 Old Rex Morrow Rd Ellenwood, GA | 4.0 | 3.0 | 1800 | $1,950 | $1.08 | 12d | 1 | 0.94mi |
| 5789 Colt Ct Ellenwood, GA | 4.0 | 3.0 | 1877 | $2,020 | $1.08 | 43d | 1 | 1.11mi |
| 5762 Northspring Dr Ellenwood, GA | 3.0 | 2.0 | 1577 | $1,705 | $1.08 | 12d | 1 | 1.13mi |
| 2710 Luke Dr Ellenwood, GA | 4.0 | 3.0 | 2213 | $2,435 | $1.10 | 43d | 1 | 1.14mi |
| 5868 Dan Dr Ellenwood, GA | 3.0 | 2.0 | 1854 | $2,300 | $1.24 | 43d | 1 | 1.24mi |
| 2941 Partin Pl Ellenwood, GA | 4.0 | 2.5 | 1874 | $2,155 | $1.15 | 15d | 1 | 1.45mi |
Listing history 9 events
-
2026-06-07statusdays on market $230,000 Pending 34 DOM
-
2026-06-04days on market $230,000 Active Under Contract 33 DOM
-
2026-06-03days on market $230,000 Active Under Contract 32 DOM
-
2026-06-02days on market $230,000 Active Under Contract 31 DOM
-
2026-06-01days on market $230,000 Active Under Contract 30 DOM
-
2026-05-31days on market $230,000 Active Under Contract 29 DOM
-
2026-05-08historical Active Under Contract 753-char remark
-
2026-05-02$230,000 Active 753-char remark
-
2026-05-02historical $230,000 753-char remark
ⓘ Source: listings_history table (triggers on properties + properties_extension) + one-shot
backfill from property_details.listing_events for pre-trigger history.
Tax reassessment forecast GA · Resets to sale price
- Current annual tax
- $4,545 · $379/mo
- Projected year-2 tax
- $4,545 · $379/mo
- Expected delta
- $0/yr ($0/mo · 0.0%)
ⓘ Screening estimate from a state-policy table — verify with the county assessor before closing.
Climate risk First Street
- Flood 1/10 Low FEMA zone X (unshaded) · 0% chance over 30 yrs
- Wildfire 1/10 Low
- Heat 6/10 Major 7 d/yr ≥105°F today · 19 d/yr by 30 yrs out
- Wind 5/10 Major 26% chance of damaging wind over 30 yrs
- Air quality 4/10 Moderate 4 unhealthy d/yr today · 6 by 30 yrs out
Nearby sold comps map
Loading sold comps map…
Walkable amenities ~0.75 mi
Loading nearby amenities…
Taxation est. · year 1
- Rental income
- $26,518
- − Mortgage interest
- −$12,884
- − Property taxes
- −$4,545
- − Insurance
- −$1,150
- − Repairs & maintenance
- −$2,121
- − Management
- −$2,121
- − Depreciation
- −$6,691
- Taxable loss
- −$2,994
- Est. tax savings @ 24.0%
- +$719
- After-tax cash flow
- $1,499/yr
For passive investors: Depreciation is non-cash, so a rental often shows a tax loss while cash-flowing — sheltering income. Rental losses are passive: they offset passive income freely, and up to $25,000/yr can offset ordinary (W-2) income if you actively participate and your MAGI is under $100k (phasing out to $0 by $150k); unused losses carry forward. On sale, claimed depreciation is recaptured at up to 25%, and gains may owe capital-gains tax (a 1031 exchange can defer both). Figures are a year-1 estimate at your 24.0% rate — not tax advice; consult a CPA.
Schools (NCES district)
- District
- Clayton County
- NCES district ID
- 1301230
- Math proficiency
- 11% ▼ -13.00%
- Reading proficiency
- 20% ▼ -9.00%
- Median HH income
- $42,266
- Composite
- 13.41/100
- National rank
- #9527
- State rank
- #155 of 174 in GA
Livability — Forest Park
- Score
- 65/100
- State rank
- #209
- US rank
- #12698
Category grades
Schools grade is shown separately in the Schools card above.
Census & demographics
- County
- Clayton County · 230,153 people
- City population
- 29,210
- Metro
- Atlanta-Sandy Springs-Alpharetta, GA
- Population (ZIP)
- 28,693
- Household income
- $52,666
- Rent vs Own
- Severe rent burden
- 1956.0
Population outlook (Clayton County) Hauer SSP2
- Today (2025)
- 310,777 people
- By 2030
- 329,762 · +6.1%
- By 2040
- 368,052 · +18.4%
- By 2050
- 401,196 · +29.1%
- By 2075
- 472,488 · +52.0%
- By 2100
- 500,446 · +61.0%
Race, ethnicity, and origin ACS 2023
- Neighborhood character
- Diverse neighborhood (Simpson 0.67)
- Race & ethnicity
- Black 50% Asian 20% Hispanic / Latino 19% Two or more races 7% White 7%
- Hispanic origin (detail)
- Mexican 11% Dominican 1%
- Foreign-born
- 24% · Vietnam, Canada, South Korea
- Languages at home
- 63% English-only · Spanish 17% Vietnamese 16% Other Asian/Pacific 1%
Political lean MEDSL · Clayton
- 2024 margin
- Solid D (+69.2) · D 84.3% · R 15.1%
- 2008→2024 swing
- +2.8pp toward D · 2008: 66.4pp · 2024: 69.2pp
- All cycles
- 2024: D+69.2 2020: D+70.9 2016: D+71.9 2012: D+70.1 2008: D+66.4
Not yet ingested
- Civics
- —
Market trends
- HPI YoY
- ▼ -98.24%
- Current HPI
- 192.3741
- Rent YoY
- ▼ -1.00%
- Metro
- Atlanta-Sandy Springs-Alpharetta, GA
- State GDP YoY
- ▲ 2.66%
- F500 in state
- 28
Industry mix (Fortune 500 HQ in GA)
| Industry | F500 HQs | Revenue |
|---|---|---|
| Paper / Packaging | 2 | $29B |
|
||
| Retail | 1 | $160B |
|
||
| Transportation / Logistics | 1 | $91B |
|
||
| Airlines | 1 | $62B |
|
||
| Consumer Goods | 1 | $47B |
|
||
| Utilities | 1 | $25B |
|
||
Price history
+6.1% since first listed5 events — show timeline
- 2026-06-05 Pending — FMLS
- 2026-05-29 Sold (MLS) $244,000 FMLS
- 2026-05-08 Contingent — FMLS
- 2026-05-02 Listed $230,000 FMLS
- 2026-05-02 Coming Soon $230,000 FMLS
Property tax history
+17.0%/yrLatest (2025): $4,545 · -9.1% YoY. Source: county tax records.
Cash-flow waterfall
monthlySold comps — $/sqft
last 12 mo · ≤1 miLoading sold comps…