 11-Plex
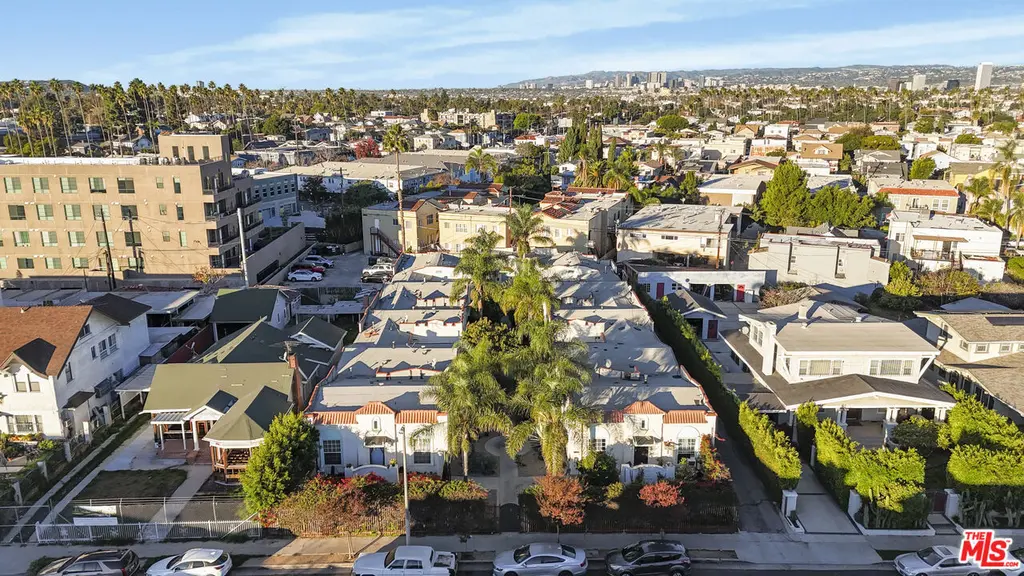
1533 6th Ave · Los Angeles, CA
Flood risk 1/10 · Minimal
- FEMA flood zone
- X (unshaded)
- Chance of flooding over 30 yrs
- 0.0%
- Est. flood insurance / yr
- $507 – $1,088
Fire risk 1/10 · Minimal
- Est. fire insurance / yr
- $659 – $1,223
Heat risk 6/10 · Moderate
- Hot days now (above 89°F)
- 7 days/yr
- Hot days in 30 yrs
- 21 days/yr
Wind risk 1/10 · Minimal
- Chance of severe wind over 30 yrs
- —
Air-quality risk 5/10 · Moderate
- Unhealthy air days now
- 7 days/yr
- Unhealthy air days in 30 yrs
- 7 days/yr
Risk factors via First Street. Map © Google.
Why this score? — see what drove the D grade
The composite is a weighted blend of 9 inputs, each scored 0–100. Each bar is that input's sub-score; the figure is the points it added to the 100-point composite (weight × sub-score).
- Cash flow +15.7/30.0
- ARV discount +7.5/15.0
- DSCR +4.8/10.0
- 1% rule +3.7/10.0
- Schools +3.6/10.0
- Livability +3.4/5.0
- Condition / age +2.5/5.0
- Rent growth +2.4/5.0
- Appreciation +0.0/10.0
$3,250,000
🖨 Deal sheet (PDF) 📄 Offer letter ✓ Due diligence
Multi-family units
County records classify this as Multi-Family (5+ Unit). Listing-text estimate: 11 units. confirmed
5+ unit building — per-unit beds/baths from public records are typically unavailable; the breakdown below (if shown) is an estimate from the listing text.
Listing remarks MLS
1533 6th Avenue is a charming 11-unit garden apartment building situated in the Central Arlington Heights Historic District. The beautiful Spanish Colonial Revival architecture is a throwback to old Los Angeles with a touch of Andalusia. Each casita features vaulted barrel ceilings, hardwood flooring, and patios that open into a shared courtyard. The majority of the units have been extensively renovated to include new windows, chef's kitchens with stainless steel appliances, washer/dryer hook-ups, and private yards. The property's diverse unit mix consists of seven 2+1's and four 1+1's. The property consistently generates above market rents while still maintaining opportunity for growth. In addition, there is ample tenant parking, owned communal laundry machines for extra income, and the property is positioned on a massive 21,750 square foot double lot. Superbly located, 1533 6th Avenue provides residents with many of the great things LA has to offer right outside their front door. The property features a stellar 85 walk score and is central to major employment, freeways, and points of interest alike. Tenants with children have numerous nearby parks and schools to choose from, including Queen Anne Park, Arlington Heights Elementary, and Johnnie Cochran Middle School. Public transit is easily accessible at the corner bus stop where the line 33 Metro takes riders to Santa Monica, Downtown, and everywhere in-between. 1533 6th Avenue offers investors the opportunity to cash flow, hedge against inflation, leverage tax advantages, and add more value.
Key facts
- 0.5 acre lot
- 9 parking spots
- Built 1922
Neighborhood map
What this means for you Summary
Snapshot
- This is a 7×2bd/1ba + 4×1bd/1ba units multifamily listed at $3.25M.
Deal economics
- At list price, monthly cash flow is $1k ($17k/yr) — positive. Per door: $128/mo.
- The deal already cash-flows at list — no discount required.
- To meet the 1% rule (rent ≥ 1% of price), the offer needs to be $2.84M (12.6% below list).
- Recommended offer: $2.84M (12.6% below list) — sets the bar for 1% rule.
- Cap rate 6.8% vs local median 2.1% in Los Angeles — top-decile yield for the area; either an underpriced asset or a hidden risk that comps aren't pricing in. Stress-test before assuming the spread holds.
Location & tenants
- Location reads 68/100 on livability (#273 in CA) — a middle-class / working-renter tenant base. Strengths: amenities A+, commute A+, employment B; Watch: health & safety C-, crime F, cost of living F.
- Los Angeles Unified (urban): math 29% / reading 54% proficiency, ranked #223 of 517 in CA (top 43%) — families likely to look elsewhere, expect single-tenant / working-renter base with shorter leases; 67% free/reduced lunch — lower-income household profile, screen leases tightly.
- Zoned schools: Arlington Heights Elementary (311 students, 96% FRL); Johnnie Cochran Jr. Middle (545 students, 99% FRL); Los Angeles Senior High (math 16% / reading 43%, grade F, #750 of 1,170 statewide, top 66%, 1,043 students, 95% FRL) — zoned schools average 97% FRL vs 67% district-wide (29 pts higher); higher-poverty schools than district average — tighter screening recommended.
- Zoned-school proficiency averages 30% at this address vs 42% district-wide (-12 pts) — the specific schools serving this property underperform the Los Angeles Unified average; the district grade overstates school quality for this exact location.
- Market conditions: Rents soft (-0.5%/yr); 206 active listings in the ZIP; 19,697 units permitted in Los Angeles County in 2024 (9,426 in 5+ unit buildings).
Forward outlook
- Local home prices are declining (-3.0%/yr); year-one equity from $22k of loan paydown is wiped out by about $98k of value loss. Plan a longer hold.
- Los Angeles County population projected at +9% by 2050 — modest demand growth; plan on rents tracking national, not racing it.
Negotiation context
- It's been on market 87 days — a 6% lower offer ($3.06M) is reasonable based on typical stale-listing flexibility.
- 7 sale attempts since 22y ago with the ask held roughly flat each time — persistent listings suggest the price (not the market) is what's stuck; bring a comps-based counter.
- Current owner paid $2.25M; 45% above their basis — modest negotiation headroom, anchor on the comps not their cost.
Risks & watch-outs
- Watch-outs: built in 1922 — expect roof / HVAC / electrical / plumbing capex.
- Climate carrying-cost: extreme-heat days projected 7→21/yr by 2055 (HVAC capex compounding) — expect insurance premiums to compound above CPI over the hold.
Questions for the listing agent
- It's been on market 87 days. Have you received any prior offers? Is the seller open to a 13% concession, seller financing, or rate buy-down credit?
- Can we see the unit-by-unit rent roll, current vacancy, and any below-market leases? What's the average tenancy length?
- What capital expenditures (roof, boiler, parking lot, exteriors) have been made in the last 5 years, and what's planned in the next 2?
- Built in 1922 — when were the roof, HVAC, electrical panel, plumbing, and water heater last replaced?
- Why hasn't it sold? Are there any deal-killer items the seller is aware of (foundation, flood, title, zoning, code violations)?
- Is there a deadline driving the sale (1031 exchange, divorce, estate, relocation)? That informs how much negotiation room exists.
- Schools are D-rated, which usually means shorter tenancies and higher turnover. Who's the typical renter profile here, and what's been the actual vacancy rate?
- Crime grade is F in this area — have there been break-ins, vandalism, or insurance claims at this property in the last 3 years? What carrier currently insures it and at what premium?
- The area grade is low — what's the realistic commute time and amenity access for the typical tenant pool here? Any planned neighborhood developments (good or bad) we should know about?
- What's the average days-on-market for RENTAL listings here right now (not sales)? A rising rental-DOM trend means longer vacancies and softer asking-rent achievability than the comps imply.
- What's the recent tenant-quality profile in this submarket — average credit score on applications, eviction rate, late-payment / NSF rate, and stable-employment percentage? A property-management company in the area should have these aggregated.
- How much new apartment / multifamily construction is in the pipeline within 1–3 miles? Heavy new supply (>2% of stock underway) typically softens rents 12–24 months out; light construction supports rent growth.
Investment metrics
- 1% rule
- 0.87% ✗
- Cap rate
- 6.81%
- Cash-on-cash
- 1.86%
- DSCR
- 1.08
- GRM
- 9.5
CMA / ARV
- ARV (median comp)
- $1,838,526
- List price
- $3,250,000
- Delta
- 76.77%
- Verdict
- OVERPRICED
- Comps
- 20 within 1.0 mi
Projected returns pro-forma
-3.0% appreciation · 0.0% rent growth · sell at horizon
- IRR
- -16.6%
- Equity multiple
- 0.43×
- Total profit
- $-520,763
- Equity at exit
- $484,586
- IRR
- -14.6%
- Equity multiple
- 0.27×
- Total profit
- $-661,750
- Equity at exit
- $281,001
Cash invested: $910,000 (down + closing). Projections, not guarantees.
Landlord ↔ Tenant lean methodology
- Overall (CITY)
- 0 Strongly Tenant-Friendly
- State California
- 18 Strongly Tenant-Friendly · D+13
- County
- — inherits STATE
- City Los Angeles
- 0 Strongly Tenant-Friendly · D+22
ZIP-level market 90019
- Rents YoY
- -0.5%
- Active inventory
- 206
- Price-to-rent
- 102.6×
Monthly cashflow live
- Estimated rent
- $28,419 high interval (Pro) →
- Mortgage (P&I)
- −$17,043
- Tax from tax record
- −$2,647 /mo · $31,760/yr
- Insurance
- −$1,354
- HOA
- −$0
- Vacancy / Maint / Mgmt
- −$5,968
- Net cashflow
- $1,407
Break-even live
Sensitivity live
| Price | -10% $3,247 | -5% $2,327 | +0% $1,407 | +5% $487 | +10% $-433 |
|---|---|---|---|---|---|
| Rent | -10% $-838 | -5% $284 | +0% $1,407 | +5% $2,529 | +10% $3,652 |
| Rate | -1.0pp $3,044 | -0.5pp $2,233 | base $1,407 | +0.5pp $565 | +1.0pp $-292 |
11-unit breakdown (identical units grouped — click to expand)
| Units | Beds | Baths | Est. rent |
|---|---|---|---|
| 7× units | 2 | 1 | $18,480 |
| #1 | 2 | 1 | $2,640 |
| #2 | 2 | 1 | $2,640 |
| #3 | 2 | 1 | $2,640 |
| #4 | 2 | 1 | $2,640 |
| #5 | 2 | 1 | $2,640 |
| #6 | 2 | 1 | $2,640 |
| #7 | 2 | 1 | $2,640 |
| 4× units | 1 | 1 | $9,940 |
| #8 | 1 | 1 | $2,485 |
| #9 | 1 | 1 | $2,485 |
| #10 | 1 | 1 | $2,485 |
| #11 | 1 | 1 | $2,485 |
| Total (11 units) | $28,419 | ||
UW: 25.0% down · 7.5% · 30yr · 1.5% tax · 5.0% vac · 8.0% maint · 8.0% mgmt
Financing live
Cash to close
- Down payment
- $812,500
- Closing costs
- $97,500
- Reserves months
- —
- Total cash needed
- —
Loan-product check · same deal, 3 products live
Conventional
25% down · 7.5% · 30yr
- Down + closing
- —
- Monthly P&I
- —
- Monthly cashflow
- —
- DSCR
- —
- Eligible?
- —
Personal DTI + credit; lowest rate.
DSCR
20% down · 8.5% · 30yr
- Down + closing
- —
- Monthly P&I
- —
- Monthly cashflow
- —
- DSCR
- —
- Eligible?
- —
No personal income docs; deal must DSCR.
Hard money
10% down · 12.0% · 12mo
- Down + closing
- —
- Monthly P&I
- —
- Monthly cashflow
- —
- DSCR
- —
- Eligible?
- —
Short-term bridge; refi at stabilization.
Listing history 33 events
-
2026-06-21days on market $3,250,000 Active 87 DOM
-
2026-06-18days on market $3,250,000 Active 84 DOM
-
2026-06-17days on market $3,250,000 Active 83 DOM
-
2026-06-16days on market $3,250,000 Active 82 DOM
-
2026-06-15days on market $3,250,000 Active 81 DOM
-
2026-06-13days on market $3,250,000 Active 79 DOM
-
2026-06-09days on market $3,250,000 Active 75 DOM
-
2026-06-08days on market $3,250,000 Active 74 DOM
-
2026-06-07days on market $3,250,000 Active 73 DOM
-
2026-06-04days on market $3,250,000 Active 70 DOM
-
2026-06-03days on market $3,250,000 Active 69 DOM
-
2026-06-02days on market $3,250,000 Active 68 DOM
-
2026-06-01days on market $3,250,000 Active 67 DOM
-
2026-05-31days on market $3,250,000 Active 66 DOM
-
2026-05-14price $3,250,000 1570-char remark
Show marketing remark (1570 chars)
1533 6th Avenue is a charming 11-unit garden apartment building situated in the Central Arlington Heights Historic District. The beautiful Spanish Colonial Revival architecture is a throwback to old Los Angeles with a touch of Andalusia. Each casita features vaulted barrel ceilings, hardwood flooring, and patios that open into a shared courtyard. The majority of the units have been extensively renovated to include new windows, chef's kitchens with stainless steel appliances, washer/dryer hook-ups, and private yards. The property's diverse unit mix consists of seven 2+1's and four 1+1's. The property consistently generates above market rents while still maintaining opportunity for growth. In addition, there is ample tenant parking, owned communal laundry machines for extra income, and the property is positioned on a massive 21,750 square foot double lot. Superbly located, 1533 6th Avenue provides residents with many of the great things LA has to offer right outside their front door. The property features a stellar 85 walk score and is central to major employment, freeways, and points of interest alike. Tenants with children have numerous nearby parks and schools to choose from, including Queen Anne Park, Arlington Heights Elementary, and Johnnie Cochran Middle School. Public transit is easily accessible at the corner bus stop where the line 33 Metro takes riders to Santa Monica, Downtown, and everywhere in-between. 1533 6th Avenue offers investors the opportunity to cash flow, hedge against inflation, leverage tax advantages, and add more value.
-
2026-03-26$3,350,000 Active 1570-char remark
Show marketing remark (1570 chars)
1533 6th Avenue is a charming 11-unit garden apartment building situated in the Central Arlington Heights Historic District. The beautiful Spanish Colonial Revival architecture is a throwback to old Los Angeles with a touch of Andalusia. Each casita features vaulted barrel ceilings, hardwood flooring, and patios that open into a shared courtyard. The majority of the units have been extensively renovated to include new windows, chef's kitchens with stainless steel appliances, washer/dryer hook-ups, and private yards. The property's diverse unit mix consists of seven 2+1's and four 1+1's. The property consistently generates above market rents while still maintaining opportunity for growth. In addition, there is ample tenant parking, owned communal laundry machines for extra income, and the property is positioned on a massive 21,750 square foot double lot. Superbly located, 1533 6th Avenue provides residents with many of the great things LA has to offer right outside their front door. The property features a stellar 85 walk score and is central to major employment, freeways, and points of interest alike. Tenants with children have numerous nearby parks and schools to choose from, including Queen Anne Park, Arlington Heights Elementary, and Johnnie Cochran Middle School. Public transit is easily accessible at the corner bus stop where the line 33 Metro takes riders to Santa Monica, Downtown, and everywhere in-between. 1533 6th Avenue offers investors the opportunity to cash flow, hedge against inflation, leverage tax advantages, and add more value.
-
2019-01-16soldstatus $2,247,500
-
2019-01-15soldstatus $2,247,500 Closed Sale
-
2019-01-15soldstatus $2,247,500
-
2018-12-29status Pending Sale
-
2018-11-28status Active
-
2018-10-19status Pending Sale
-
2018-08-08price $2,520,000
-
2018-03-22$2,590,000 Active
-
2018-03-22$2,520,000
-
2005-10-31historical
-
2005-05-16
-
2005-05-06soldstatus $1,100,000
-
2004-09-17historical
-
2004-07-19historical
-
2004-07-17
-
2004-05-25
-
2003-04-04soldstatus $650,000
ⓘ Source: listings_history table (triggers on properties + properties_extension) + one-shot
backfill from property_details.listing_events for pre-trigger history.
Tax reassessment forecast CA · Resets to sale price
- Current annual tax
- $31,760 · $2,647/mo
- Projected year-2 tax
- $31,760 · $2,647/mo
- Expected delta
- $0/yr ($0/mo · 0.0%)
ⓘ Screening estimate from a state-policy table — verify with the county assessor before closing.
Climate risk First Street
- Flood 1/10 Low FEMA zone X (unshaded) · 0% chance over 30 yrs
- Wildfire 1/10 Low
- Heat 6/10 Major 7 d/yr ≥89°F today · 21 d/yr by 30 yrs out
- Wind 1/10 Low
- Air quality 5/10 Major 7 unhealthy d/yr today · 7 by 30 yrs out
Nearby sold comps map
Loading sold comps map…
Walkable amenities ~0.75 mi
Loading nearby amenities…
Taxation est. · year 1
- Rental income
- $341,028
- − Mortgage interest
- −$182,051
- − Property taxes
- −$31,760
- − Insurance
- −$16,250
- − Repairs & maintenance
- −$27,282
- − Management
- −$27,282
- − Depreciation
- −$94,545
- Taxable loss
- −$38,142
- Est. tax savings @ 24.0%
- +$9,154
- After-tax cash flow
- $26,036/yr
For passive investors: Depreciation is non-cash, so a rental often shows a tax loss while cash-flowing — sheltering income. Rental losses are passive: they offset passive income freely, and up to $25,000/yr can offset ordinary (W-2) income if you actively participate and your MAGI is under $100k (phasing out to $0 by $150k); unused losses carry forward. On sale, claimed depreciation is recaptured at up to 25%, and gains may owe capital-gains tax (a 1031 exchange can defer both). Figures are a year-1 estimate at your 24.0% rate — not tax advice; consult a CPA.
Schools (NCES district)
- District
- Los Angeles Unified
- NCES district ID
- 0622710
- Math proficiency
- 29% ▼ -4.00%
- Reading proficiency
- 54% ▲ 10.00%
- Median HH income
- $50,403
- Composite
- 35.67/100
- National rank
- #4875
- State rank
- #223 of 517 in CA
Livability — Los Angeles
- Score
- 68/100
- State rank
- #273
- US rank
- #9237
Category grades
Schools grade is shown separately in the Schools card above.
Census & demographics
- Census place
- Los Angeles, CA
- County
- Los Angeles County · 9,444,647 people
- City population
- 3,838,149
- Metro
- Los Angeles-Long Beach-Anaheim, CA
- Population (ZIP)
- 59,548
- Household income
- $73,934
- Rent vs Own
- Severe rent burden
- 5272.0
Population outlook (Los Angeles County) Hauer SSP2
- Today (2025)
- 10,940,515 people
- By 2030
- 11,256,481 · +2.9%
- By 2040
- 11,729,929 · +7.2%
- By 2050
- 11,948,407 · +9.2%
- By 2075
- 11,818,114 · +8.0%
- By 2100
- 10,842,928 · -0.9%
Race, ethnicity, and origin ACS 2023
- Neighborhood character
- Highly diverse neighborhood (Simpson 0.73)
- Race & ethnicity
- Hispanic / Latino 43% White 18% Black 17% Asian 17% Two or more races 13%
- Hispanic origin (detail)
- Mexican 26%
- Common ancestry
- Lithuanian 1% Romanian 1% Italian 1%
- Foreign-born
- 37% · Canada, South Korea, China
- Languages at home
- 45% English-only · Spanish 38% Korean 10% Tagalog/Filipino 1%
Political lean MEDSL · Los Angeles
- 2024 margin
- Solid D (+32.9) · D 64.8% · R 31.9% · Other 3.3%
- 2008→2024 swing
- -7.4pp toward R · 2008: 40.4pp · 2024: 32.9pp
- All cycles
- 2024: D+32.9 2020: D+44.2 2016: D+48.0 2012: D+40.0 2008: D+40.4
Not yet ingested
- Civics
- —
Market trends
- HPI YoY
- ▼ -1477.82%
- Current HPI
- 425.5427
- Rent YoY
- ▼ -0.50%
- Metro
- Los Angeles-Long Beach-Anaheim, CA
- State GDP YoY
- ▲ 3.21%
- F500 in state
- 116
Industry mix (Fortune 500 HQ in CA)
| Industry | F500 HQs | Revenue |
|---|---|---|
| Technology | 27 | $1,492B |
|
||
| Financial Services | 3 | $174B |
|
||
| Retail | 3 | $44B |
|
||
| Insurance | 3 | $26B |
|
||
| Media / Entertainment | 2 | $115B |
|
||
| Pharmaceuticals / Biotech | 2 | $62B |
|
||
Price history
+400.0% since first listed19 events — show timeline
- 2026-05-14 Price Changed $3,250,000 TheMLS
- 2026-03-26 Listed $3,350,000 TheMLS
- 2019-01-16 Sold (Public Records) $2,247,500 Public Records
- 2019-01-15 Sold (MLS) $2,247,500 SDMLS
- 2019-01-15 Sold (MLS) $2,247,500 CRMLS
- 2018-12-29 Pending — CRMLS
- 2018-11-28 Relisted — CRMLS
- 2018-10-19 Pending — CRMLS
- 2018-08-08 Price Changed $2,520,000 CRMLS
- 2018-03-22 Listed $2,520,000 SDMLS
- 2018-03-22 Listed $2,590,000 CRMLS
- 2005-10-31 Delisted — TheMLS
- 2005-05-16 Listed — TheMLS
- 2005-05-06 Sold (Public Records) $1,100,000 Public Records
- 2004-09-17 Delisted — TheMLS
- 2004-07-19 Delisted — TheMLS
- 2004-07-17 Listed — TheMLS
- 2004-05-25 Listed — TheMLS
- 2003-04-04 Sold (Public Records) $650,000 Public Records
Property tax history
+3.3%/yrLatest (2025): $31,760 · +0.9% YoY. Source: county tax records.
Cash-flow waterfall
monthlySold comps — $/sqft
last 12 mo · ≤1 miLoading sold comps…