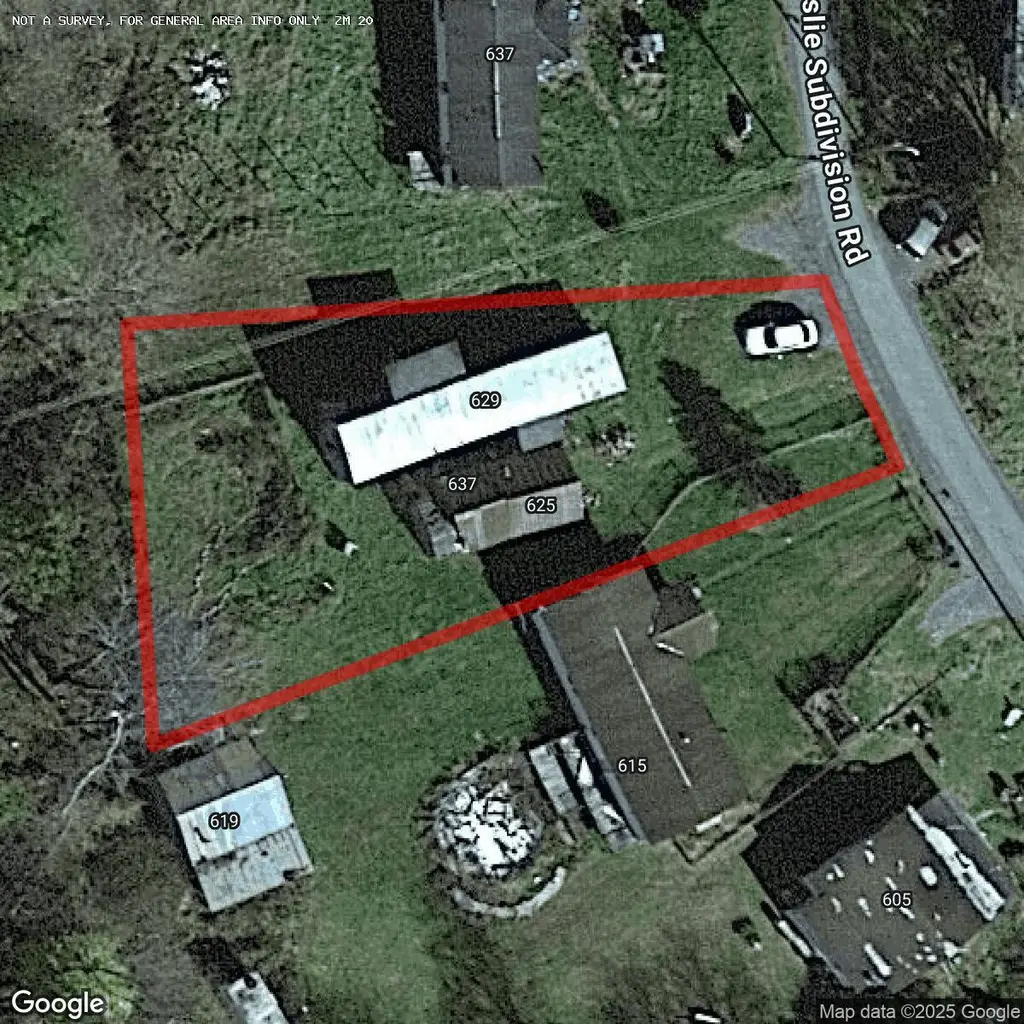
629 Leslie Subdivision Rd · Quinwood, WV
Flood risk 1/10 · Minimal
- FEMA flood zone
- X (unshaded)
- Chance of flooding over 30 yrs
- 0.0%
- Est. flood insurance / yr
- $507 – $1,088
Fire risk 3/10 · Minor
- Est. fire insurance / yr
- $787 – $1,461
Heat risk 1/10 · Minimal
- Hot days now (above 86°F)
- 7 days/yr
- Hot days in 30 yrs
- 20 days/yr
Wind risk 2/10 · Minimal
- Chance of severe wind over 30 yrs
- —
Air-quality risk 1/10 · Minimal
- Unhealthy air days now
- 0 days/yr
- Unhealthy air days in 30 yrs
- 0 days/yr
Risk factors via First Street. Map © Google.
Why this score? — see what drove the D+ grade
The composite is a weighted blend of 9 inputs, each scored 0–100. Each bar is that input's sub-score; the figure is the points it added to the 100-point composite (weight × sub-score).
- Cash flow +15.0/30.0
- ARV discount +7.5/15.0
- 1% rule +5.0/10.0
- DSCR +5.0/10.0
- Appreciation +5.0/10.0
- Rent growth +2.5/5.0
- Schools +2.5/10.0
- Condition / age +2.5/5.0
- Livability +2.0/5.0
$6,500
🖨 Deal sheet 📄 Offer letter ✓ Due diligence
Listing remarks
LESLIE, WV Greenbrier County, WV lot with mobile home
Key facts
- Built 1980
- Listed 368 days
Property features AI
Exterior
- Home design: Residential property
- Construction: Aluminum siding; Pillar/post/pier foundation; Built with tar/gravel roof
- Exterior features: Tar/gravel roof
Interior
- Flooring: Carpet
- Bathrooms: 1 full bathroom
- Heating & cooling: No heating; No cooling
- Interior features: Carpet flooring; 4 total rooms
Neighborhood map
What this means for you Summary
Snapshot
- This is a 2-bed/1.0-bath single-family listed at $6k.
Deal economics
- At list price, monthly cash flow is $620 ($7k/yr) — positive.
- The deal already cash-flows at list — no discount required.
- Meets the 1% rule at list price ($842 rent vs $6k).
- Recommended offer: $6k (12.0% below list) — sets the bar for market timing.
Location & tenants
- Location reads 40/100 on livability (#379 in WV) — a working-class tenant base; expect higher turnover. Strengths: cost of living A+, crime A; Watch: schools F, amenities F, commute F.
- Greenbrier County Schools (town): math 24% / reading 37% proficiency, ranked #31 of 55 in WV (top 56%) — families likely to look elsewhere, expect single-tenant / working-renter base with shorter leases.
- Market conditions: 1 active listings in the ZIP; 74 units permitted in Greenbrier County in 2024 (0 in 5+ unit buildings).
Forward outlook
- In year one you build about $240 of equity ($45 loan paydown + $195 appreciation (3.0% local appreciation)).
- Greenbrier County population projected to shrink 7% by 2050 — rents likely to lag national; underwrite the cash flow, not the appreciation.
- At projected returns (3.0% appreciation + 3.0% rent growth), your $2k cash investment doubles in ~1 year — after that, you're playing with house money.
Negotiation context
- It's been on market 369 days — a 12% lower offer ($6k) is reasonable based on typical stale-listing flexibility.
Questions for the listing agent
- It's been on market 369 days. Have you received any prior offers? Is the seller open to a 12% concession, seller financing, or rate buy-down credit?
- Why hasn't it sold? Are there any deal-killer items the seller is aware of (foundation, flood, title, zoning, code violations)?
- Is there a deadline driving the sale (1031 exchange, divorce, estate, relocation)? That informs how much negotiation room exists.
- Schools are F-rated, which usually means shorter tenancies and higher turnover. Who's the typical renter profile here, and what's been the actual vacancy rate?
- The area grade is low — what's the realistic commute time and amenity access for the typical tenant pool here? Any planned neighborhood developments (good or bad) we should know about?
- What's the average days-on-market for RENTAL listings here right now (not sales)? A rising rental-DOM trend means longer vacancies and softer asking-rent achievability than the comps imply.
- What's the recent tenant-quality profile in this submarket — average credit score on applications, eviction rate, late-payment / NSF rate, and stable-employment percentage? A property-management company in the area should have these aggregated.
- How much new for-sale + rental construction is in the pipeline within 1–3 miles? Heavy new supply typically softens prices + rents 12–24 months out; constrained supply supports both.
Investment metrics
- 1% rule
- 12.95% ✓
- Cap rate
- 120.73%
- Cash-on-cash
- 408.70%
- DSCR
- 19.18
- GRM
- 0.6
CMA / ARV
No comps found within radius.
Projected returns pro-forma
3.0% appreciation · 3.0% rent growth · sell at horizon
- IRR
- —
- Equity multiple
- 23.13×
- Total profit
- $40,275
- Equity at exit
- $2,923
- IRR
- —
- Equity multiple
- 49.39×
- Total profit
- $88,065
- Equity at exit
- $4,504
Cash invested: $1,820 (down + closing). Projections, not guarantees.
Landlord ↔ Tenant lean methodology
- Overall (STATE)
- 83 Strongly Landlord-Friendly
- State West Virginia
- 83 Strongly Landlord-Friendly · R+22
- County
- — inherits STATE
- City
- — inherits STATE
ZIP-level market 25972
- Active inventory
- 1
- Price-to-rent
- 0.6×
Monthly cashflow live
- Estimated rent
- $842 medium interval (Pro) →
- Mortgage (P&I)
- −$34
- Tax est. 1.5%
- −$8 /mo · $98/yr
- Insurance
- −$3
- HOA
- −$0
- Vacancy / Maint / Mgmt
- −$177
- Net cashflow
- $620
Break-even live
UW: 25.0% down · 7.5% · 30yr · 1.5% tax · 5.0% vac · 8.0% maint · 8.0% mgmt
Financing live
Cash to close
- Down payment
- $1,625
- Closing costs
- $195
- Reserves months
- —
- Total cash needed
- —
Loan-product check · same deal, 3 products live
Conventional
25% down · 7.5% · 30yr
- Down + closing
- —
- Monthly P&I
- —
- Monthly cashflow
- —
- DSCR
- —
- Eligible?
- —
Personal DTI + credit; lowest rate.
DSCR
20% down · 8.5% · 30yr
- Down + closing
- —
- Monthly P&I
- —
- Monthly cashflow
- —
- DSCR
- —
- Eligible?
- —
No personal income docs; deal must DSCR.
Hard money
10% down · 12.0% · 12mo
- Down + closing
- —
- Monthly P&I
- —
- Monthly cashflow
- —
- DSCR
- —
- Eligible?
- —
Short-term bridge; refi at stabilization.
Listing history 25 events
-
2026-06-18days on market $6,500 Active 369 DOM
-
2026-06-17days on market $6,500 Active 368 DOM
-
2026-06-16days on market $6,500 Active 367 DOM
-
2026-06-15days on market $6,500 Active 366 DOM
-
2026-06-15days on market $6,500 Active 365 DOM
-
2026-06-13days on market $6,500 Active 364 DOM
-
2026-06-12days on market $6,500 Active 363 DOM
-
2026-06-09days on market $6,500 Active 360 DOM
-
2026-06-08days on market $6,500 Active 359 DOM
-
2026-06-08days on market $6,500 Active 358 DOM
-
2026-06-07days on market $6,500 Active 357 DOM
-
2026-06-04days on market $6,500 Active 355 DOM
-
2026-06-03days on market $6,500 Active 354 DOM
-
2026-06-02days on market $6,500 Active 353 DOM
-
2026-06-01days on market $6,500 Active 352 DOM
-
2026-05-31days on market $6,500 Active 351 DOM
-
2026-04-30price $6,500
-
2026-03-21price $6,900
-
2026-02-13price $7,000
-
2026-01-01price $7,500
-
2025-12-09price $7,900
-
2025-11-09price $8,900
-
2025-09-25price $9,900
-
2025-08-26price $11,500
-
2025-06-14$12,500 Active
ⓘ Source: listings_history table (triggers on properties + properties_extension) + one-shot
backfill from property_details.listing_events for pre-trigger history.
Climate risk First Street
- Flood 1/10 Low FEMA zone X (unshaded) · 0% chance over 30 yrs
- Wildfire 3/10 Moderate
- Heat 1/10 Low 7 d/yr ≥86°F today · 20 d/yr by 30 yrs out
- Wind 2/10 Low
- Air quality 1/10 Low 0 unhealthy d/yr today · 0 by 30 yrs out
Nearby sold comps map
Loading sold comps map…
Walkable amenities ~0.75 mi
Loading nearby amenities…
Taxation est. · year 1
- Rental income
- $10,098
- − Mortgage interest
- −$364
- − Property taxes
- −$98
- − Insurance
- −$32
- − Repairs & maintenance
- −$808
- − Management
- −$808
- − Depreciation
- −$189
- Taxable income
- $7,799
- Est. tax owed @ 24.0%
- −$1,872
- After-tax cash flow
- $5,567/yr
For passive investors: Depreciation is non-cash, so a rental often shows a tax loss while cash-flowing — sheltering income. Rental losses are passive: they offset passive income freely, and up to $25,000/yr can offset ordinary (W-2) income if you actively participate and your MAGI is under $100k (phasing out to $0 by $150k); unused losses carry forward. On sale, claimed depreciation is recaptured at up to 25%, and gains may owe capital-gains tax (a 1031 exchange can defer both). Figures are a year-1 estimate at your 24.0% rate — not tax advice; consult a CPA.
Schools (NCES district)
- District
- Greenbrier County Schools
- NCES district ID
- 5400390
- Math proficiency
- 24% ▼ -14.00%
- Reading proficiency
- 37% ▼ -10.00%
- Median HH income
- $37,088
- Composite
- 25.34/100
- National rank
- #7477
- State rank
- #31 of 55 in WV
Livability — Quinwood
- Score
- 40/100
- State rank
- #379
- US rank
- #27296
Category grades
Schools grade is shown separately in the Schools card above.
Census & demographics
- Population (ZIP)
- 208
Population outlook (Greenbrier County) Hauer SSP2
- Today (2025)
- 35,394 people
- By 2030
- 35,182 · -0.6%
- By 2040
- 34,241 · -3.3%
- By 2050
- 32,882 · -7.1%
- By 2075
- 29,435 · -16.8%
- By 2100
- 24,473 · -30.9%
Race, ethnicity, and origin ACS 2023
- Neighborhood character
- Predominantly White (67%)
- Race & ethnicity
- White 67% Black 33%
- Common ancestry
- Serbian 6%
Political lean MEDSL · Greenbrier
- 2024 margin
- Solid R (+42.1) · D 28.0% · R 70.1% · Other 1.9%
- 2008→2024 swing
- -29.9pp toward R · 2008: -12.3pp · 2024: -42.1pp
- All cycles
- 2024: R+42.1 2020: R+39.6 2016: R+41.2 2012: R+24.8 2008: R+12.3
Not yet ingested
- Civics
- —
Market trends
- HPI YoY
- —
- Current HPI
- —
- Rent YoY
- —
- Metro
- —
- State GDP YoY
- —
- F500 in state
- 0
Price history
-48.0% since first listed9 events — show timeline
- 2026-04-30 Price Changed $6,500 GVBOR
- 2026-03-21 Price Changed $6,900 GVBOR
- 2026-02-13 Price Changed $7,000 GVBOR
- 2026-01-01 Price Changed $7,500 GVBOR
- 2025-12-09 Price Changed $7,900 GVBOR
- 2025-11-09 Price Changed $8,900 GVBOR
- 2025-09-25 Price Changed $9,900 GVBOR
- 2025-08-26 Price Changed $11,500 GVBOR
- 2025-06-14 Listed $12,500 GVBOR
Cash-flow waterfall
monthlySold comps — $/sqft
last 12 mo · ≤1 miLoading sold comps…