 8-Plex
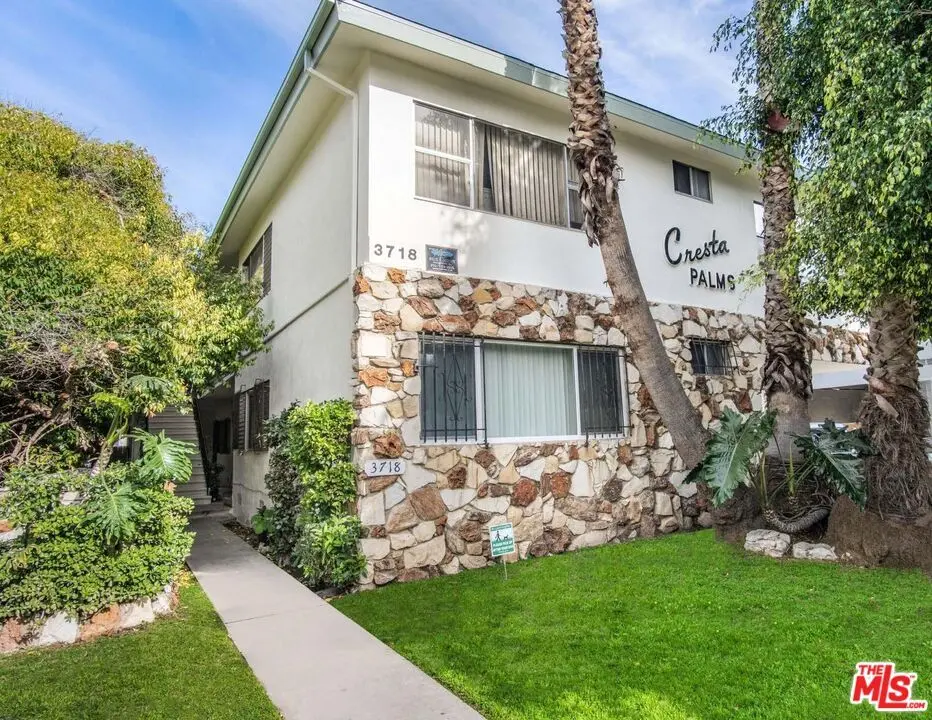
3718 Vinton Ave · Los Angeles, CA
Flood risk 1/10 · Minimal
- FEMA flood zone
- X (unshaded)
- Chance of flooding over 30 yrs
- 0.0%
- Est. flood insurance / yr
- $507 – $1,088
Fire risk 1/10 · Minimal
- Est. fire insurance / yr
- $659 – $1,223
Heat risk 6/10 · Moderate
- Hot days now (above 85°F)
- 7 days/yr
- Hot days in 30 yrs
- 21 days/yr
Wind risk 1/10 · Minimal
- Chance of severe wind over 30 yrs
- —
Air-quality risk 4/10 · Minor
- Unhealthy air days now
- 6 days/yr
- Unhealthy air days in 30 yrs
- 7 days/yr
Risk factors via First Street. Map © Google.
Why this score? — see what drove the B- grade
The composite is a weighted blend of 9 inputs, each scored 0–100. Each bar is that input's sub-score; the figure is the points it added to the 100-point composite (weight × sub-score).
- Cash flow +27.4/30.0
- ARV discount +10.5/15.0
- DSCR +9.6/10.0
- 1% rule +7.4/10.0
- Schools +3.6/10.0
- Livability +3.4/5.0
- Rent growth +2.6/5.0
- Condition / age +2.5/5.0
- Appreciation +0.0/10.0
$2,400,000
🖨 Deal sheet (PDF) 📄 Offer letter ✓ Due diligence
Multi-family units
County records classify this as Multi-Family (5+ Unit). Listing-text estimate: 8 units. confirmed
5+ unit building — per-unit beds/baths from public records are typically unavailable; the breakdown below (if shown) is an estimate from the listing text.
Listing remarks MLS
We are pleased to present 3718 Vinton Ave, Los Angeles, CA 90034, an exceptional 8-unit multifamily investment opportunity in the highly desirablePalms neighborhood on the Westside of Los Angeles. Situated in a vibrant, dense urban area known for its walkability, proximity to trendy Culver City, Sony Studios (now part of the thriving creative and tech ecosystem), coffee shops, restaurants, parks, and major employment hubs, this location benefits from strong rental demand driven by young professionals, families, and proximity to attractions like the Culver City Promenade. Palms offers a mix of apartment buildings and commercial ribbons, with excellent access to freeways, public transit, and nearby institutions such as West LosAngeles College. The broader Westside multifamily market continues to show resilience, with positive appreciation forecasts for 2026 in areas likePalms and adjacent Culver City, supported by limited inventory and ongoing buyer interest in value-add assets. Built in 1958, this 2-story building (approximately 6,500+ sq ft on a ~7,500 sq ft lot) has been owned by the same family for over 40 years and is now onthe market for the first time in decades, presenting a rare chance to acquire a stabilized asset with tremendous upside potential. The unit mix includes one spacious 3 bed/2 bath, two 2 bed/1 bath, and five 1 bed/1 bath units, offering diversified rental appeal in a market where larger units command premium rents near employment centers. With several units below current market rates given the long-term ownership, this property represents an incredible value-add opportunity through turnover and cosmetic upgrades to capture higher market rents in this strong Westside submarket.
Key facts
- 7,501 sq ft lot
- 5 parking spots
- Built 1958
Neighborhood map
What this means for you Summary
Snapshot
- This is a 8 × 12-bed/8.0-bath units multifamily listed at $2.40M.
Deal economics
- At list price, monthly cash flow is $7k ($84k/yr) — positive. Per door: $877/mo.
- The deal already cash-flows at list — no discount required.
- Meets the 1% rule at list price ($30k rent vs $2.40M).
- Recommended offer: $2.26M (6.0% below list) — sets the bar for market timing.
- Cap rate 9.8% vs local median 2.1% in Los Angeles — top-decile yield for the area; either an underpriced asset or a hidden risk that comps aren't pricing in. Stress-test before assuming the spread holds.
Location & tenants
- Location reads 68/100 on livability (#273 in CA) — a middle-class / working-renter tenant base. Strengths: amenities A+, commute A+, employment B; Watch: health & safety C-, schools D+, crime F.
- Los Angeles Unified (urban): math 29% / reading 54% proficiency, ranked #223 of 517 in CA (top 43%) — families likely to look elsewhere, expect single-tenant / working-renter base with shorter leases; 67% free/reduced lunch — lower-income household profile, screen leases tightly.
- Market conditions: Rents flat; 121 active listings in the ZIP; solid renter incomes; 19,697 units permitted in Los Angeles County in 2024 (9,426 in 5+ unit buildings).
- At $29,879/mo this rent would consume 339% of the median local household income ($106k/yr) (locally 4507% of renters already pay >50% of income on rent) — very limited rent-growth headroom before tenants either downsize or default.
Forward outlook
- Local home prices are declining (-3.0%/yr); year-one equity from $17k of loan paydown is wiped out by about $72k of value loss. Plan a longer hold.
- Los Angeles County population projected at +9% by 2050 — modest demand growth; plan on rents tracking national, not racing it.
Negotiation context
- It's been on market 65 days — a 6% lower offer ($2.26M) is reasonable based on typical stale-listing flexibility.
- 3 sale attempts since 3y ago with the ask held roughly flat each time — persistent listings suggest the price (not the market) is what's stuck; bring a comps-based counter.
Risks & watch-outs
- Watch-outs: built in 1958 — expect roof / HVAC / electrical / plumbing capex.
- Climate carrying-cost: extreme-heat days projected 7→21/yr by 2055 (HVAC capex compounding) — expect insurance premiums to compound above CPI over the hold.
Questions for the listing agent
- It's been on market 65 days. Have you received any prior offers? Is the seller open to a 6% concession, seller financing, or rate buy-down credit?
- Can we see the unit-by-unit rent roll, current vacancy, and any below-market leases? What's the average tenancy length?
- What capital expenditures (roof, boiler, parking lot, exteriors) have been made in the last 5 years, and what's planned in the next 2?
- Built in 1958 — when were the roof, HVAC, electrical panel, plumbing, and water heater last replaced?
- Why hasn't it sold? Are there any deal-killer items the seller is aware of (foundation, flood, title, zoning, code violations)?
- Is there a deadline driving the sale (1031 exchange, divorce, estate, relocation)? That informs how much negotiation room exists.
- Schools are D-rated, which usually means shorter tenancies and higher turnover. Who's the typical renter profile here, and what's been the actual vacancy rate?
- Crime grade is F in this area — have there been break-ins, vandalism, or insurance claims at this property in the last 3 years? What carrier currently insures it and at what premium?
- What's the average days-on-market for RENTAL listings here right now (not sales)? A rising rental-DOM trend means longer vacancies and softer asking-rent achievability than the comps imply.
- What's the recent tenant-quality profile in this submarket — average credit score on applications, eviction rate, late-payment / NSF rate, and stable-employment percentage? A property-management company in the area should have these aggregated.
- How much new apartment / multifamily construction is in the pipeline within 1–3 miles? Heavy new supply (>2% of stock underway) typically softens rents 12–24 months out; light construction supports rent growth.
Investment metrics
- 1% rule
- 1.24% ✓
- Cap rate
- 9.80%
- Cash-on-cash
- 12.53%
- DSCR
- 1.56
- GRM
- 6.7
CMA / ARV
- ARV (median comp)
- $2,568,529
- List price
- $2,400,000
- Delta
- -6.56%
- Verdict
- FAIR
- Comps
- 20 within 1.0 mi
Show comp detail 4 sales within ~0.75 mi
| Address | Dist | Beds/Ba | Sqft | Sold | Price | $/sf | Match |
|---|---|---|---|---|---|---|---|
| 3754 Vinton Ave | 0.07mi | 12/9.0 | 6,570 (+1%) | 22mo | $2,250,000 | $342 | 73 |
| 3729 Delmas Ter | 0.31mi | 13/9.0 (+1) | 6,930 (+6%) | 23mo | $3,585,000 | $517 | 47 |
| 3720 Midvale Ave | 0.55mi | 13/9.0 (+1) | 7,229 (+11%) | 8mo | $2,700,000 | $373 | 40 |
| 4100 Le Bourget Ave | 0.54mi | 11/11.0 (-1) | 5,840 (-10%) | 8mo | $1,620,000 | $277 | 34 |
Match score weights: distance 35% · size 25% · config 20% · recency 20%. Top-matched comps best support the ARV.
Projected returns pro-forma
-3.0% appreciation · 0.3% rent growth · sell at horizon
- IRR
- -0.8%
- Equity multiple
- 0.97×
- Total profit
- $-20,478
- Equity at exit
- $357,848
- IRR
- 5.8%
- Equity multiple
- 1.38×
- Total profit
- $252,329
- Equity at exit
- $207,508
Cash invested: $672,000 (down + closing). Projections, not guarantees.
Landlord ↔ Tenant lean methodology
- Overall (CITY)
- 0 Strongly Tenant-Friendly
- State California
- 18 Strongly Tenant-Friendly · D+13
- County
- — inherits STATE
- City Los Angeles
- 0 Strongly Tenant-Friendly · D+22
ZIP-level market 90034
- Rents YoY
- 0.3%
- Active inventory
- 121
- Price-to-rent
- 53.5×
Monthly cashflow live
- Estimated rent
- $29,879 medium interval (Pro) →
- Mortgage (P&I)
- −$12,586
- Tax est. 1.5%
- −$3,000 /mo · $36,000/yr
- Insurance
- −$1,000
- HOA
- −$0
- Vacancy / Maint / Mgmt
- −$6,275
- Net cashflow
- $7,019
Break-even live
Sensitivity live
| Price | -10% $8,677 | -5% $7,848 | +0% $7,019 | +5% $6,189 | +10% $5,360 |
|---|---|---|---|---|---|
| Rent | -10% $4,658 | -5% $5,838 | +0% $7,019 | +5% $8,199 | +10% $9,379 |
| Rate | -1.0pp $8,227 | -0.5pp $7,629 | base $7,019 | +0.5pp $6,397 | +1.0pp $5,764 |
8-unit breakdown (identical units grouped — click to expand)
| Units | Beds | Baths | Est. rent |
|---|---|---|---|
| 8× units | 12 | 8 | $29,880 |
| #1 | 12 | 8 | $3,735 |
| #2 | 12 | 8 | $3,735 |
| #3 | 12 | 8 | $3,735 |
| #4 | 12 | 8 | $3,735 |
| #5 | 12 | 8 | $3,735 |
| #6 | 12 | 8 | $3,735 |
| #7 | 12 | 8 | $3,735 |
| #8 | 12 | 8 | $3,735 |
| Total (8 units) | $29,879 | ||
UW: 25.0% down · 7.5% · 30yr · 1.5% tax · 5.0% vac · 8.0% maint · 8.0% mgmt
Financing live
Cash to close
- Down payment
- $600,000
- Closing costs
- $72,000
- Reserves months
- —
- Total cash needed
- —
Loan-product check · same deal, 3 products live
Conventional
25% down · 7.5% · 30yr
- Down + closing
- —
- Monthly P&I
- —
- Monthly cashflow
- —
- DSCR
- —
- Eligible?
- —
Personal DTI + credit; lowest rate.
DSCR
20% down · 8.5% · 30yr
- Down + closing
- —
- Monthly P&I
- —
- Monthly cashflow
- —
- DSCR
- —
- Eligible?
- —
No personal income docs; deal must DSCR.
Hard money
10% down · 12.0% · 12mo
- Down + closing
- —
- Monthly P&I
- —
- Monthly cashflow
- —
- DSCR
- —
- Eligible?
- —
Short-term bridge; refi at stabilization.
Listing history 20 events
-
2026-06-18days on market $2,400,000 Active 65 DOM
-
2026-06-17days on market $2,400,000 Active 64 DOM
-
2026-06-16days on market $2,400,000 Active 63 DOM
-
2026-06-15days on market $2,400,000 Active 62 DOM
-
2026-06-13days on market $2,400,000 Active 60 DOM
-
2026-06-09days on market $2,400,000 Active 56 DOM
-
2026-06-08days on market $2,400,000 Active 55 DOM
-
2026-06-07days on market $2,400,000 Active 54 DOM
-
2026-06-04days on market $2,400,000 Active 51 DOM
-
2026-06-03days on market $2,400,000 Active 50 DOM
-
2026-06-02days on market $2,400,000 Active 49 DOM
-
2026-06-01days on market $2,400,000 Active 48 DOM
-
2026-05-31days on market $2,400,000 Active 47 DOM
-
2026-04-13$2,400,000 Active 1727-char remark
Show marketing remark (1727 chars)
We are pleased to present 3718 Vinton Ave, Los Angeles, CA 90034, an exceptional 8-unit multifamily investment opportunity in the highly desirablePalms neighborhood on the Westside of Los Angeles. Situated in a vibrant, dense urban area known for its walkability, proximity to trendy Culver City, Sony Studios (now part of the thriving creative and tech ecosystem), coffee shops, restaurants, parks, and major employment hubs, this location benefits from strong rental demand driven by young professionals, families, and proximity to attractions like the Culver City Promenade. Palms offers a mix of apartment buildings and commercial ribbons, with excellent access to freeways, public transit, and nearby institutions such as West LosAngeles College. The broader Westside multifamily market continues to show resilience, with positive appreciation forecasts for 2026 in areas likePalms and adjacent Culver City, supported by limited inventory and ongoing buyer interest in value-add assets. Built in 1958, this 2-story building (approximately 6,500+ sq ft on a ~7,500 sq ft lot) has been owned by the same family for over 40 years and is now onthe market for the first time in decades, presenting a rare chance to acquire a stabilized asset with tremendous upside potential. The unit mix includes one spacious 3 bed/2 bath, two 2 bed/1 bath, and five 1 bed/1 bath units, offering diversified rental appeal in a market where larger units command premium rents near employment centers. With several units below current market rates given the long-term ownership, this property represents an incredible value-add opportunity through turnover and cosmetic upgrades to capture higher market rents in this strong Westside submarket.
-
2024-04-10historical $3,095
-
2023-11-10$3,095
-
2023-11-04historical $3,225
-
2023-10-15price $3,225
-
2023-09-27price $3,295
-
2023-07-31$3,345
ⓘ Source: listings_history table (triggers on properties + properties_extension) + one-shot
backfill from property_details.listing_events for pre-trigger history.
Climate risk First Street
- Flood 1/10 Low FEMA zone X (unshaded) · 0% chance over 30 yrs
- Wildfire 1/10 Low
- Heat 6/10 Major 7 d/yr ≥85°F today · 21 d/yr by 30 yrs out
- Wind 1/10 Low
- Air quality 4/10 Moderate 6 unhealthy d/yr today · 7 by 30 yrs out
Nearby sold comps map
Loading sold comps map…
Walkable amenities ~0.75 mi
Loading nearby amenities…
Taxation est. · year 1
- Rental income
- $358,548
- − Mortgage interest
- −$134,437
- − Property taxes
- −$36,000
- − Insurance
- −$12,000
- − Repairs & maintenance
- −$28,684
- − Management
- −$28,684
- − Depreciation
- −$69,818
- Taxable income
- $48,925
- Est. tax owed @ 24.0%
- −$11,742
- After-tax cash flow
- $72,481/yr
For passive investors: Depreciation is non-cash, so a rental often shows a tax loss while cash-flowing — sheltering income. Rental losses are passive: they offset passive income freely, and up to $25,000/yr can offset ordinary (W-2) income if you actively participate and your MAGI is under $100k (phasing out to $0 by $150k); unused losses carry forward. On sale, claimed depreciation is recaptured at up to 25%, and gains may owe capital-gains tax (a 1031 exchange can defer both). Figures are a year-1 estimate at your 24.0% rate — not tax advice; consult a CPA.
Schools (NCES district)
- District
- Los Angeles Unified
- NCES district ID
- 0622710
- Math proficiency
- 29% ▼ -4.00%
- Reading proficiency
- 54% ▲ 10.00%
- Median HH income
- $50,403
- Composite
- 35.67/100
- National rank
- #4875
- State rank
- #223 of 517 in CA
Livability — Los Angeles
- Score
- 68/100
- State rank
- #273
- US rank
- #9237
Category grades
Schools grade is shown separately in the Schools card above.
Census & demographics
- Census place
- Los Angeles, CA
- County
- Los Angeles County · 9,444,647 people
- City population
- 3,838,149
- Metro
- Los Angeles-Long Beach-Anaheim, CA
- Population (ZIP)
- 57,075
- Household income
- $105,701
- Rent vs Own
- Severe rent burden
- 4507.0
Population outlook (Los Angeles County) Hauer SSP2
- Today (2025)
- 10,940,515 people
- By 2030
- 11,256,481 · +2.9%
- By 2040
- 11,729,929 · +7.2%
- By 2050
- 11,948,407 · +9.2%
- By 2075
- 11,818,114 · +8.0%
- By 2100
- 10,842,928 · -0.9%
Race, ethnicity, and origin ACS 2023
- Neighborhood character
- Highly diverse neighborhood (Simpson 0.73)
- Race & ethnicity
- White 41% Hispanic / Latino 26% Asian 18% Two or more races 13% Black 9%
- Hispanic origin (detail)
- Mexican 16%
- Common ancestry
- Scotch-Irish 3% Romanian 3% Italian 2%
- Foreign-born
- 30% · Canada, China, South Korea
- Languages at home
- 58% English-only · Spanish 21% Other Indo-European 6% Chinese 4%
Political lean MEDSL · Los Angeles
- 2024 margin
- Solid D (+32.9) · D 64.8% · R 31.9% · Other 3.3%
- 2008→2024 swing
- -7.4pp toward R · 2008: 40.4pp · 2024: 32.9pp
- All cycles
- 2024: D+32.9 2020: D+44.2 2016: D+48.0 2012: D+40.0 2008: D+40.4
Not yet ingested
- Civics
- —
Market trends
- HPI YoY
- ▼ -1346.08%
- Current HPI
- 445.7709
- Rent YoY
- ▲ 0.30%
- Metro
- Los Angeles-Long Beach-Anaheim, CA
- State GDP YoY
- ▲ 3.21%
- F500 in state
- 116
Industry mix (Fortune 500 HQ in CA)
| Industry | F500 HQs | Revenue |
|---|---|---|
| Technology | 27 | $1,492B |
|
||
| Financial Services | 3 | $174B |
|
||
| Retail | 3 | $44B |
|
||
| Insurance | 3 | $26B |
|
||
| Media / Entertainment | 2 | $115B |
|
||
| Pharmaceuticals / Biotech | 2 | $62B |
|
||
Price history
+71648.9% since first listed7 events — show timeline
- 2026-04-13 Listed $2,400,000 TheMLS
- 2024-04-10 Rental Removed $3,095 APPFOLIO
- 2023-11-10 Listed for Rent $3,095 APPFOLIO
- 2023-11-04 Rental Removed $3,225 APPFOLIO
- 2023-10-15 Price Changed $3,225 APPFOLIO
- 2023-09-27 Price Changed $3,295 APPFOLIO
- 2023-07-31 Listed for Rent $3,345 APPFOLIO
Property tax history
+1.9%/yrLatest (2025): $4,228 · +2.9% YoY. Source: county tax records.
Cash-flow waterfall
monthlySold comps — $/sqft
last 12 mo · ≤1 miLoading sold comps…