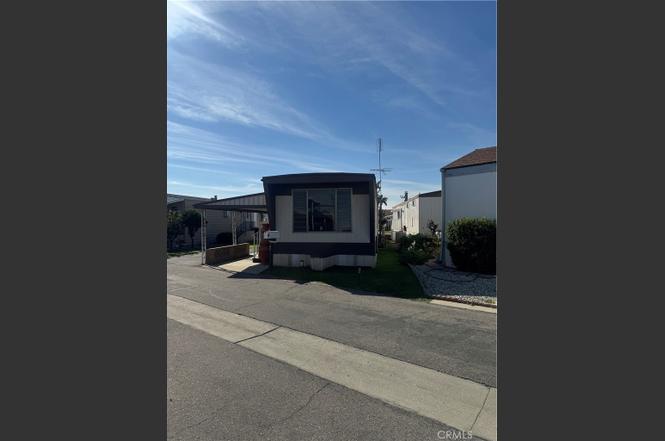
47 Fir Via · Anaheim, CA
Flood risk 1/10 · Minimal
- FEMA flood zone
- X (shaded)
- Chance of flooding over 30 yrs
- 0.0%
- Est. flood insurance / yr
- $507 – $1,088
Fire risk 1/10 · Minimal
- Est. fire insurance / yr
- $659 – $1,223
Heat risk 6/10 · Moderate
- Hot days now (above 93°F)
- 7 days/yr
- Hot days in 30 yrs
- 22 days/yr
Wind risk 1/10 · Minimal
- Chance of severe wind over 30 yrs
- —
Air-quality risk 5/10 · Moderate
- Unhealthy air days now
- 7 days/yr
- Unhealthy air days in 30 yrs
- 9 days/yr
Risk factors via First Street. Map © Google.
Why this score? — see what drove the B- grade
The composite is a weighted blend of 9 inputs, each scored 0–100. Each bar is that input's sub-score; the figure is the points it added to the 100-point composite (weight × sub-score).
- Cash flow +30.0/30.0
- 1% rule +10.0/10.0
- DSCR +10.0/10.0
- ARV discount +7.5/15.0
- Rent growth +3.8/5.0
- Livability +3.5/5.0
- Condition / age +2.5/5.0
- Schools +2.3/10.0
- Appreciation +0.0/10.0
$115,000
🖨 Deal sheet 📄 Offer letter ✓ Due diligence
Listing remarks MLS
New listing at Rancho La Paz Mobile home Park Fixer upper bring your tools and make it your own. Home to be sold as is with no repairs. Space rent monthly is $1797.00
Key facts
- Functional kitchen
- Fully remodeled
- Indoor laundry area
Tags
Property features AI
Finance
- Other: Manager approval required
- Financial info: Land lease applies (park-reported monthly land lease)
- HOA & community: Community amenities include pool and sauna; Park name: Rancho La Paz; Suburban community
Exterior
- Parking: Carport with one parking space
- Security: 24-hour security (also listed under interior features)
- Utilities: Natural gas connected; Electricity connected (standard electric); Water connected (district/public); Public sewer / sewer connected; Telephone available in street; Cable available
- Home design: Mobile home (Viking model) remains on site; Mobile dimensions approximately 52' x 12'; Fixer condition; One story
- Construction: Aluminum exterior construction; Shingle roof; Pier jacks foundation
- Exterior features: Awning; Aluminum skirt; Community pool; Patio (has patio); Shed on property; Block wall fencing
Interior
- Kitchen: Gas cooktop; Formica counters
- Bedrooms: All bedrooms on one level; Single-story entry (entry at level 1, side entrance)
- Flooring: Carpet
- Bathrooms: One full bathroom with shower-in-tub
- Heating & cooling: Central furnace (heating)
- Interior features: Sliding glass doors; Partial copper plumbing; Drapes/curtains; 24-hour security; Community spa
- Laundry & utility: No laundry hookups on site
Neighborhood map
What this means for you Summary
Snapshot
- This is a 2-bed/1.0-bath manufactured listed at $115k.
Deal economics
- At list price, monthly cash flow is $980 ($12k/yr) — positive.
- The deal already cash-flows at list — no discount required.
- Meets the 1% rule at list price ($2k rent vs $115k).
- Recommended offer: $101k (12.0% below list) — sets the bar for market timing.
- Cap rate 16.5% vs local median 2.2% in Anaheim — top-decile yield for the area; either an underpriced asset or a hidden risk that comps aren't pricing in. Stress-test before assuming the spread holds.
Location & tenants
- Location reads 70/100 on livability (#240 in CA) — a middle-class / working-renter tenant base. Strengths: amenities A+, commute A+, employment A+; Watch: health & safety C-, crime F, cost of living F.
- Anaheim Elementary (urban): math 25% / reading 25% proficiency, ranked #386 of 517 in CA (top 75%) — low school quality limits family demand, transient renter base, plan for 1-2y turnover; 73% free/reduced lunch — lower-income household profile, screen leases tightly.
- Market conditions: Rents rising fast (+5.1%/yr); 72 active listings in the ZIP; 40 comparable units currently listed for rent nearby; rentals leasing fast (median 1d on market — plan ~1-2 weeks tenant-placement turnaround); solid renter incomes; 6,974 units permitted in Orange County in 2024 (3,839 in 5+ unit buildings).
- This rent runs 32% of the median local income ($84k/yr) — at the standard rent-burdened threshold; future hikes will face affordability resistance.
Forward outlook
- Local home prices are declining (-3.0%/yr); year-one equity from $795 of loan paydown is wiped out by about $3k of value loss. Plan a longer hold.
- Orange County population projected at +14% by 2050 — modest demand growth; plan on rents tracking national, not racing it.
- At projected returns (-3.0% appreciation + 5.1% rent growth), your $32k cash investment doubles in ~4 years — after that, you're playing with house money.
Negotiation context
- It's been on market 147 days — a 12% lower offer ($101k) is reasonable based on typical stale-listing flexibility.
- 2 sale attempts since 2y ago; this cycle's ask has dropped $10k (8%) from the opening price — seller is motivated, your offer sets the floor, not the list.
- Current owner paid $25k; list at $115k implies a 360% gain — meaningful room to come down on a strong offer.
Risks & watch-outs
- Climate carrying-cost: extreme-heat days projected 7→22/yr by 2055 (HVAC capex compounding) — expect insurance premiums to compound above CPI over the hold.
Questions for the listing agent
- It's been on market 147 days. Have you received any prior offers? Is the seller open to a 12% concession, seller financing, or rate buy-down credit?
- Built in 1962 — when were the roof, HVAC, electrical panel, plumbing, and water heater last replaced?
- Why hasn't it sold? Are there any deal-killer items the seller is aware of (foundation, flood, title, zoning, code violations)?
- Is there a deadline driving the sale (1031 exchange, divorce, estate, relocation)? That informs how much negotiation room exists.
- Crime grade is F in this area — have there been break-ins, vandalism, or insurance claims at this property in the last 3 years? What carrier currently insures it and at what premium?
- What's the average days-on-market for RENTAL listings here right now (not sales)? A rising rental-DOM trend means longer vacancies and softer asking-rent achievability than the comps imply.
- What's the recent tenant-quality profile in this submarket — average credit score on applications, eviction rate, late-payment / NSF rate, and stable-employment percentage? A property-management company in the area should have these aggregated.
- How much new for-sale + rental construction is in the pipeline within 1–3 miles? Heavy new supply typically softens prices + rents 12–24 months out; constrained supply supports both.
Investment metrics
- 1% rule
- 1.95% ✓
- Cap rate
- 16.51%
- Cash-on-cash
- 36.50%
- DSCR
- 2.62
- GRM
- 4.3
CMA / ARV
No comps found within radius.
Projected returns pro-forma
-3.0% appreciation · 5.13% rent growth · sell at horizon
- IRR
- 34.7%
- Equity multiple
- 2.51×
- Total profit
- $48,699
- Equity at exit
- $17,147
- IRR
- 42.7%
- Equity multiple
- 5.47×
- Total profit
- $143,944
- Equity at exit
- $9,943
Cash invested: $32,200 (down + closing). Projections, not guarantees.
Landlord ↔ Tenant lean methodology
- Overall (STATE)
- 18 Strongly Tenant-Friendly
- State California
- 18 Strongly Tenant-Friendly · D+13
- County
- — inherits STATE
- City
- — inherits STATE
ZIP-level market 92801
- Rents YoY
- 5.1%
- Active inventory
- 72
- Price-to-rent
- 4.3×
Monthly cashflow live
- Estimated rent
- $2,246 high interval (Pro) →
- Mortgage (P&I)
- −$603
- Tax est. 1.5%
- −$144 /mo · $1,725/yr
- Insurance
- −$48
- HOA
- −$0
- Vacancy / Maint / Mgmt
- −$472
- Net cashflow
- $980
Break-even live
UW: 25.0% down · 7.5% · 30yr · 1.5% tax · 5.0% vac · 8.0% maint · 8.0% mgmt
Financing live
Cash to close
- Down payment
- $28,750
- Closing costs
- $3,450
- Reserves months
- —
- Total cash needed
- —
Loan-product check · same deal, 3 products live
Conventional
25% down · 7.5% · 30yr
- Down + closing
- —
- Monthly P&I
- —
- Monthly cashflow
- —
- DSCR
- —
- Eligible?
- —
Personal DTI + credit; lowest rate.
DSCR
20% down · 8.5% · 30yr
- Down + closing
- —
- Monthly P&I
- —
- Monthly cashflow
- —
- DSCR
- —
- Eligible?
- —
No personal income docs; deal must DSCR.
Hard money
10% down · 12.0% · 12mo
- Down + closing
- —
- Monthly P&I
- —
- Monthly cashflow
- —
- DSCR
- —
- Eligible?
- —
Short-term bridge; refi at stabilization.
Rent comps 40 comps
| Address | Beds | Baths | Sqft | Rent | $/sqft | DOM | Units | Dist |
|---|---|---|---|---|---|---|---|---|
| 146 S Princeton Ave Unit 5 Fullerton, CA | 1.0 | 1.0 | 700 | $1,795 | $2.56 | 21d | 1 | 0.38mi |
| 146 S Princeton Ave Unit 5 Fullerton, CA | 1.0 | 1.0 | 700 | $1,795 | $2.56 | 20d | 1 | 0.38mi |
| 146 S Princeton Ave Unit 5 Fullerton, CA | 1.0 | 1.0 | 700 | $1,795 | $2.56 | 12d | 1 | 0.38mi |
| 141 S Yale Ave Fullerton, CA | 1.0 | 1.0 | 700 | $1,922 | $2.75 | 15d | 3 | 0.40mi |
| 137 S Yale Ave #2 Fullerton, CA | 1.0 | 1.0 | 700 | $1,995 | $2.85 | 1d | 1 | 0.41mi |
| 137 S Yale Ave #7 Fullerton, CA | 1.0 | 1.0 | 700 | $1,850 | $2.64 | 1d | 1 | 0.42mi |
| 110 S Balcom Ave Fullerton, CA | 2.0 | 2.0 | 700 | $2,695 | $3.85 | 1d | 1 | 0.48mi |
| 251 Orangefair Ave Fullerton, CA | 2.0 | 1.0–2.0 | 966 | $3,916 | $4.05 | 1d | 27 | 0.64mi |
| 319 E Commonwealth Ave Fullerton, CA | 1.0 | 1.0 | 600 | $1,820 | $3.03 | 1d | 1 | 0.66mi |
| 229 E Commonwealth Ave Fullerton, CA | 3.0 | 1.0–3.0 | 1126 | $3,676 | $3.26 | 1d | 8 | 0.73mi |
| 1332 E Wilshire Ave Unit 1330-B Fullerton, CA | 1.0 | 1.0 | 650 | $1,995 | $3.07 | 12d | 1 | 0.80mi |
| 1332 E Wilshire Ave Fullerton, CA | 1.0 | 1.0 | 650 | $1,995 | $3.07 | 10d | 1 | 0.80mi |
| 140 W Hill Ave Fullerton, CA | 1.0 | 1.0 | 468 | $2,100 | $4.49 | 1d | 1 | 0.82mi |
| 140 W Hill Ave Unit 035 Fullerton, CA | 1.0 | 1.0 | 468 | $1,875 | $4.01 | 21d | 1 | 0.82mi |
| 1000 S Malden Ave Unit 10 Fullerton, CA | 1.0 | 1.0 | 550 | $1,800 | $3.27 | 1d | 1 | 0.83mi |
| 142 W Valencia Dr Apt A Fullerton, CA | 1.0 | 1.0 | 650 | $1,795 | $2.76 | 1d | 1 | 0.84mi |
| 130 E Chapman Ave Fullerton, CA | 1.0–2.0 | 1.0–2.0 | 910 | $2,644 | $2.91 | 1d | 4 | 0.94mi |
| 1326 E Romneya Dr Unit JADU Anaheim, CA | 1.0 | 1.0 | 450 | $1,700 | $3.78 | 1d | 1 | 1.00mi |
| 1480 S Highland Ave Fullerton, CA | 2.0 | 1.0–2.0 | 792 | $3,110 | $3.92 | 24d | 4 | 1.00mi |
| 1311 S Highland Ave Fullerton, CA | 1.0–2.0 | 1.0–2.0 | 826 | $2,050 | $2.48 | 1d | 1 | 1.02mi |
| 141 W Wilshire Ave Fullerton, CA | 1.0–2.0 | 1.0–2.5 | 910 | $3,187 | $3.50 | 1d | 6 | 1.04mi |
| 320 W Truslow Ave Unit D Fullerton, CA | 1.0 | 1.0 | 600 | $3,000 | $5.00 | 1d | 1 | 1.05mi |
| 1540 E Canfield Ln Anaheim, CA | 1.0 | 1.0 | 600 | $1,995 | $3.33 | 1d | 1 | 1.07mi |
| 400 N Acacia Ave Fullerton, CA | 1.0 | 1.0 | 675 | $2,172 | $3.22 | 1d | 2 | 1.09mi |
| 400 N Acacia Ave Fullerton, CA | 1.0 | 1.0 | 675 | $2,222 | $3.29 | 10d | 2 | 1.09mi |
| 1801 E Wilshire Ave Unit 1809-2 Fullerton, CA | 1.0 | 1.0 | 600 | $1,895 | $3.16 | 10d | 1 | 1.10mi |
| 206 W Whiting Ave Fullerton, CA | 1.0 | 1.0 | 700 | $2,395 | $3.42 | 1d | 1 | 1.11mi |
| 1501 S Highland Ave Unit 1401O Fullerton, CA | 1.0 | 1.0 | 550 | $2,130 | $3.87 | 1d | 1 | 1.11mi |
| 1501 S Highland Ave Unit 1421L Fullerton, CA | 1.0 | 1.0 | 550 | $2,160 | $3.93 | 24d | 1 | 1.11mi |
| 1501 S Highland Ave Unit 1351E Fullerton, CA | 1.0 | 1.0 | 550 | $2,225 | $4.05 | 1d | 1 | 1.11mi |
| 1501 S Highland Ave Unit 1381Q Fullerton, CA | 1.0 | 1.0 | 550 | $2,350 | $4.27 | 1d | 1 | 1.11mi |
| 1501 S Highland Ave Unit 1381N Fullerton, CA | 1.0 | 1.0 | 550 | $2,110 | $3.84 | 3d | 1 | 1.11mi |
| 1501 S Highland Ave Unit 1351N Fullerton, CA | 1.0 | 1.0 | 550 | $2,210 | $4.02 | 1d | 1 | 1.11mi |
| 1501 S Highland Ave Unit 1521H Fullerton, CA | 1.0 | 1.0 | 650 | $2,435 | $3.75 | 10d | 1 | 1.11mi |
| 1501 S Highland Ave Unit 1401B Fullerton, CA | 1.0 | 1.0 | 550 | $2,215 | $4.03 | 21d | 1 | 1.11mi |
| 1000 E La Palma Ave Anaheim, CA | 1.0–2.0 | 1.0–2.0 | 806 | $2,470 | $3.06 | 1d | 1 | 1.15mi |
| 1250 E La Palma Ave Anaheim, CA | 1.0–2.0 | 1.0 | 762 | $2,500 | $3.28 | 1d | 2 | 1.20mi |
| 2030 E Chapman Ave Unit 2100F Fullerton, CA | 1.0 | 1.0 | 700 | $1,845 | $2.64 | 16d | 1 | 1.24mi |
| 113 S Lillie Ave Unit 113-06 Fullerton, CA | 2.0 | 1.0 | 750 | $2,395 | $3.19 | 1d | 1 | 1.27mi |
| 1723 E Briarvale Ave Unit B Anaheim, CA | 1.0 | 1.0 | 420 | $2,100 | $5.00 | 1d | 1 | 1.35mi |
Listing history 20 events
-
2026-06-18days on market $115,000 Active 147 DOM
-
2026-06-17days on market $115,000 Active 146 DOM
-
2026-06-16days on market $115,000 Active 145 DOM
-
2026-06-15days on market $115,000 Active 144 DOM
-
2026-06-13days on market $115,000 Active 142 DOM
-
2026-06-13days on market $115,000 Active 141 DOM
-
2026-06-09days on market $115,000 Active 138 DOM
-
2026-06-08days on market $115,000 Active 137 DOM
-
2026-06-07days on market $115,000 Active 136 DOM
-
2026-06-04days on market $115,000 Active 133 DOM
-
2026-06-03days on market $115,000 Active 132 DOM
-
2026-06-02days on market $115,000 Active 131 DOM
-
2026-06-01days on market $115,000 Active 130 DOM
-
2026-05-31days on market $115,000 Active 129 DOM
-
2026-03-24price $115,000
-
2026-01-26price $119,000
-
2026-01-22$125,000 Active
-
2025-02-10soldstatus $25,000 Closed Sale 167-char remark
Show marketing remark (167 chars)
New listing at Rancho La Paz Mobile home Park Fixer upper bring your tools and make it your own. Home to be sold as is with no repairs. Space rent monthly is $1797.00
-
2024-12-05status Pending Sale 167-char remark
Show marketing remark (167 chars)
New listing at Rancho La Paz Mobile home Park Fixer upper bring your tools and make it your own. Home to be sold as is with no repairs. Space rent monthly is $1797.00
-
2024-12-02$25,000 Active 167-char remark
Show marketing remark (167 chars)
New listing at Rancho La Paz Mobile home Park Fixer upper bring your tools and make it your own. Home to be sold as is with no repairs. Space rent monthly is $1797.00
ⓘ Source: listings_history table (triggers on properties + properties_extension) + one-shot
backfill from property_details.listing_events for pre-trigger history.
Climate risk First Street
- Flood 1/10 Low FEMA zone X (shaded) · 0% chance over 30 yrs
- Wildfire 1/10 Low
- Heat 6/10 Major 7 d/yr ≥93°F today · 22 d/yr by 30 yrs out
- Wind 1/10 Low
- Air quality 5/10 Major 7 unhealthy d/yr today · 9 by 30 yrs out
Nearby sold comps map
Loading sold comps map…
Walkable amenities ~0.75 mi
Loading nearby amenities…
Taxation est. · year 1
- Rental income
- $26,951
- − Mortgage interest
- −$6,442
- − Property taxes
- −$1,725
- − Insurance
- −$575
- − Repairs & maintenance
- −$2,156
- − Management
- −$2,156
- − Depreciation
- −$3,345
- Taxable income
- $10,551
- Est. tax owed @ 24.0%
- −$2,532
- After-tax cash flow
- $9,222/yr
For passive investors: Depreciation is non-cash, so a rental often shows a tax loss while cash-flowing — sheltering income. Rental losses are passive: they offset passive income freely, and up to $25,000/yr can offset ordinary (W-2) income if you actively participate and your MAGI is under $100k (phasing out to $0 by $150k); unused losses carry forward. On sale, claimed depreciation is recaptured at up to 25%, and gains may owe capital-gains tax (a 1031 exchange can defer both). Figures are a year-1 estimate at your 24.0% rate — not tax advice; consult a CPA.
Schools (NCES district)
- District
- Anaheim Elementary
- NCES district ID
- 0602610
- Math proficiency
- 25% ▼ -3.00%
- Reading proficiency
- 25% ▼ -9.00%
- Median HH income
- $55,235
- Composite
- 22.56/100
- National rank
- #8078
- State rank
- #386 of 517 in CA
Livability — Anaheim
- Score
- 70/100
- State rank
- #240
- US rank
- #7861
Category grades
Schools grade is shown separately in the Schools card above.
Census & demographics
- Census place
- Anaheim, CA
- County
- Orange County · 3,096,323 people
- City population
- 361,715
- Metro
- Los Angeles-Long Beach-Anaheim, CA
- Population (ZIP)
- 60,547
- Household income
- $83,725
- Rent vs Own
- Severe rent burden
- 3604.0
Population outlook (Orange County) Hauer SSP2
- Today (2025)
- 3,477,456 people
- By 2030
- 3,613,117 · +3.9%
- By 2040
- 3,835,945 · +10.3%
- By 2050
- 3,968,736 · +14.1%
- By 2075
- 4,097,053 · +17.8%
- By 2100
- 3,903,633 · +12.3%
Race, ethnicity, and origin ACS 2023
- Neighborhood character
- Diverse neighborhood (Simpson 0.59)
- Race & ethnicity
- Hispanic / Latino 59% Two or more races 19% Asian 19% White 16% Black 4%
- Hispanic origin (detail)
- Mexican 50%
- Common ancestry
- Russian 1% Lithuanian 1%
- Foreign-born
- 41% · Canada, Vietnam, South Korea
- Languages at home
- 30% English-only · Spanish 48% Tagalog/Filipino 5% Vietnamese 5%
Political lean MEDSL · Orange
- 2024 margin
- Toss-up / Even · D 49.7% · R 47.1% · Other 3.2%
- 2008→2024 swing
- +5.2pp toward D · 2008: -2.6pp · 2024: 2.6pp
- All cycles
- 2024: D+2.6 2020: D+9.0 2016: D+7.7 2012: R+8.3 2008: R+2.6
Not yet ingested
- Civics
- —
Market trends
- HPI YoY
- ▼ -723.92%
- Current HPI
- 446.9118
- Rent YoY
- ▲ 5.13%
- Metro
- Los Angeles-Long Beach-Anaheim, CA
- State GDP YoY
- ▲ 3.21%
- F500 in state
- 116
Industry mix (Fortune 500 HQ in CA)
| Industry | F500 HQs | Revenue |
|---|---|---|
| Technology | 27 | $1,492B |
|
||
| Financial Services | 3 | $174B |
|
||
| Retail | 3 | $44B |
|
||
| Insurance | 3 | $26B |
|
||
| Media / Entertainment | 2 | $115B |
|
||
| Pharmaceuticals / Biotech | 2 | $62B |
|
||
Price history
+360.0% since first listed6 events — show timeline
- 2026-03-24 Price Changed $115,000 CRMLS
- 2026-01-26 Price Changed $119,000 CRMLS
- 2026-01-22 Listed $125,000 CRMLS
- 2025-02-10 Sold (MLS) $25,000 CRMLS
- 2024-12-05 Pending — CRMLS
- 2024-12-02 Listed $25,000 CRMLS
Cash-flow waterfall
monthlySold comps — $/sqft
last 12 mo · ≤1 miLoading sold comps…