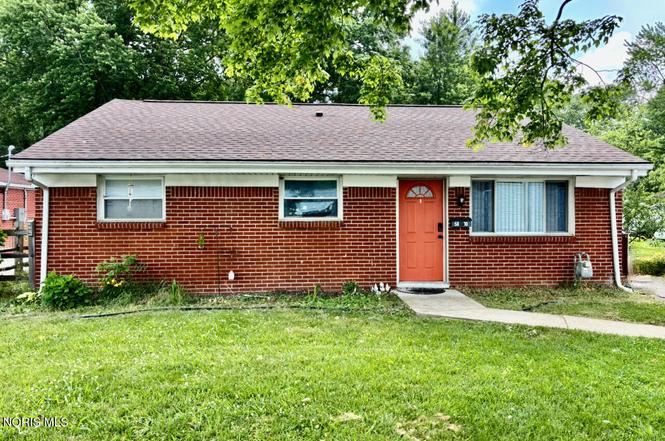
5810 Cushman Rd · Sylvania, OH
Flood risk 1/10 · Minimal
- FEMA flood zone
- X (unshaded)
- Chance of flooding over 30 yrs
- 0.0%
- Est. flood insurance / yr
- $507 – $1,088
Fire risk 1/10 · Minimal
- Est. fire insurance / yr
- $713 – $1,323
Heat risk 3/10 · Minor
- Hot days now (above 100°F)
- 7 days/yr
- Hot days in 30 yrs
- 15 days/yr
Wind risk 2/10 · Minimal
- Chance of severe wind over 30 yrs
- —
Air-quality risk 2/10 · Minimal
- Unhealthy air days now
- 1 days/yr
- Unhealthy air days in 30 yrs
- 1 days/yr
Risk factors via First Street. Map © Google.
Why this score? — see what drove the D+ grade
The composite is a weighted blend of 9 inputs, each scored 0–100. Each bar is that input's sub-score; the figure is the points it added to the 100-point composite (weight × sub-score).
- ARV discount +14.7/15.0
- Cash flow +12.6/30.0
- Schools +5.9/10.0
- Livability +4.4/5.0
- DSCR +3.7/10.0
- 1% rule +3.5/10.0
- Rent growth +2.5/5.0
- Condition / age +2.5/5.0
- Appreciation +0.0/10.0
$179,900
🖨 Deal sheet (PDF) 📄 Offer letter ✓ Due diligence
Listing remarks MLS
Brick ranch. Enter at your own risk-mold.Please provide proof of funds with offer.
Key facts
- One-level living
- Great location
- Fenced backyard
Tags
Property features AI
Exterior
- Parking: Driveway
- Utilities: Electricity connected; Natural gas connected; Public water; Sanitary sewer connected
- Home design: Single-family residence; One story
- Construction: Brick construction; Crawl space foundation; Built as a residential single family home
- Exterior features: Shingle roof
Interior
- Kitchen: Kitchen on the main level (11 x 11)
- Bedrooms: Bedroom 3 on the main level (12 x 10)
- Flooring: Carpet; Laminate
- Bathrooms: 1 full bathroom; 1 half bathroom (1.5 total)
- Heating & cooling: Forced air heating (natural gas); Central air conditioning
- Interior features: Open floorplan; 6 total rooms
- Laundry & utility: Laundry on the main level
Neighborhood map
What this means for you Summary
Snapshot
- This is a 3-bed/1.5-bath single-family listed at $180k.
Deal economics
- At list price, monthly cash flow is $-24 ($-286/yr) — negative.
- To cash-flow at today's rent, offer at most $176k (2.3% below list).
- To meet the 1% rule (rent ≥ 1% of price), the offer needs to be $153k (14.7% below list).
- Recommended offer: $153k (14.7% below list) — sets the bar for 1% rule.
- Cap rate 6.1% vs local median 2.8% in Sylvania — top-decile yield for the area; either an underpriced asset or a hidden risk that comps aren't pricing in. Stress-test before assuming the spread holds.
Location & tenants
- Location reads 88/100 on livability (#18 in OH, #191 nationally) — a professional / high-income tenant draw. Strengths: crime A+, employment A+, cost of living A+; Watch: amenities C-, commute F.
- Sylvania Schools (suburban): math 63% / reading 71% proficiency, ranked #157 of 656 in OH (top 24%) — acceptable for families but not a draw, mixed tenant base, ~2y average lease; only 18% free/reduced lunch — higher-income household profile.
- Zoned schools: Hill View Elementary School (math 67% / reading 73%, grade A-, #380 of 1,584 statewide, top 25%, 359 students, 32% FRL); Sylvania Arbor Hills Junior High School (math 56% / reading 58%, grade B, #305 of 654 statewide, top 48%, 502 students, 34% FRL); Sylvania Northview High School (math 59% / reading 78%, grade B, #130 of 781 statewide, top 17%, 1,352 students, 20% FRL).
- Market conditions: 196 active listings in the ZIP; 4 comparable units currently listed for rent nearby; rentals at typical pace (median 16d on market — plan ~3-4 weeks tenant-placement turnaround); solid renter incomes; 415 units permitted in Lucas County in 2024 (122 in 5+ unit buildings).
- This rent is only 17% of the median local income ($109k/yr) — well below the 30% rent-burden line; pricing power to push rent on renewal without tenant pushback.
Forward outlook
- Local home prices are declining (-3.0%/yr); year-one equity from $1k of loan paydown is wiped out by about $5k of value loss. Plan a longer hold.
- Lucas County population projected at -16% by 2050 — secular population decline; favor cash flow + early exit over multi-decade hold.
Negotiation context
- Only 11 days on market — expect competitive offers; lowballing is unlikely to land.
- 6 sale attempts since 16y ago; this cycle's ask is 13% above the opening price — seller raised mid-cycle; expect resistance to lowballs.
- Current owner paid $89k; list at $180k implies a 102% gain — meaningful room to come down on a strong offer.
Questions for the listing agent
- What do current leases actually rent for vs. the listed asking? Can we see a recent rent roll and the last 12 months of T-12 income?
- Built in 1966 — when were the roof, HVAC, electrical panel, plumbing, and water heater last replaced?
- Is there a deadline driving the sale (1031 exchange, divorce, estate, relocation)? That informs how much negotiation room exists.
- Schools are A-rated — typically a magnet for longer-tenancy family renters. What's the average tenant stay here, and is there a school-zone premium baked into asking?
- The area grade is low — what's the realistic commute time and amenity access for the typical tenant pool here? Any planned neighborhood developments (good or bad) we should know about?
- What's the average days-on-market for RENTAL listings here right now (not sales)? A rising rental-DOM trend means longer vacancies and softer asking-rent achievability than the comps imply.
- What's the recent tenant-quality profile in this submarket — average credit score on applications, eviction rate, late-payment / NSF rate, and stable-employment percentage? A property-management company in the area should have these aggregated.
- How much new for-sale + rental construction is in the pipeline within 1–3 miles? Heavy new supply typically softens prices + rents 12–24 months out; constrained supply supports both.
Investment metrics
- 1% rule
- 0.85% ✗
- Cap rate
- 6.13%
- Cash-on-cash
- -0.57%
- DSCR
- 0.97
- GRM
- 9.8
CMA / ARV
- ARV (on-the-fly)
- $214,016
- Comps found
- 12
Show comp detail 12 sales within ~0.75 mi
| Address | Dist | Beds/Ba | Sqft | Sold | Price | $/sf | Match |
|---|---|---|---|---|---|---|---|
| 5765 Acres Rd | 0.13mi | 3/1.5 | 1,341 (-5%) | 2mo | $135,000 | $101 | 84 |
| 5722 Balfour Rd | 0.15mi | 3/1.5 | 1,487 (+6%) | 10mo | $275,000 | $185 | 76 |
| 5643 Marshall Rd | 0.43mi | 3/1.5 | 1,440 (+2%) | 9mo | $220,000 | $153 | 69 |
| 5613 Marshall Rd | 0.49mi | 3/1.5 | 1,330 (-6%) | 4mo | $220,100 | $165 | 64 |
| 5904 Acres Rd | 0.21mi | 3/2.0 | 1,601 (+14%) | 4mo | $164,095 | $102 | 62 |
| 5660 Centerview Dr | 0.50mi | 4/1.5 (+1) | 1,352 (-4%) | 8mo | $220,000 | $163 | 58 |
| 5711 Elliott Dr | 0.34mi | 3/2.0 | 1,586 (+13%) | 8mo | $229,000 | $144 | 55 |
| 5707 Roan Rd | 0.52mi | 3/1.5 | 1,584 (+12%) | 1mo | $205,000 | $129 | 54 |
| 5640 Dellbrook Dr | 0.31mi | 4/2.0 (+1) | 1,595 (+13%) | 5mo | $219,900 | $138 | 52 |
| 5814 Summit St | 0.72mi | 3/1.0 | 1,264 (-10%) | 2mo | $191,500 | $152 | 46 |
| 5638 Northview Dr | 0.45mi | 4/2.0 (+1) | 1,224 (-13%) | 13mo | $210,000 | $172 | 39 |
| 5728 Rudyard Rd | 0.62mi | 3/1.0 | 1,217 (-14%) | 11mo | $155,000 | $127 | 38 |
Match score weights: distance 35% · size 25% · config 20% · recency 20%. Top-matched comps best support the ARV.
Projected returns pro-forma
-3.0% appreciation · 3.0% rent growth · sell at horizon
- IRR
- -17.2%
- Equity multiple
- 0.39×
- Total profit
- $-30,650
- Equity at exit
- $26,824
- IRR
- -9.2%
- Equity multiple
- 0.43×
- Total profit
- $-28,568
- Equity at exit
- $15,554
Cash invested: $50,372 (down + closing). Projections, not guarantees.
Landlord ↔ Tenant lean methodology
- Overall (STATE)
- 73 Landlord-Friendly
- State Ohio
- 73 Landlord-Friendly · R+6
- County
- — inherits STATE
- City
- — inherits STATE
ZIP-level market 43560
- Home prices YoY
- -31.7%
- Active inventory
- 196
- Price-to-rent
- 9.8×
Monthly cashflow live
- Estimated rent
- $1,534 medium interval (Pro) →
- Mortgage (P&I)
- −$943
- Tax from tax record
- −$217 /mo · $2,609/yr
- Insurance
- −$75
- HOA
- −$0
- Vacancy / Maint / Mgmt
- −$322
- Net cashflow
- $-24
Break-even live
Sensitivity live
| Price | -10% $78 | -5% $27 | +0% $-24 | +5% $-75 | +10% $-126 |
|---|---|---|---|---|---|
| Rent | -10% $-145 | -5% $-84 | +0% $-24 | +5% $37 | +10% $97 |
| Rate | -1.0pp $67 | -0.5pp $22 | base $-24 | +0.5pp $-70 | +1.0pp $-118 |
UW: 25.0% down · 7.5% · 30yr · 1.5% tax · 5.0% vac · 8.0% maint · 8.0% mgmt
Financing live
Cash to close
- Down payment
- $44,975
- Closing costs
- $5,397
- Reserves months
- —
- Total cash needed
- —
Loan-product check · same deal, 3 products live
Conventional
25% down · 7.5% · 30yr
- Down + closing
- —
- Monthly P&I
- —
- Monthly cashflow
- —
- DSCR
- —
- Eligible?
- —
Personal DTI + credit; lowest rate.
DSCR
20% down · 8.5% · 30yr
- Down + closing
- —
- Monthly P&I
- —
- Monthly cashflow
- —
- DSCR
- —
- Eligible?
- —
No personal income docs; deal must DSCR.
Hard money
10% down · 12.0% · 12mo
- Down + closing
- —
- Monthly P&I
- —
- Monthly cashflow
- —
- DSCR
- —
- Eligible?
- —
Short-term bridge; refi at stabilization.
Rent comps 4 comps
| Address | Beds | Baths | Sqft | Rent | $/sqft | DOM | Units | Dist |
|---|---|---|---|---|---|---|---|---|
| 6455 Monroe St Sylvania, OH | 1.0–2.0 | 1.0–2.5 | 744 | $2,567 | $3.45 | 15d | 16 | 0.73mi |
| 6632 Maplewood Ave Sylvania, OH | 2.0 | 1.0 | 875 | $1,068 | $1.22 | 15d | 7 | 0.87mi |
| 5716 Phillips Ave Unit 4 Sylvania, OH | 2.0 | 1.0 | 900 | $1,100 | $1.22 | 15d | 1 | 1.01mi |
| 4994 Main St Sylvania, OH | 2.0 | 1.0 | 1110 | $1,150 | $1.04 | 25d | 1 | 1.09mi |
Listing history 8 events
-
2026-06-21days on market $179,900 Coming Soon 11 DOM
-
2026-06-18days on market $179,900 Coming Soon 8 DOM
-
2026-06-17days on market $179,900 Coming Soon 7 DOM
-
2026-06-16days on market $179,900 Coming Soon 6 DOM
-
2026-06-15days on market $179,900 Coming Soon 5 DOM
-
2026-06-14days on market $179,900 Coming Soon 3 DOM
-
2026-06-13remarks 444-char remark
-
2026-06-13$179,900 Coming Soon 2 DOM
ⓘ Source: listings_history table (triggers on properties + properties_extension) + one-shot
backfill from property_details.listing_events for pre-trigger history.
Tax reassessment forecast OH · Partial reset (capped growth)
- Current annual tax
- $2,609 · $217/mo
- Projected year-2 tax
- $2,708 · $226/mo
- Expected delta
- +$99/yr (+$8/mo · 3.8%)
ⓘ Screening estimate from a state-policy table — verify with the county assessor before closing.
Climate risk First Street
- Flood 1/10 Low FEMA zone X (unshaded) · 0% chance over 30 yrs
- Wildfire 1/10 Low
- Heat 3/10 Moderate 7 d/yr ≥100°F today · 15 d/yr by 30 yrs out
- Wind 2/10 Low
- Air quality 2/10 Low 1 unhealthy d/yr today · 1 by 30 yrs out
Nearby sold comps map
Loading sold comps map…
Walkable amenities ~0.75 mi
Loading nearby amenities…
Taxation est. · year 1
- Rental income
- $18,409
- − Mortgage interest
- −$10,077
- − Property taxes
- −$2,609
- − Insurance
- −$900
- − Repairs & maintenance
- −$1,473
- − Management
- −$1,473
- − Depreciation
- −$5,233
- Taxable loss
- −$3,355
- Est. tax savings @ 24.0%
- +$805
- After-tax cash flow
- $519/yr
For passive investors: Depreciation is non-cash, so a rental often shows a tax loss while cash-flowing — sheltering income. Rental losses are passive: they offset passive income freely, and up to $25,000/yr can offset ordinary (W-2) income if you actively participate and your MAGI is under $100k (phasing out to $0 by $150k); unused losses carry forward. On sale, claimed depreciation is recaptured at up to 25%, and gains may owe capital-gains tax (a 1031 exchange can defer both). Figures are a year-1 estimate at your 24.0% rate — not tax advice; consult a CPA.
Schools (NCES district)
- District
- Sylvania Schools
- NCES district ID
- 3904487
- Math proficiency
- 63% ▼ -12.00%
- Reading proficiency
- 71% ▼ -6.00%
- Median HH income
- $71,949
- Composite
- 58.95/100
- National rank
- #967
- State rank
- #157 of 656 in OH
Livability — Sylvania
- Score
- 88/100
- State rank
- #18
- US rank
- #191
Category grades
Schools grade is shown separately in the Schools card above.
Census & demographics
- Census place
- Sylvania, OH
- County
- Lucas County · 380,724 people
- City population
- 33,286
- Metro
- Toledo, OH
- Population (ZIP)
- 33,286
- Household income
- $109,486
- Rent vs Own
- Severe rent burden
- 355.0
Population outlook (Lucas County) Hauer SSP2
- Today (2025)
- 420,751 people
- By 2030
- 410,187 · -2.5%
- By 2040
- 384,019 · -8.7%
- By 2050
- 355,125 · -15.6%
- By 2075
- 291,683 · -30.7%
- By 2100
- 233,670 · -44.5%
Race, ethnicity, and origin ACS 2023
- Neighborhood character
- Predominantly White (86%)
- Race & ethnicity
- White 86% Two or more races 4% Asian 4% Hispanic / Latino 3% Black 3%
- Common ancestry
- Romanian 10% Lithuanian 4% Slovak 2%
- Foreign-born
- 6% · China, Canada
- Languages at home
- 92% English-only · Other Indo-European 2% Arabic 2% Spanish 1%
Political lean MEDSL · Lucas
- 2024 margin
- D (+12.6) · D 55.8% · R 43.2%
- 2008→2024 swing
- -18.9pp toward R · 2008: 31.4pp · 2024: 12.6pp
- All cycles
- 2024: D+12.6 2020: D+16.8 2016: D+17.4 2012: D+30.4 2008: D+31.4
Not yet ingested
- Civics
- —
Market trends
- HPI YoY
- ▼ -99.73%
- Current HPI
- 215.2986
- Rent YoY
- —
- Metro
- Toledo, OH
- State GDP YoY
- ▲ 1.98%
- F500 in state
- 48
Industry mix (Fortune 500 HQ in OH)
| Industry | F500 HQs | Revenue |
|---|---|---|
| Insurance | 3 | $145B |
|
||
| Industrial Machinery | 3 | $49B |
|
||
| Financial Services | 3 | $24B |
|
||
| Consumer Goods | 2 | $93B |
|
||
| Aerospace / Defense | 2 | $47B |
|
||
| Utilities | 2 | $33B |
|
||
Price history
+501.7% since first listed18 events — show timeline
- 2026-06-10 Coming Soon $179,900 NORIS
- 2025-10-13 Price Changed $24,000 NORIS
- 2024-12-14 Listing Removed — NORIS
- 2024-12-06 Listed $159,900 NORIS
- 2024-11-19 Coming Soon — NORIS
- 2021-12-13 Listing Removed — NORIS
- 2021-12-10 Listed $119,900 NORIS
- 2021-11-21 Coming Soon — NORIS
- 2018-06-29 Sold (Public Records) $89,000 Public Records
- 2018-06-28 Sold (MLS) $89,000 NORIS
- 2018-01-22 Listed $89,000 NORIS
- 2014-04-11 Listing Removed — NORIS
- 2013-01-10 Listed $79,000 NORIS
- 2012-05-15 Listing Removed — NORIS
- 2011-08-05 Listed $39,900 NORIS
- 2010-11-01 Sold (MLS) $24,000 NORIS
- 2010-10-13 Price Changed $29,900 NORIS
- 2010-07-27 Listed $29,900 NORIS
Property tax history
+5.0%/yrLatest (2025): $2,609 · +3.3% YoY. Source: county tax records.
Cash-flow waterfall
monthlySold comps — $/sqft
last 12 mo · ≤1 miLoading sold comps…