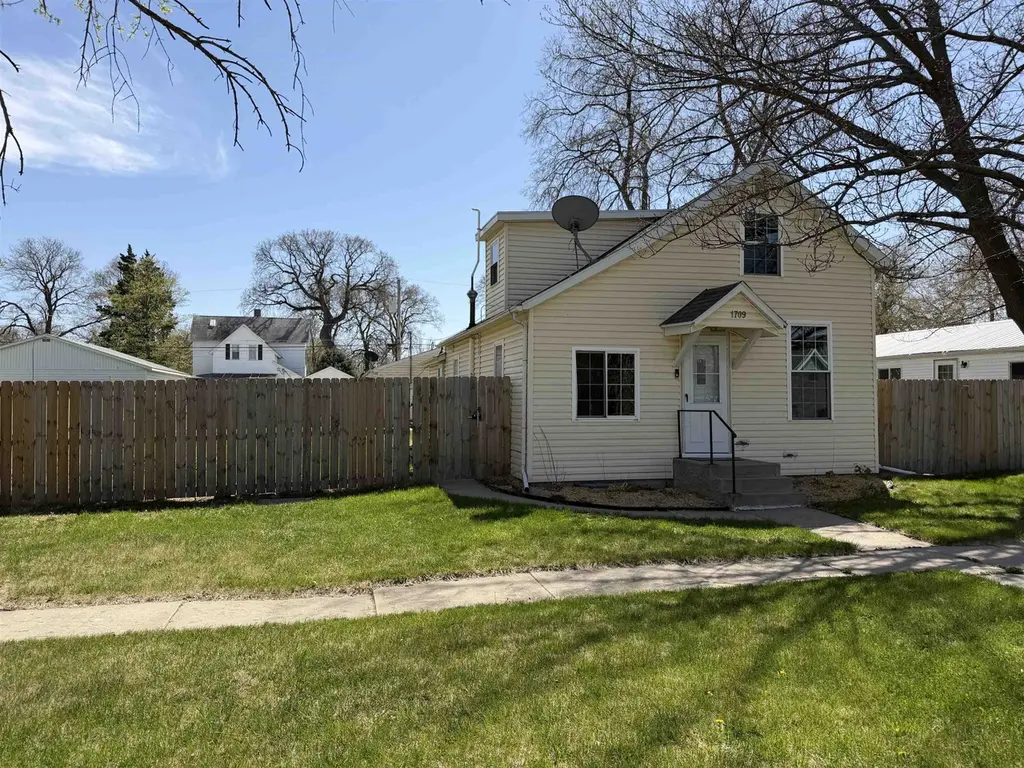
1709 12th St · Columbus, NE
Flood risk 1/10 · Minimal
- FEMA flood zone
- X
- Chance of flooding over 30 yrs
- 0.0%
- Est. flood insurance / yr
- $473 – $860
Fire risk 1/10 · Minimal
- Est. fire insurance / yr
- $1,161 – $2,155
Heat risk 3/10 · Minor
- Hot days now (above 104°F)
- 7 days/yr
- Hot days in 30 yrs
- 16 days/yr
Wind risk 2/10 · Minimal
- Chance of severe wind over 30 yrs
- —
Air-quality risk 1/10 · Minimal
- Unhealthy air days now
- 0 days/yr
- Unhealthy air days in 30 yrs
- 0 days/yr
Risk factors via First Street. Map © Google.
Why this score? — see what drove the C- grade
The composite is a weighted blend of 9 inputs, each scored 0–100. Each bar is that input's sub-score; the figure is the points it added to the 100-point composite (weight × sub-score).
- Cash flow +17.2/30.0
- ARV discount +14.3/15.0
- DSCR +5.3/10.0
- 1% rule +4.3/10.0
- Livability +4.0/5.0
- Schools +3.5/10.0
- Rent growth +2.5/5.0
- Condition / age +2.5/5.0
- Appreciation +0.0/10.0
$199,500
🖨 Deal sheet (PDF) 📄 Offer letter ✓ Due diligence
Listing remarks
Looking for a great starter home? Maybe something with a large yard and garage/ Come take a look this 3 bedroom 1 1/2 bath home located in Columbus. Tastefully updated and with a little work you can make it your own. Fully fenced back yard and huge 3 car garage. Call and setup a showing today.
Key facts
- Huge garage
- Large yard
- 3 garage spots
Tags
Property features AI
Exterior
- Parking: Detached 3-car garage
- Utilities: Public water; Public sewer; Natural gas available
- Home design: Single-family residence; One story
- Construction: Frame construction; Vinyl siding
- Exterior features: Asphalt roof
Interior
- Kitchen: Electric range; Refrigerator
- Heating & cooling: Forced air heating; Central air conditioning
- Interior features: Full finished basement; Electric water heater
- Laundry & utility: Laundry in basement
Neighborhood map
What this means for you Summary
Snapshot
- This is a 3-bed/2.0-bath single-family listed at $200k.
Deal economics
- At list price, monthly cash flow is $141 ($2k/yr) — positive.
- The deal already cash-flows at list — no discount required.
- To meet the 1% rule (rent ≥ 1% of price), the offer needs to be $185k (7.3% below list).
- Recommended offer: $185k (7.3% below list) — sets the bar for 1% rule.
- Cap rate 7.1% vs local median 3.3% in Columbus — top-decile yield for the area; either an underpriced asset or a hidden risk that comps aren't pricing in. Stress-test before assuming the spread holds.
Location & tenants
- Location reads 80/100 on livability (#20 in NE, #1,633 nationally) — a professional / high-income tenant draw. Strengths: crime A+, cost of living A+, housing A+; Watch: amenities D-, commute F.
- Columbus Public Schools (town): math 39% / reading 43% proficiency, ranked #93 of 111 in NE (top 84%) — families likely to look elsewhere, expect single-tenant / working-renter base with shorter leases.
- Market conditions: 300 active listings in the ZIP; 1 comparable units currently listed for rent nearby; 98 units permitted in Platte County in 2024 (17 in 5+ unit buildings).
Forward outlook
- Local home prices are declining (-3.0%/yr); year-one equity from $1k of loan paydown is wiped out by about $6k of value loss. Plan a longer hold.
- Platte County population projected at +13% by 2050 — modest demand growth; plan on rents tracking national, not racing it.
Negotiation context
- Only 9 days on market — expect competitive offers; lowballing is unlikely to land.
Risks & watch-outs
- Watch-outs: built in 1910 — expect roof / HVAC / electrical / plumbing capex.
Questions for the listing agent
- Built in 1910 — when were the roof, HVAC, electrical panel, plumbing, and water heater last replaced?
- Is there a deadline driving the sale (1031 exchange, divorce, estate, relocation)? That informs how much negotiation room exists.
- What's the average days-on-market for RENTAL listings here right now (not sales)? A rising rental-DOM trend means longer vacancies and softer asking-rent achievability than the comps imply.
- What's the recent tenant-quality profile in this submarket — average credit score on applications, eviction rate, late-payment / NSF rate, and stable-employment percentage? A property-management company in the area should have these aggregated.
- How much new for-sale + rental construction is in the pipeline within 1–3 miles? Heavy new supply typically softens prices + rents 12–24 months out; constrained supply supports both.
Investment metrics
- 1% rule
- 0.93% ✗
- Cap rate
- 7.14%
- Cash-on-cash
- 3.03%
- DSCR
- 1.13
- GRM
- 9.0
CMA / ARV
- ARV (on-the-fly)
- $235,144
- Comps found
- 12
Show comp detail 12 sales within ~0.75 mi
| Address | Dist | Beds/Ba | Sqft | Sold | Price | $/sf | Match |
|---|---|---|---|---|---|---|---|
| 103 E Parkway | 0.49mi | 3/2.0 | 1,953 (-1%) | 5mo | $240,000 | $123 | 71 |
| 1708 17th St | 0.37mi | 3/1.0 | 1,834 (-7%) | 2mo | $219,000 | $119 | 65 |
| 1464 22nd Ave | 0.37mi | 4/2.0 (+1) | 1,824 (-8%) | 2mo | $165,000 | $90 | 63 |
| 1065 20th Ave | 0.17mi | 4/2.0 (+1) | 2,240 (+13%) | 3mo | $200,000 | $89 | 62 |
| 2117 16th St | 0.39mi | 3/2.0 | 2,178 (+10%) | 4mo | $247,000 | $113 | 61 |
| 664 Louis Pl | 0.66mi | 3/2.0 | 2,080 (+5%) | 1mo | $252,000 | $121 | 59 |
| 1571 12th Ave | 0.46mi | 2/2.0 (-1) | 1,808 (-8%) | 3mo | $184,900 | $102 | 57 |
| 753 10th Ave | 0.57mi | 3/2.0 | 2,184 (+10%) | 1mo | $269,000 | $123 | 55 |
| 571 9th Ave | 0.66mi | 3/2.0 | 2,184 (+10%) | 3mo | $270,000 | $124 | 49 |
| 132 E Parkway Pkwy | 0.66mi | 2/2.0 (-1) | 2,132 (+8%) | 3mo | $214,000 | $100 | 48 |
| 1871 25th Ave | 0.67mi | 3/1.0 | 1,680 (-15%) | 6mo | $140,000 | $83 | 35 |
| 2161 22nd Ave | 0.71mi | 2/1.0 (-1) | 1,728 (-13%) | 3mo | $235,000 | $136 | 35 |
Match score weights: distance 35% · size 25% · config 20% · recency 20%. Top-matched comps best support the ARV.
Projected returns pro-forma
-3.0% appreciation · 3.0% rent growth · sell at horizon
- IRR
- -11.5%
- Equity multiple
- 0.58×
- Total profit
- $-23,345
- Equity at exit
- $29,746
- IRR
- -2.3%
- Equity multiple
- 0.84×
- Total profit
- $-8,784
- Equity at exit
- $17,249
Cash invested: $55,860 (down + closing). Projections, not guarantees.
Landlord ↔ Tenant lean methodology
- Overall (STATE)
- 83 Strongly Landlord-Friendly
- State Nebraska
- 83 Strongly Landlord-Friendly · R+13
- County
- — inherits STATE
- City
- — inherits STATE
ZIP-level market 68601
- Home prices YoY
- -22.4%
- Active inventory
- 300
- Price-to-rent
- 9.0×
Monthly cashflow live
- Estimated rent
- $1,850 medium interval (Pro) →
- Mortgage (P&I)
- −$1,046
- Tax from tax record
- −$191 /mo · $2,292/yr
- Insurance
- −$83
- HOA
- −$0
- Vacancy / Maint / Mgmt
- −$388
- Net cashflow
- $141
Break-even live
Sensitivity live
| Price | -10% $254 | -5% $198 | +0% $141 | +5% $85 | +10% $28 |
|---|---|---|---|---|---|
| Rent | -10% $-5 | -5% $68 | +0% $141 | +5% $214 | +10% $287 |
| Rate | -1.0pp $242 | -0.5pp $192 | base $141 | +0.5pp $89 | +1.0pp $37 |
UW: 25.0% down · 7.5% · 30yr · 1.5% tax · 5.0% vac · 8.0% maint · 8.0% mgmt
Financing live
Cash to close
- Down payment
- $49,875
- Closing costs
- $5,985
- Reserves months
- —
- Total cash needed
- —
Loan-product check · same deal, 3 products live
Conventional
25% down · 7.5% · 30yr
- Down + closing
- —
- Monthly P&I
- —
- Monthly cashflow
- —
- DSCR
- —
- Eligible?
- —
Personal DTI + credit; lowest rate.
DSCR
20% down · 8.5% · 30yr
- Down + closing
- —
- Monthly P&I
- —
- Monthly cashflow
- —
- DSCR
- —
- Eligible?
- —
No personal income docs; deal must DSCR.
Hard money
10% down · 12.0% · 12mo
- Down + closing
- —
- Monthly P&I
- —
- Monthly cashflow
- —
- DSCR
- —
- Eligible?
- —
Short-term bridge; refi at stabilization.
Rent comps 1 comps
| Address | Beds | Baths | Sqft | Rent | $/sqft | DOM | Units | Dist |
|---|---|---|---|---|---|---|---|---|
| 1281 37th Ave Columbus, NE | 2.0 | 2.0 | 1250 | $1,850 | $1.48 | 44d | 1 | 1.24mi |
Listing history 5 events
-
2026-04-30status Pending
-
2026-04-20$199,500 Active
-
2023-02-06soldstatus $180,000
-
2010-07-12soldstatus $79,000
-
2004-03-05soldstatus $67,000
ⓘ Source: listings_history table (triggers on properties + properties_extension) + one-shot
backfill from property_details.listing_events for pre-trigger history.
Tax reassessment forecast NE · Resets to sale price
- Current annual tax
- $2,292 · $191/mo
- Projected year-2 tax
- $3,451 · $288/mo
- Expected delta
- +$1,159/yr (+$97/mo · 50.6%)
ⓘ Screening estimate from a state-policy table — verify with the county assessor before closing.
Climate risk First Street
- Flood 1/10 Low FEMA zone X · 0% chance over 30 yrs
- Wildfire 1/10 Low
- Heat 3/10 Moderate 7 d/yr ≥104°F today · 16 d/yr by 30 yrs out
- Wind 2/10 Low
- Air quality 1/10 Low 0 unhealthy d/yr today · 0 by 30 yrs out
Nearby sold comps map
Loading sold comps map…
Walkable amenities ~0.75 mi
Loading nearby amenities…
Taxation est. · year 1
- Rental income
- $22,200
- − Mortgage interest
- −$11,175
- − Property taxes
- −$2,292
- − Insurance
- −$998
- − Repairs & maintenance
- −$1,776
- − Management
- −$1,776
- − Depreciation
- −$5,804
- Taxable loss
- −$1,620
- Est. tax savings @ 24.0%
- +$389
- After-tax cash flow
- $2,083/yr
For passive investors: Depreciation is non-cash, so a rental often shows a tax loss while cash-flowing — sheltering income. Rental losses are passive: they offset passive income freely, and up to $25,000/yr can offset ordinary (W-2) income if you actively participate and your MAGI is under $100k (phasing out to $0 by $150k); unused losses carry forward. On sale, claimed depreciation is recaptured at up to 25%, and gains may owe capital-gains tax (a 1031 exchange can defer both). Figures are a year-1 estimate at your 24.0% rate — not tax advice; consult a CPA.
Schools (NCES district)
- District
- Columbus Public Schools
- NCES district ID
- 3105340
- Math proficiency
- 39% ▼ -10.00%
- Reading proficiency
- 43% ▼ -3.00%
- Median HH income
- $51,074
- Composite
- 35.41/100
- National rank
- #4942
- State rank
- #93 of 111 in NE
Livability — Columbus
- Score
- 80/100
- State rank
- #20
- US rank
- #1633
Category grades
Schools grade is shown separately in the Schools card above.
Census & demographics
- Census place
- Columbus, NE
- City population
- 30,619
- Population (ZIP)
- 30,619
Population outlook (Platte County) Hauer SSP2
- Today (2025)
- 34,130 people
- By 2030
- 34,778 · +1.9%
- By 2040
- 36,436 · +6.8%
- By 2050
- 38,648 · +13.2%
- By 2075
- 47,293 · +38.6%
- By 2100
- 57,020 · +67.1%
Race, ethnicity, and origin ACS 2023
- Neighborhood character
- Predominantly White (71%)
- Race & ethnicity
- White 71% Hispanic / Latino 25% Two or more races 14%
- Hispanic origin (detail)
- Mexican 14% Cuban 2%
- Common ancestry
- Romanian 7% Portuguese 2% Lithuanian 1%
- Foreign-born
- 14% · Canada
- Languages at home
- 79% English-only · Spanish 20%
Political lean MEDSL · Platte
- 2024 margin
- Solid R (+58.3) · D 20.4% · R 78.7%
- 2008→2024 swing
- -16.8pp toward R · 2008: -41.5pp · 2024: -58.3pp
- All cycles
- 2024: R+58.3 2020: R+56.8 2016: R+58.8 2012: R+51.8 2008: R+41.5
Not yet ingested
- Civics
- —
Market trends
- HPI YoY
- ▼ -100.37%
- Current HPI
- 347.5063
- Rent YoY
- —
- Metro
- —
- State GDP YoY
- ▲ 0.68%
- F500 in state
- 2
Industry mix (Fortune 500 HQ in NE)
| Industry | F500 HQs | Revenue |
|---|---|---|
| Conglomerate | 1 | $371B |
|
||
Price history
+197.8% since first listed5 events — show timeline
- 2026-04-30 Pending — CBOR
- 2026-04-20 Listed $199,500 CBOR
- 2023-02-06 Sold (Public Records) $180,000 Public Records
- 2010-07-12 Sold (Public Records) $79,000 Public Records
- 2004-03-05 Sold (Public Records) $67,000 Public Records
Property tax history
+2.5%/yrLatest (2025): $2,292 · +2.5% YoY. Source: county tax records.
Cash-flow waterfall
monthlySold comps — $/sqft
last 12 mo · ≤1 miLoading sold comps…