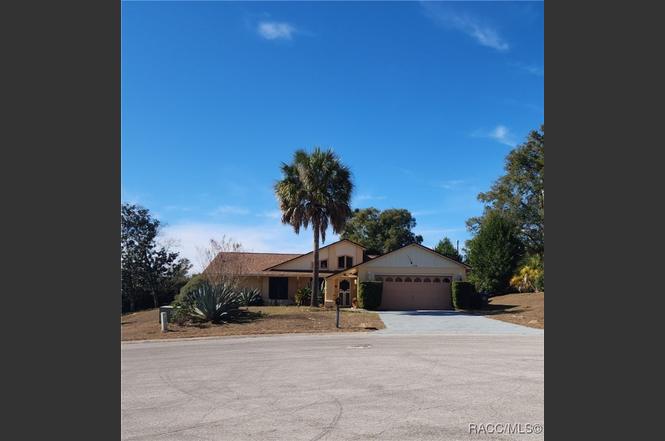
200 N Entry Oaks Pt · Lecanto, FL
Flood risk 1/10 · Minimal
- FEMA flood zone
- X (unshaded)
- Chance of flooding over 30 yrs
- 0.0%
- Est. flood insurance / yr
- $507 – $1,088
Fire risk 6/10 · Moderate
- Est. fire insurance / yr
- $947 – $1,759
Heat risk 9/10 · Severe
- Hot days now (above 108°F)
- 7 days/yr
- Hot days in 30 yrs
- 24 days/yr
Wind risk 9/10 · Severe
- Chance of severe wind over 30 yrs
- 99.0%
Air-quality risk 1/10 · Minimal
- Unhealthy air days now
- 0 days/yr
- Unhealthy air days in 30 yrs
- 0 days/yr
Risk factors via First Street. Map © Google.
Why this score? — see what drove the C grade
The composite is a weighted blend of 9 inputs, each scored 0–100. Each bar is that input's sub-score; the figure is the points it added to the 100-point composite (weight × sub-score).
- Cash flow +20.0/30.0
- ARV discount +15.0/15.0
- DSCR +6.3/10.0
- 1% rule +4.1/10.0
- Schools +4.1/10.0
- Livability +3.2/5.0
- Rent growth +2.5/5.0
- Condition / age +2.5/5.0
- Appreciation +0.0/10.0
$230,000
🖨 Deal sheet 📄 Offer letter ✓ Due diligence
Listing remarks
CRYSTAL OAKS SUBDIVISION! NO HOA FEES REQUIRED! This modern home provides ample space for a pool. The roof was replaced in 2021. It features 3 bedrooms and 2 bathrooms, in addition to a living room, Florida room, dining room, and screened porch. All appliances are included; the dishwasher is from 2022, and both the washer and dryer are relatively new. Although Crystal Oaks does not have a homeowners association, there is an option to join the Crystal Oaks Civic Association for a small fee. Ideally located near shopping, restaurants, medical facilities, the YMCA, Central Florida Community College, public schools, biking/ walking trails, and the Suncoast Parkway for convenient commuting. Do
Key facts
- Space for a pool
- Included appliances
- 0.28 acre lot
Tags
Neighborhood map
What this means for you Summary
Snapshot
- This is a 3-bed/2.0-bath single-family listed at $230k.
Deal economics
- At list price, monthly cash flow is $280 ($3k/yr) — positive.
- The deal already cash-flows at list — no discount required.
- To meet the 1% rule (rent ≥ 1% of price), the offer needs to be $210k (8.6% below list).
- Recommended offer: $210k (8.6% below list) — sets the bar for 1% rule.
- Cap rate 7.8% vs local median 5.2% in Lecanto — top-decile yield for the area; either an underpriced asset or a hidden risk that comps aren't pricing in. Stress-test before assuming the spread holds.
Location & tenants
- Location reads 64/100 on livability (#680 in FL) — a middle-class / working-renter tenant base. Strengths: cost of living A+, housing A, crime B; Watch: health & safety C-, employment D, amenities F.
- Citrus (rural): math 49% / reading 50% proficiency, ranked #44 of 73 in FL (top 60%) — families likely to look elsewhere, expect single-tenant / working-renter base with shorter leases.
- Zoned schools: Rock Crusher Elementary School (math 70% / reading 56%, grade B, #582 of 2,144 statewide, top 28%, 665 students, 68% FRL); Crystal River Middle School (math 49% / reading 47%, grade C-, #286 of 571 statewide, top 50%, 900 students, 64% FRL); Citrus High School (math 34% / reading 51%, grade F, #264 of 667 statewide, top 41%, 1,503 students, 54% FRL) — zoned schools at 62% FRL track the district average.
- Market conditions: 197 active listings in the ZIP; 4 comparable units currently listed for rent nearby; rentals at typical pace (median 21d on market — plan ~3-4 weeks tenant-placement turnaround); 2,443 units permitted in Citrus County in 2024 (0 in 5+ unit buildings).
- This rent runs 40% of the median local income ($63k/yr) — at the standard rent-burdened threshold; future hikes will face affordability resistance.
Forward outlook
- Local home prices are declining (-3.0%/yr); year-one equity from $2k of loan paydown is wiped out by about $7k of value loss. Plan a longer hold.
- Citrus County population projected to shrink 10% by 2050 — rents likely to lag national; underwrite the cash flow, not the appreciation.
Negotiation context
- It's been on market 75 days — a 6% lower offer ($216k) is reasonable based on typical stale-listing flexibility.
- Current owner paid $139k; list at $230k implies a 65% gain — meaningful room to come down on a strong offer.
Risks & watch-outs
- Climate carrying-cost: severe wind risk, 99% chance of damaging wind over 30y; major wildfire risk; extreme-heat days projected 7→24/yr by 2055 (HVAC capex compounding) — expect insurance premiums to compound above CPI over the hold.
Questions for the listing agent
- It's been on market 75 days. Have you received any prior offers? Is the seller open to a 9% concession, seller financing, or rate buy-down credit?
- Why hasn't it sold? Are there any deal-killer items the seller is aware of (foundation, flood, title, zoning, code violations)?
- Is there a deadline driving the sale (1031 exchange, divorce, estate, relocation)? That informs how much negotiation room exists.
- Schools are D-rated, which usually means shorter tenancies and higher turnover. Who's the typical renter profile here, and what's been the actual vacancy rate?
- What's the average days-on-market for RENTAL listings here right now (not sales)? A rising rental-DOM trend means longer vacancies and softer asking-rent achievability than the comps imply.
- What's the recent tenant-quality profile in this submarket — average credit score on applications, eviction rate, late-payment / NSF rate, and stable-employment percentage? A property-management company in the area should have these aggregated.
- How much new for-sale + rental construction is in the pipeline within 1–3 miles? Heavy new supply typically softens prices + rents 12–24 months out; constrained supply supports both.
Investment metrics
- 1% rule
- 0.91% ✗
- Cap rate
- 7.76%
- Cash-on-cash
- 5.23%
- DSCR
- 1.23
- GRM
- 9.1
CMA / ARV
- ARV (on-the-fly)
- $278,882
- Comps found
- 12
Show comp detail 12 sales within ~0.75 mi
| Address | Dist | Beds/Ba | Sqft | Sold | Price | $/sf | Match |
|---|---|---|---|---|---|---|---|
| 271 N Mesquite Pt | 0.20mi | 3/2.0 | 1,557 (-0%) | 13mo | $215,000 | $138 | 80 |
| 5195 W Kristina Loop | 0.26mi | 3/2.0 | 1,558 (0%) | 14mo | $295,000 | $189 | 76 |
| 222 N Mesquite Pt | 0.22mi | 3/2.0 | 1,362 (-13%) | 3mo | $214,000 | $157 | 66 |
| 5118 W Kristina Loop | 0.25mi | 2/2.0 (-1) | 1,627 (+4%) | 11mo | $294,000 | $181 | 66 |
| 483 N Turkey Pine Loop | 0.28mi | 3/2.0 | 1,690 (+8%) | 9mo | $260,000 | $154 | 66 |
| 174 N Mesquite Pt | 0.23mi | 3/2.0 | 1,637 (+5%) | 20mo | $243,000 | $148 | 64 |
| 72 N Pizarro Pt | 0.30mi | 3/2.0 | 1,392 (-11%) | 8mo | $250,000 | $180 | 62 |
| 322 N Turkey Pine Loop | 0.39mi | 3/2.0 | 1,761 (+13%) | 8mo | $255,000 | $145 | 54 |
| 136 N Skyflower Pt | 0.57mi | 3/2.0 | 1,608 (+3%) | 17mo | $330,000 | $205 | 53 |
| 5455 W Heather Ridge Path | 0.61mi | 3/2.0 | 1,640 (+5%) | 14mo | $300,990 | $184 | 51 |
| 4900 W Trinity Pl | 0.65mi | 3/1.0 | 1,430 (-8%) | 6mo | $110,000 | $77 | 47 |
| 325 N Turkey Pine Loop | 0.36mi | 3/2.0 | 1,787 (+15%) | 16mo | $320,000 | $179 | 46 |
Match score weights: distance 35% · size 25% · config 20% · recency 20%. Top-matched comps best support the ARV.
Projected returns pro-forma
-3.0% appreciation · 3.0% rent growth · sell at horizon
- IRR
- -8.2%
- Equity multiple
- 0.70×
- Total profit
- $-19,502
- Equity at exit
- $34,294
- IRR
- 1.2%
- Equity multiple
- 1.09×
- Total profit
- $5,627
- Equity at exit
- $19,886
Cash invested: $64,400 (down + closing). Projections, not guarantees.
Landlord ↔ Tenant lean methodology
- Overall (STATE)
- 87 Strongly Landlord-Friendly
- State Florida
- 87 Strongly Landlord-Friendly · R+3
- County
- — inherits STATE
- City
- — inherits STATE
ZIP-level market 34461
- Home prices YoY
- -10.2%
- Active inventory
- 197
- Price-to-rent
- 9.1×
Monthly cashflow live
- Estimated rent
- $2,102 medium interval (Pro) →
- Mortgage (P&I)
- −$1,206
- Tax from tax record
- −$78 /mo · $940/yr
- Insurance
- −$96
- HOA
- −$0
- Vacancy / Maint / Mgmt
- −$441
- Net cashflow
- $280
Break-even live
UW: 25.0% down · 7.5% · 30yr · 1.5% tax · 5.0% vac · 8.0% maint · 8.0% mgmt
Financing live
Cash to close
- Down payment
- $57,500
- Closing costs
- $6,900
- Reserves months
- —
- Total cash needed
- —
Loan-product check · same deal, 3 products live
Conventional
25% down · 7.5% · 30yr
- Down + closing
- —
- Monthly P&I
- —
- Monthly cashflow
- —
- DSCR
- —
- Eligible?
- —
Personal DTI + credit; lowest rate.
DSCR
20% down · 8.5% · 30yr
- Down + closing
- —
- Monthly P&I
- —
- Monthly cashflow
- —
- DSCR
- —
- Eligible?
- —
No personal income docs; deal must DSCR.
Hard money
10% down · 12.0% · 12mo
- Down + closing
- —
- Monthly P&I
- —
- Monthly cashflow
- —
- DSCR
- —
- Eligible?
- —
Short-term bridge; refi at stabilization.
Rent comps 4 comps
| Address | Beds | Baths | Sqft | Rent | $/sqft | DOM | Units | Dist |
|---|---|---|---|---|---|---|---|---|
| 5085 W Kristina Loop Lecanto, FL | 2.0 | 2.0 | 1227 | $1,800 | $1.47 | 21d | 1 | 0.20mi |
| 271 N Lombardy Pt Lecanto, FL | 2.0 | 2.0 | 1809 | $1,500 | $0.83 | 21d | 1 | 0.28mi |
| 31 N Pizarro Pt Lecanto, FL | 2.0 | 2.0 | 2011 | $2,395 | $1.19 | 21d | 1 | 0.32mi |
| 1165 N Commerce Ter Lecanto, FL | 3.0 | 2.5 | 1697 | $1,800 | $1.06 | 21d | 1 | 1.00mi |
Listing history 6 events
-
2026-04-10status Pending
-
2026-03-05price $230,000
-
2026-01-22$235,500 Active
-
2019-07-02soldstatus $139,000
-
2019-01-29soldstatus $105,000
-
1989-04-01soldstatus $100,600
ⓘ Source: listings_history table (triggers on properties + properties_extension) + one-shot
backfill from property_details.listing_events for pre-trigger history.
Tax reassessment forecast FL · Resets to sale price
- Current annual tax
- $940 · $78/mo
- Projected year-2 tax
- $1,909 · $159/mo
- Expected delta
- +$969/yr (+$81/mo · 103.0%)
ⓘ Screening estimate from a state-policy table — verify with the county assessor before closing.
Climate risk First Street
- Flood 1/10 Low FEMA zone X (unshaded) · 0% chance over 30 yrs
- Wildfire 6/10 Major
- Heat 9/10 Extreme 7 d/yr ≥108°F today · 24 d/yr by 30 yrs out
- Wind 9/10 Extreme 99% chance of damaging wind over 30 yrs
- Air quality 1/10 Low 0 unhealthy d/yr today · 0 by 30 yrs out
Nearby sold comps map
Loading sold comps map…
Walkable amenities ~0.75 mi
Loading nearby amenities…
Taxation est. · year 1
- Rental income
- $25,228
- − Mortgage interest
- −$12,884
- − Property taxes
- −$940
- − Insurance
- −$1,150
- − Repairs & maintenance
- −$2,018
- − Management
- −$2,018
- − Depreciation
- −$6,691
- Taxable loss
- −$474
- Est. tax savings @ 24.0%
- +$114
- After-tax cash flow
- $3,479/yr
For passive investors: Depreciation is non-cash, so a rental often shows a tax loss while cash-flowing — sheltering income. Rental losses are passive: they offset passive income freely, and up to $25,000/yr can offset ordinary (W-2) income if you actively participate and your MAGI is under $100k (phasing out to $0 by $150k); unused losses carry forward. On sale, claimed depreciation is recaptured at up to 25%, and gains may owe capital-gains tax (a 1031 exchange can defer both). Figures are a year-1 estimate at your 24.0% rate — not tax advice; consult a CPA.
Schools (NCES district)
- District
- Citrus
- NCES district ID
- 1200270
- Math proficiency
- 49% ▼ -10.00%
- Reading proficiency
- 50% ▼ -6.00%
- Median HH income
- $38,618
- Composite
- 41.28/100
- National rank
- #3519
- State rank
- #44 of 73 in FL
Livability — Lecanto
- Score
- 64/100
- State rank
- #680
- US rank
- #14112
Category grades
Schools grade is shown separately in the Schools card above.
Census & demographics
- Census place
- Lecanto, FL
- County
- Citrus County · 111,314 people
- City population
- 13,377
- Metro
- Homosassa Springs, FL
- Population (ZIP)
- 13,377
- Household income
- $63,418
- Rent vs Own
- Severe rent burden
- 41.0
Population outlook (Citrus County) Hauer SSP2
- Today (2025)
- 138,622 people
- By 2030
- 136,886 · -1.3%
- By 2040
- 132,009 · -4.8%
- By 2050
- 125,196 · -9.7%
- By 2075
- 108,570 · -21.7%
- By 2100
- 84,454 · -39.1%
Race, ethnicity, and origin ACS 2023
- Neighborhood character
- Predominantly White (87%)
- Race & ethnicity
- White 87% Hispanic / Latino 8% Two or more races 7% Black 2%
- Hispanic origin (detail)
- Puerto Rican 3%
- Common ancestry
- Romanian 3% Lithuanian 3% Slovak 3%
- Foreign-born
- 8% · Canada, Jamaica
- Languages at home
- 95% English-only · Spanish 3%
Political lean MEDSL · Citrus
- 2024 margin
- Solid R (+45.9) · D 26.8% · R 72.6%
- 2008→2024 swing
- -29.8pp toward R · 2008: -16.1pp · 2024: -45.9pp
- All cycles
- 2024: R+45.9 2020: R+41.0 2016: R+39.7 2012: R+21.9 2008: R+16.1
Not yet ingested
- Civics
- —
Market trends
- HPI YoY
- ▼ -29.48%
- Current HPI
- 258.0866
- Rent YoY
- —
- Metro
- Homosassa Springs, FL
- State GDP YoY
- ▲ 3.28%
- F500 in state
- 36
Industry mix (Fortune 500 HQ in FL)
| Industry | F500 HQs | Revenue |
|---|---|---|
| Industrial Technology | 2 | $29B |
|
||
| Insurance | 2 | $17B |
|
||
| Retail | 1 | $60B |
|
||
| Technology Distribution | 1 | $58B |
|
||
| Homebuilding | 1 | $35B |
|
||
| Technology Manufacturing | 1 | $35B |
|
||
Price history
+128.6% since first listed6 events — show timeline
- 2026-04-10 Pending — RACC
- 2026-03-05 Price Changed $230,000 RACC
- 2026-01-22 Listed $235,500 RACC
- 2019-07-02 Sold (Public Records) $139,000 Public Records
- 2019-01-29 Sold (Public Records) $105,000 Public Records
- 1989-04-01 Sold (Public Records) $100,600 Public Records
Property tax history
-3.0%/yrLatest (2025): $940 · +8.8% YoY. Source: county tax records.
Cash-flow waterfall
monthlySold comps — $/sqft
last 12 mo · ≤1 miLoading sold comps…