404 Worth St · Ackley, IA
Flood risk 1/10 · Minimal
- FEMA flood zone
- X (unshaded)
- Chance of flooding over 30 yrs
- 0.0%
- Est. flood insurance / yr
- $473 – $860
Fire risk 3/10 · Minor
- Est. fire insurance / yr
- $902 – $1,676
Heat risk 2/10 · Minimal
- Hot days now (above 102°F)
- 7 days/yr
- Hot days in 30 yrs
- 15 days/yr
Wind risk 2/10 · Minimal
- Chance of severe wind over 30 yrs
- —
Air-quality risk 1/10 · Minimal
- Unhealthy air days now
- 0 days/yr
- Unhealthy air days in 30 yrs
- 0 days/yr
Risk factors via First Street. Map © Google.
Why this score? — see what drove the A grade
The composite is a weighted blend of 9 inputs, each scored 0–100. Each bar is that input's sub-score; the figure is the points it added to the 100-point composite (weight × sub-score).
- Cash flow +30.0/30.0
- ARV discount +15.0/15.0
- 1% rule +10.0/10.0
- DSCR +10.0/10.0
- Appreciation +6.4/10.0
- Schools +5.5/10.0
- Livability +3.5/5.0
- Rent growth +2.5/5.0
- Condition / age +2.5/5.0
$65,000
🖨 Deal sheet 📄 Offer letter ✓ Due diligence
Listing remarks
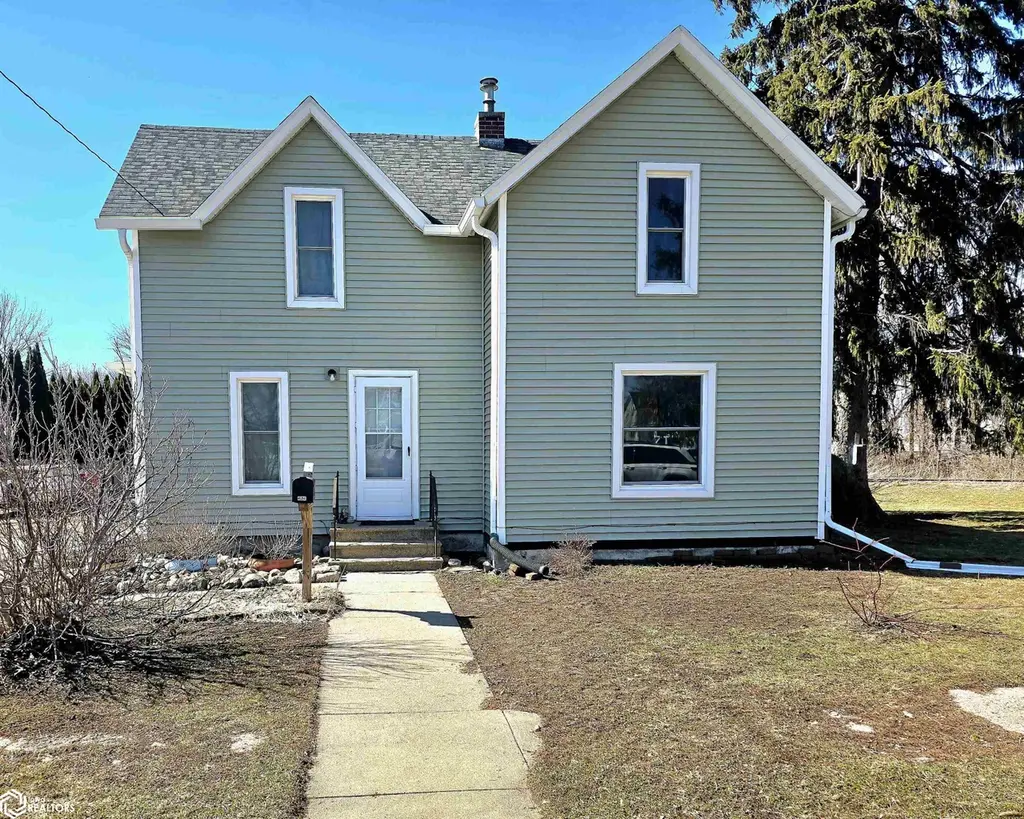
Discover this inviting 4-bedroom, 1-bath home nestled in the tranquil small town of Ackley. Boasting a spacious lot surrounded by mature trees, this charming residence offers plenty of potential for personalized updates to make it truly your own. Property used to have a 2 stall garage, the slab is still on the property, making for an easy garage addition, if desire. Recent updates to the roof, siding, gutters, windows and exterior doors provide added peace of mind and curb appeal. Whether you're looking for a cozy home or a peaceful retreat, this property provides a wonderful opportunity to enjoy small-town living with plenty of character. Don’t miss your chance—schedule a tour
Key facts
- Recent updates
- Spacious lot
- Curb appeal
Tags
Property features AI
Exterior
- Parking: Detached garage
- Utilities: Public water; Public sewer; Electric with circuit breakers
- Home design: Two-story single family residence; Vinyl siding
- Construction: Vinyl siding construction
- Exterior features: Publicly maintained road
Interior
- Kitchen: Range; Refrigerator
- Bathrooms: 1 full bathroom
- Heating & cooling: Central air conditioning; Forced air heating
- Interior features: Range; Refrigerator; Basement
Neighborhood map
What this means for you Summary
Snapshot
- This is a 4-bed/1.0-bath single-family listed at $65k.
Deal economics
- At list price, monthly cash flow is $466 ($6k/yr) — positive.
- The deal already cash-flows at list — no discount required.
- Meets the 1% rule at list price ($1k rent vs $65k).
- Recommended offer: $61k (6.0% below list) — sets the bar for market timing.
Location & tenants
- Location reads 70/100 on livability (#377 in IA) — a middle-class / working-renter tenant base. Strengths: crime A+, cost of living A+, housing A+; Watch: amenities F, commute F, health & safety F.
- Agwsr Community School District (rural): math 60% / reading 69% proficiency, ranked #198 of 289 in IA (top 68%) — acceptable for families but not a draw, mixed tenant base, ~2y average lease.
- Market conditions: 29 active listings in the ZIP; 6 units permitted in Hardin County in 2024 (0 in 5+ unit buildings).
Forward outlook
- In year one you build about $2k of equity ($449 loan paydown + $2k appreciation (2.8% local appreciation)).
- Hardin County population projected to shrink 6% by 2050 — rents likely to lag national; underwrite the cash flow, not the appreciation.
- At projected returns (2.8% appreciation + 3.0% rent growth), your $18k cash investment doubles in ~3 years — after that, you're playing with house money.
Negotiation context
- It's been on market 71 days — a 6% lower offer ($61k) is reasonable based on typical stale-listing flexibility.
- 4 sale attempts with the ask held roughly flat each time — persistent listings suggest the price (not the market) is what's stuck; bring a comps-based counter.
Risks & watch-outs
- Watch-outs: built in 1867 — expect roof / HVAC / electrical / plumbing capex.
Questions for the listing agent
- It's been on market 71 days. Have you received any prior offers? Is the seller open to a 6% concession, seller financing, or rate buy-down credit?
- Built in 1867 — when were the roof, HVAC, electrical panel, plumbing, and water heater last replaced?
- Why hasn't it sold? Are there any deal-killer items the seller is aware of (foundation, flood, title, zoning, code violations)?
- Is there a deadline driving the sale (1031 exchange, divorce, estate, relocation)? That informs how much negotiation room exists.
- Schools are B-rated — typically a magnet for longer-tenancy family renters. What's the average tenant stay here, and is there a school-zone premium baked into asking?
- What's the average days-on-market for RENTAL listings here right now (not sales)? A rising rental-DOM trend means longer vacancies and softer asking-rent achievability than the comps imply.
- What's the recent tenant-quality profile in this submarket — average credit score on applications, eviction rate, late-payment / NSF rate, and stable-employment percentage? A property-management company in the area should have these aggregated.
- How much new for-sale + rental construction is in the pipeline within 1–3 miles? Heavy new supply typically softens prices + rents 12–24 months out; constrained supply supports both.
Investment metrics
- 1% rule
- 1.69% ✓
- Cap rate
- 14.90%
- Cash-on-cash
- 30.74%
- DSCR
- 2.37
- GRM
- 4.9
CMA / ARV
- ARV (on-the-fly)
- $103,936
- Comps found
- 7
Show comp detail 7 sales within ~0.75 mi
| Address | Dist | Beds/Ba | Sqft | Sold | Price | $/sf | Match |
|---|---|---|---|---|---|---|---|
| 422 Cerro Gordo St St | 0.17mi | 4/1.0 | 1,744 (+7%) | 2mo | $35,000 | $20 | 78 |
| 1111 2nd Ave | 0.66mi | 4/2.0 | 1,636 (+1%) | 1mo | $179,900 | $110 | 63 |
| 600 5th Ave Ave | 0.34mi | 3/1.0 (-1) | 1,628 (+0%) | 21mo | $104,900 | $64 | 61 |
| 910 2nd Ave Ave | 0.47mi | 4/1.0 | 1,420 (-13%) | 6mo | $20,000 | $14 | 52 |
| 918 Main St | 0.48mi | 3/1.5 (-1) | 1,760 (+8%) | 6mo | $95,000 | $54 | 52 |
| 1009 Main | 0.55mi | 4/1.5 | 1,860 (+14%) | 13mo | $172,900 | $93 | 37 |
| 1108 3rd Ave | 0.62mi | 3/2.0 (-1) | 1,493 (-8%) | 22mo | $105,000 | $70 | 30 |
Match score weights: distance 35% · size 25% · config 20% · recency 20%. Top-matched comps best support the ARV.
Projected returns pro-forma
2.83% appreciation · 3.0% rent growth · sell at horizon
- IRR
- 36.3%
- Equity multiple
- 3.03×
- Total profit
- $36,927
- Equity at exit
- $28,601
- IRR
- 36.5%
- Equity multiple
- 5.98×
- Total profit
- $90,564
- Equity at exit
- $43,597
Cash invested: $18,200 (down + closing). Projections, not guarantees.
Landlord ↔ Tenant lean methodology
- Overall (STATE)
- 83 Strongly Landlord-Friendly
- State Iowa
- 83 Strongly Landlord-Friendly · R+6
- County
- — inherits STATE
- City
- — inherits STATE
ZIP-level market 50601
- Home prices YoY
- 1.9%
- Active inventory
- 29
- Price-to-rent
- 4.9×
Monthly cashflow live
- Estimated rent
- $1,098 medium interval (Pro) →
- Mortgage (P&I)
- −$341
- Tax from tax record
- −$33 /mo · $394/yr
- Insurance
- −$27
- HOA
- −$0
- Vacancy / Maint / Mgmt
- −$230
- Net cashflow
- $466
Break-even live
UW: 25.0% down · 7.5% · 30yr · 1.5% tax · 5.0% vac · 8.0% maint · 8.0% mgmt
Financing live
Cash to close
- Down payment
- $16,250
- Closing costs
- $1,950
- Reserves months
- —
- Total cash needed
- —
Loan-product check · same deal, 3 products live
Conventional
25% down · 7.5% · 30yr
- Down + closing
- —
- Monthly P&I
- —
- Monthly cashflow
- —
- DSCR
- —
- Eligible?
- —
Personal DTI + credit; lowest rate.
DSCR
20% down · 8.5% · 30yr
- Down + closing
- —
- Monthly P&I
- —
- Monthly cashflow
- —
- DSCR
- —
- Eligible?
- —
No personal income docs; deal must DSCR.
Hard money
10% down · 12.0% · 12mo
- Down + closing
- —
- Monthly P&I
- —
- Monthly cashflow
- —
- DSCR
- —
- Eligible?
- —
Short-term bridge; refi at stabilization.
Listing history 9 events
-
2026-05-22status Pending
-
2026-04-20historical Active Under Contract
-
2026-04-10status Active
-
2026-03-31historical Active Under Contract
-
2026-03-12$65,000 Active
-
2025-09-16status Active
-
2025-08-27historical Active Under Contract
-
2025-06-13price $70,000
-
2025-05-19$75,000 Active
ⓘ Source: listings_history table (triggers on properties + properties_extension) + one-shot
backfill from property_details.listing_events for pre-trigger history.
Tax reassessment forecast IA · Partial reset (capped growth)
- Current annual tax
- $394 · $33/mo
- Projected year-2 tax
- $707 · $59/mo
- Expected delta
- +$313/yr (+$26/mo · 79.5%)
ⓘ Screening estimate from a state-policy table — verify with the county assessor before closing.
Climate risk First Street
- Flood 1/10 Low FEMA zone X (unshaded) · 0% chance over 30 yrs
- Wildfire 3/10 Moderate
- Heat 2/10 Low 7 d/yr ≥102°F today · 15 d/yr by 30 yrs out
- Wind 2/10 Low
- Air quality 1/10 Low 0 unhealthy d/yr today · 0 by 30 yrs out
Nearby sold comps map
Loading sold comps map…
Walkable amenities ~0.75 mi
Loading nearby amenities…
Taxation est. · year 1
- Rental income
- $13,171
- − Mortgage interest
- −$3,641
- − Property taxes
- −$394
- − Insurance
- −$325
- − Repairs & maintenance
- −$1,054
- − Management
- −$1,054
- − Depreciation
- −$1,891
- Taxable income
- $4,813
- Est. tax owed @ 24.0%
- −$1,155
- After-tax cash flow
- $4,441/yr
For passive investors: Depreciation is non-cash, so a rental often shows a tax loss while cash-flowing — sheltering income. Rental losses are passive: they offset passive income freely, and up to $25,000/yr can offset ordinary (W-2) income if you actively participate and your MAGI is under $100k (phasing out to $0 by $150k); unused losses carry forward. On sale, claimed depreciation is recaptured at up to 25%, and gains may owe capital-gains tax (a 1031 exchange can defer both). Figures are a year-1 estimate at your 24.0% rate — not tax advice; consult a CPA.
Schools (NCES district)
- District
- Agwsr Community School District
- NCES district ID
- 1903060
- Math proficiency
- 60% ▼ -9.00%
- Reading proficiency
- 69% ▼ -1.00%
- Median HH income
- $51,863
- Composite
- 54.95/100
- National rank
- #1304
- State rank
- #198 of 289 in IA
Livability — Ackley
- Score
- 70/100
- State rank
- #377
- US rank
- #7968
Category grades
Schools grade is shown separately in the Schools card above.
Census & demographics
- Census place
- Ackley, IA
- Population (ZIP)
- 2,377
Population outlook (Hardin County) Hauer SSP2
- Today (2025)
- 17,474 people
- By 2030
- 17,369 · -0.6%
- By 2040
- 17,018 · -2.6%
- By 2050
- 16,454 · -5.8%
- By 2075
- 14,665 · -16.1%
- By 2100
- 12,404 · -29.0%
Race, ethnicity, and origin ACS 2023
- Neighborhood character
- Predominantly White (90%)
- Race & ethnicity
- White 90% Hispanic / Latino 8% Two or more races 4%
- Hispanic origin (detail)
- Mexican 8%
- Common ancestry
- Portuguese 4% Iranian 3% Slovak 2%
- Foreign-born
- 5% · Canada, South Korea
- Languages at home
- 93% English-only · Spanish 7%
Political lean MEDSL · Hardin
- 2024 margin
- Solid R (+38.4) · D 30.3% · R 68.7% · Other 1.1%
- 2008→2024 swing
- -39.3pp toward R · 2008: 0.9pp · 2024: -38.4pp
- All cycles
- 2024: R+38.4 2020: R+32.0 2016: R+29.2 2012: R+7.1 2008: D+0.9
Not yet ingested
- Civics
- —
Market trends
- HPI YoY
- ▲ 2.83%
- Current HPI
- 154.031
- Rent YoY
- —
- Metro
- —
- State GDP YoY
- ▲ 2.48%
- F500 in state
- 4
Industry mix (Fortune 500 HQ in IA)
| Industry | F500 HQs | Revenue |
|---|---|---|
| Financial Services | 1 | $16B |
|
||
| Retail / Convenience | 1 | $15B |
|
||
Price history
-13.3% since first listed9 events — show timeline
- 2026-05-22 Pending — IAR
- 2026-04-20 Contingent — IAR
- 2026-04-10 Relisted — IAR
- 2026-03-31 Contingent — IAR
- 2026-03-12 Listed $65,000 IAR
- 2025-09-16 Relisted — IAR
- 2025-08-27 Contingent — IAR
- 2025-06-13 Price Changed $70,000 IAR
- 2025-05-19 Listed $75,000 IAR
Property tax history
+3.3%/yrLatest (2025): $394 · -9.6% YoY. Source: county tax records.
Cash-flow waterfall
monthlySold comps — $/sqft
last 12 mo · ≤1 miLoading sold comps…