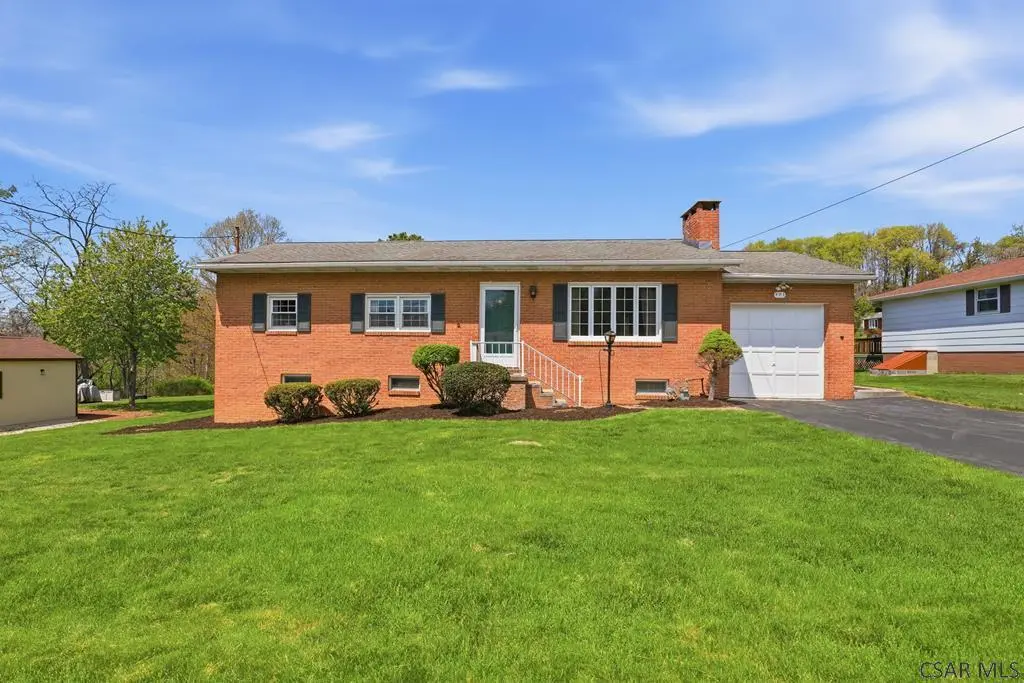
403 Walters Ave · Geistown, PA
Flood risk 1/10 · Minimal
- FEMA flood zone
- X (unshaded)
- Chance of flooding over 30 yrs
- 0.0%
- Est. flood insurance / yr
- $473 – $860
Fire risk 1/10 · Minimal
- Est. fire insurance / yr
- $511 – $949
Heat risk 3/10 · Minor
- Hot days now (above 91°F)
- 7 days/yr
- Hot days in 30 yrs
- 17 days/yr
Wind risk 2/10 · Minimal
- Chance of severe wind over 30 yrs
- —
Air-quality risk 2/10 · Minimal
- Unhealthy air days now
- 1 days/yr
- Unhealthy air days in 30 yrs
- 2 days/yr
Risk factors via First Street. Map © Google.
Why this score? — see what drove the C grade
The composite is a weighted blend of 9 inputs, each scored 0–100. Each bar is that input's sub-score; the figure is the points it added to the 100-point composite (weight × sub-score).
- Cash flow +19.8/30.0
- ARV discount +14.3/15.0
- DSCR +6.3/10.0
- 1% rule +5.4/10.0
- Livability +3.9/5.0
- Rent growth +2.5/5.0
- Condition / age +2.5/5.0
- Schools +1.3/10.0
- Appreciation +0.0/10.0
$139,900
🖨 Deal sheet (PDF) 📄 Offer letter ✓ Due diligence
Listing remarks
Well maintained 3 Bedroom, 2 Bathroom brick ranch home in Geistown Boro - Greater Johnstown School District! The main floor offers a Living Room with fireplace, eat-in Kitchen with appliances included and a sliding door to the covered back porch, three Bedrooms and a full Bathroom. You will love the the basement that includes a cozy Family Room, Laundry Room, second Bathroom and workshop area. Dual pane windows. Attached one car garage. Beautiful level lot! Covered back porch and patio area. Shed. Call today to schedule your tour!
Key facts
- Laundry room
- Brick ranch home
- Cozy family room
Tags
Neighborhood map
What this means for you Summary
Snapshot
- This is a 3-bed/2.0-bath single-family listed at $140k.
Deal economics
- At list price, monthly cash flow is $166 ($2k/yr) — positive.
- The deal already cash-flows at list — no discount required.
- Meets the 1% rule at list price ($1k rent vs $140k).
Location & tenants
- Location reads 77/100 on livability (#332 in PA, #2,915 nationally) — a middle-class / working-renter tenant base. Strengths: crime A+, cost of living A+, housing A+; Watch: amenities F, commute F.
- Greater Johnstown SD (urban): math 9% / reading 25% proficiency, ranked #509 of 539 in PA (top 94%) — low school quality limits family demand, transient renter base, plan for 1-2y turnover; 80% free/reduced lunch — lower-income household profile, screen leases tightly.
- Market conditions: 50 active listings in the ZIP; 64 units permitted in Cambria County in 2024 (0 in 5+ unit buildings).
Forward outlook
- Local home prices are declining (-3.0%/yr); year-one equity from $967 of loan paydown is wiped out by about $4k of value loss. Plan a longer hold.
- Cambria County population projected at -28% by 2050 — secular population decline; favor cash flow + early exit over multi-decade hold.
Negotiation context
- Only 6 days on market — expect competitive offers; lowballing is unlikely to land.
Questions for the listing agent
- Built in 1977 — when were the roof, HVAC, electrical panel, plumbing, and water heater last replaced?
- Is there a deadline driving the sale (1031 exchange, divorce, estate, relocation)? That informs how much negotiation room exists.
- What's the average days-on-market for RENTAL listings here right now (not sales)? A rising rental-DOM trend means longer vacancies and softer asking-rent achievability than the comps imply.
- What's the recent tenant-quality profile in this submarket — average credit score on applications, eviction rate, late-payment / NSF rate, and stable-employment percentage? A property-management company in the area should have these aggregated.
- How much new for-sale + rental construction is in the pipeline within 1–3 miles? Heavy new supply typically softens prices + rents 12–24 months out; constrained supply supports both.
Investment metrics
- 1% rule
- 1.04% ✓
- Cap rate
- 7.72%
- Cash-on-cash
- 5.08%
- DSCR
- 1.23
- GRM
- 8.0
CMA / ARV
- ARV (on-the-fly)
- $164,736
- Comps found
- 12
Show comp detail 12 sales within ~0.75 mi
| Address | Dist | Beds/Ba | Sqft | Sold | Price | $/sf | Match |
|---|---|---|---|---|---|---|---|
| 403 Walters Ave | 0.00mi | 3/2.0 | 1,716 (0%) | 1mo | $164,000 | $96 | 99 |
| 411 Walters Ave | 0.06mi | 3/2.0 | 1,582 (-8%) | 22mo | $190,000 | $120 | 66 |
| 1917 Eugene St | 0.67mi | 3/2.0 | 1,731 (+1%) | 11mo | $150,000 | $87 | 58 |
| 93 Penrod St | 0.48mi | 3/1.5 | 1,598 (-7%) | 9mo | $161,000 | $101 | 56 |
| 306 Penrod St | 0.48mi | 3/2.0 | 1,660 (-3%) | 20mo | $166,750 | $100 | 55 |
| 1906 Florida Ave | 0.50mi | 3/2.0 | 1,475 (-14%) | 9mo | $139,900 | $95 | 46 |
| 1800 Florida Ave | 0.56mi | 3/1.5 | 1,576 (-8%) | 18mo | $75,100 | $48 | 44 |
| 217 W Oakmont Blvd | 0.55mi | 4/2.0 (+1) | 1,816 (+6%) | 20mo | $166,000 | $91 | 43 |
| 93 Schrader Ave | 0.44mi | 3/1.5 | 1,537 (-10%) | 21mo | $135,000 | $88 | 43 |
| 1727 Ringling Ave | 0.68mi | 2/1.0 (-1) | 1,632 (-5%) | 11mo | $165,000 | $101 | 42 |
| 206 Penrod St | 0.46mi | 3/2.0 | 1,486 (-13%) | 18mo | $194,999 | $131 | 41 |
| 1900 Eugene St | 0.74mi | 3/2.5 | 1,502 (-12%) | 23mo | $139,500 | $93 | 24 |
Match score weights: distance 35% · size 25% · config 20% · recency 20%. Top-matched comps best support the ARV.
Projected returns pro-forma
-3.0% appreciation · 3.0% rent growth · sell at horizon
- IRR
- -8.4%
- Equity multiple
- 0.69×
- Total profit
- $-12,072
- Equity at exit
- $20,860
- IRR
- 1.2%
- Equity multiple
- 1.08×
- Total profit
- $3,227
- Equity at exit
- $12,096
Cash invested: $39,172 (down + closing). Projections, not guarantees.
Landlord ↔ Tenant lean methodology
- Overall (STATE)
- 62 Landlord-Friendly
- State Pennsylvania
- 62 Landlord-Friendly · EVEN
- County
- — inherits STATE
- City
- — inherits STATE
ZIP-level market 15904
- Active inventory
- 50
- Price-to-rent
- 8.0×
Monthly cashflow live
- Estimated rent
- $1,457 medium interval (Pro) →
- Mortgage (P&I)
- −$734
- Tax from tax record
- −$194 /mo · $2,323/yr
- Insurance
- −$58
- HOA
- −$0
- Vacancy / Maint / Mgmt
- −$306
- Net cashflow
- $166
Break-even live
Sensitivity live
| Price | -10% $245 | -5% $205 | +0% $166 | +5% $126 | +10% $87 |
|---|---|---|---|---|---|
| Rent | -10% $51 | -5% $108 | +0% $166 | +5% $223 | +10% $281 |
| Rate | -1.0pp $236 | -0.5pp $201 | base $166 | +0.5pp $130 | +1.0pp $93 |
UW: 25.0% down · 7.5% · 30yr · 1.5% tax · 5.0% vac · 8.0% maint · 8.0% mgmt
Financing live
Cash to close
- Down payment
- $34,975
- Closing costs
- $4,197
- Reserves months
- —
- Total cash needed
- —
Loan-product check · same deal, 3 products live
Conventional
25% down · 7.5% · 30yr
- Down + closing
- —
- Monthly P&I
- —
- Monthly cashflow
- —
- DSCR
- —
- Eligible?
- —
Personal DTI + credit; lowest rate.
DSCR
20% down · 8.5% · 30yr
- Down + closing
- —
- Monthly P&I
- —
- Monthly cashflow
- —
- DSCR
- —
- Eligible?
- —
No personal income docs; deal must DSCR.
Hard money
10% down · 12.0% · 12mo
- Down + closing
- —
- Monthly P&I
- —
- Monthly cashflow
- —
- DSCR
- —
- Eligible?
- —
Short-term bridge; refi at stabilization.
Listing history 2 events
-
2026-04-28status Pending
-
2026-04-22$139,900 Active
ⓘ Source: listings_history table (triggers on properties + properties_extension) + one-shot
backfill from property_details.listing_events for pre-trigger history.
Tax reassessment forecast PA · Partial reset (capped growth)
- Current annual tax
- $2,323 · $194/mo
- Projected year-2 tax
- $2,323 · $194/mo
- Expected delta
- $0/yr ($0/mo · 0.0%)
ⓘ Screening estimate from a state-policy table — verify with the county assessor before closing.
Climate risk First Street
- Flood 1/10 Low FEMA zone X (unshaded) · 0% chance over 30 yrs
- Wildfire 1/10 Low
- Heat 3/10 Moderate 7 d/yr ≥91°F today · 17 d/yr by 30 yrs out
- Wind 2/10 Low
- Air quality 2/10 Low 1 unhealthy d/yr today · 2 by 30 yrs out
Nearby sold comps map
Loading sold comps map…
Walkable amenities ~0.75 mi
Loading nearby amenities…
Taxation est. · year 1
- Rental income
- $17,490
- − Mortgage interest
- −$7,837
- − Property taxes
- −$2,323
- − Insurance
- −$700
- − Repairs & maintenance
- −$1,399
- − Management
- −$1,399
- − Depreciation
- −$4,070
- Taxable loss
- −$238
- Est. tax savings @ 24.0%
- +$57
- After-tax cash flow
- $2,047/yr
For passive investors: Depreciation is non-cash, so a rental often shows a tax loss while cash-flowing — sheltering income. Rental losses are passive: they offset passive income freely, and up to $25,000/yr can offset ordinary (W-2) income if you actively participate and your MAGI is under $100k (phasing out to $0 by $150k); unused losses carry forward. On sale, claimed depreciation is recaptured at up to 25%, and gains may owe capital-gains tax (a 1031 exchange can defer both). Figures are a year-1 estimate at your 24.0% rate — not tax advice; consult a CPA.
Schools (NCES district)
- District
- Greater Johnstown SD
- NCES district ID
- 4210950
- Math proficiency
- 9% ▼ -6.00%
- Reading proficiency
- 25% ▼ -6.00%
- Median HH income
- $27,890
- Composite
- 13.25/100
- National rank
- #9550
- State rank
- #509 of 539 in PA
Livability — Geistown
- Score
- 77/100
- State rank
- #332
- US rank
- #2915
Category grades
Schools grade is shown separately in the Schools card above.
Census & demographics
- Census place
- Geistown, PA
- Population (ZIP)
- 16,283
Population outlook (Cambria County) Hauer SSP2
- Today (2025)
- 122,754 people
- By 2030
- 115,827 · -5.6%
- By 2040
- 101,309 · -17.5%
- By 2050
- 88,379 · -28.0%
- By 2075
- 65,237 · -46.9%
- By 2100
- 46,909 · -61.8%
Race, ethnicity, and origin ACS 2023
- Neighborhood character
- Predominantly White (93%)
- Race & ethnicity
- White 93% Two or more races 3% Hispanic / Latino 2% Black 2% Asian 1%
- Common ancestry
- Romanian 10% Slovak 2% Lithuanian 2%
- Foreign-born
- 2% · Canada
- Languages at home
- 97% English-only · Spanish 1% Other Indo-European 1%
Political lean MEDSL · Cambria
- 2024 margin
- Solid R (+39.7) · D 29.8% · R 69.5%
- 2008→2024 swing
- -40.4pp toward R · 2008: 0.7pp · 2024: -39.7pp
- All cycles
- 2024: R+39.7 2020: R+37.3 2016: R+37.8 2012: R+17.8 2008: D+0.7
Not yet ingested
- Civics
- —
Market trends
- HPI YoY
- ▼ -96.96%
- Current HPI
- 151.6715
- Rent YoY
- —
- Metro
- —
- State GDP YoY
- ▲ 1.68%
- F500 in state
- 34
Industry mix (Fortune 500 HQ in PA)
| Industry | F500 HQs | Revenue |
|---|---|---|
| Healthcare | 2 | $309B |
|
||
| Insurance | 2 | $27B |
|
||
| Telecommunications / Media | 1 | $124B |
|
||
| Industrial Distribution | 1 | $22B |
|
||
| Financial Services | 1 | $20B |
|
||
| Chemicals / Materials | 1 | $18B |
|
||
Price history
2 events — show timeline
- 2026-04-28 Pending — CSMLS
- 2026-04-22 Listed $139,900 CSMLS
Property tax history
+0.4%/yrLatest (2026): $2,323 · +0.0% YoY. Source: county tax records.
Cash-flow waterfall
monthlySold comps — $/sqft
last 12 mo · ≤1 miLoading sold comps…