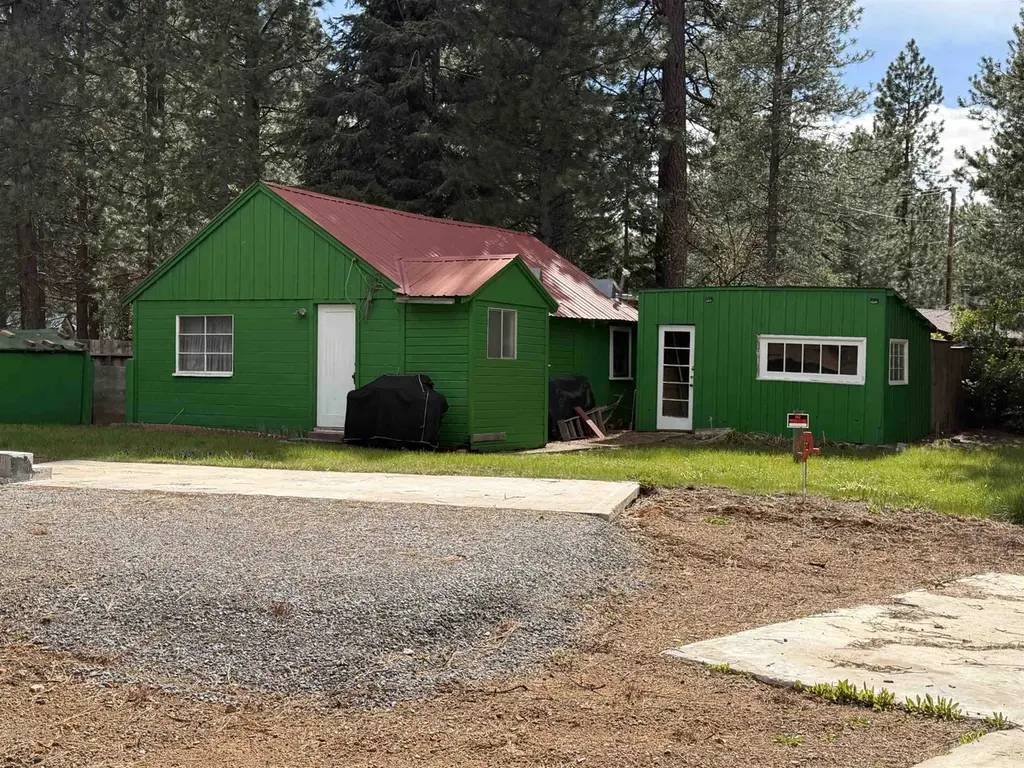
210 & 212 Ninth St · Westwood, CA
Flood risk 1/10 · Minimal
- FEMA flood zone
- X (unshaded)
- Chance of flooding over 30 yrs
- 0.0%
- Est. flood insurance / yr
- $507 – $1,088
Fire risk 7/10 · Major
- Est. fire insurance / yr
- $659 – $1,223
Heat risk 3/10 · Minor
- Hot days now (above 87°F)
- 7 days/yr
- Hot days in 30 yrs
- 17 days/yr
Wind risk 1/10 · Minimal
- Chance of severe wind over 30 yrs
- —
Air-quality risk 10/10 · Severe
- Unhealthy air days now
- 24 days/yr
- Unhealthy air days in 30 yrs
- 26 days/yr
Risk factors via First Street. Map © Google.
Why this score? — see what drove the B grade
The composite is a weighted blend of 9 inputs, each scored 0–100. Each bar is that input's sub-score; the figure is the points it added to the 100-point composite (weight × sub-score).
- Cash flow +30.0/30.0
- 1% rule +10.0/10.0
- DSCR +10.0/10.0
- ARV discount +7.5/15.0
- Appreciation +5.7/10.0
- Livability +3.1/5.0
- Schools +3.0/10.0
- Rent growth +2.5/5.0
- Condition / age +2.2/5.0
$78,000
🖨 Deal sheet 📄 Offer letter ✓ Due diligence
Listing remarks
Two parcels totaling . 56 acres providing ample space for outdoor enjoyment or potential expansion convenient access to Highway 36 makes it easy to reach nearby Lake Almanor just a short drive away, perfect for water activities like fishing boating, swimming and water skiing. Walker lake is also in close proximity for additional adventure, such as hiking, biking kayaking, allowing you to explore the serene surroundings.
Key facts
- Water activities
- Convenient access
- Nearby lake almanor
Tags
Property features AI
Exterior
- Parking: Gravel parking; Off-street parking; On-street parking
- Utilities: Public sewer available; Water available; Sewer available
- Home design: Single-family residence; One story; Residential property
- Construction: Frame construction with wood siding; Metal roof; Other foundation details; Built on one level
- Exterior features: Level lot; Unimproved road frontage and road surface; Shed(s); Wood fencing (and some areas without fencing); Has a view
Interior
- Flooring: Carpet; Hardwood
- Bathrooms: One full bathroom
- Heating & cooling: No heating; No cooling
- Interior features: Other interior features; Carpet and hardwood flooring; No fireplace; No basement
Neighborhood map
What this means for you Summary
Snapshot
- This is a 1-bed/1.0-bath single-family listed at $78k. Condition is rated fair.
Deal economics
- At list price, monthly cash flow is $607 ($7k/yr) — positive.
- The deal already cash-flows at list — no discount required.
- Meets the 1% rule at list price ($1k rent vs $78k).
- Recommended offer: $76k (3.0% below list) — sets the bar for market timing.
Location & tenants
- Location reads 61/100 on livability (#547 in CA) — a middle-class / working-renter tenant base. Strengths: housing A+, crime B; Watch: amenities F, commute F, employment D-.
- Westwood Unified (rural): math 30% / reading 35% proficiency, ranked #995 of 1,400 in CA (top 71%) — families likely to look elsewhere, expect single-tenant / working-renter base with shorter leases.
- Market conditions: 240 active listings in the ZIP; 6 units permitted in Lassen County in 2024 (0 in 5+ unit buildings).
Forward outlook
- In year one you build about $2k of equity ($539 loan paydown + $1k appreciation (1.4% local appreciation)).
- Lassen County population projected at -14% by 2050 — secular population decline; favor cash flow + early exit over multi-decade hold.
- At projected returns (1.4% appreciation + 3.0% rent growth), your $22k cash investment doubles in ~3 years — after that, you're playing with house money.
Negotiation context
- It's been on market 51 days — a 3% lower offer ($76k) is reasonable based on typical stale-listing flexibility.
Risks & watch-outs
- Climate carrying-cost: major wildfire risk — expect insurance premiums to compound above CPI over the hold.
Questions for the listing agent
- It's been on market 51 days. Have you received any prior offers? Is the seller open to a 3% concession, seller financing, or rate buy-down credit?
- Have any recent inspections been done? Can we get a copy of the seller's disclosures and any deferred-maintenance estimates?
- Is there a deadline driving the sale (1031 exchange, divorce, estate, relocation)? That informs how much negotiation room exists.
- What's the average days-on-market for RENTAL listings here right now (not sales)? A rising rental-DOM trend means longer vacancies and softer asking-rent achievability than the comps imply.
- What's the recent tenant-quality profile in this submarket — average credit score on applications, eviction rate, late-payment / NSF rate, and stable-employment percentage? A property-management company in the area should have these aggregated.
- How much new for-sale + rental construction is in the pipeline within 1–3 miles? Heavy new supply typically softens prices + rents 12–24 months out; constrained supply supports both.
Investment metrics
- 1% rule
- 1.86% ✓
- Cap rate
- 15.63%
- Cash-on-cash
- 33.35%
- DSCR
- 2.48
- GRM
- 4.5
CMA / ARV
No comps found within radius.
Projected returns pro-forma
1.38% appreciation · 3.0% rent growth · sell at horizon
- IRR
- 36.4%
- Equity multiple
- 2.90×
- Total profit
- $41,591
- Equity at exit
- $28,170
- IRR
- 38.2%
- Equity multiple
- 5.70×
- Total profit
- $102,549
- Equity at exit
- $38,658
Cash invested: $21,840 (down + closing). Projections, not guarantees.
Landlord ↔ Tenant lean methodology
- Overall (STATE)
- 18 Strongly Tenant-Friendly
- State California
- 18 Strongly Tenant-Friendly · D+13
- County
- — inherits STATE
- City
- — inherits STATE
ZIP-level market 96137
- Home prices YoY
- 0.9%
- Active inventory
- 240
- Price-to-rent
- 4.5×
Monthly cashflow live
- Estimated rent
- $1,451 medium interval (Pro) →
- Mortgage (P&I)
- −$409
- Tax est. 1.5%
- −$98 /mo · $1,170/yr
- Insurance
- −$32
- HOA
- −$0
- Vacancy / Maint / Mgmt
- −$305
- Net cashflow
- $607
Break-even live
UW: 25.0% down · 7.5% · 30yr · 1.5% tax · 5.0% vac · 8.0% maint · 8.0% mgmt
Financing live
Cash to close
- Down payment
- $19,500
- Closing costs
- $2,340
- Reserves months
- —
- Total cash needed
- —
Loan-product check · same deal, 3 products live
Conventional
25% down · 7.5% · 30yr
- Down + closing
- —
- Monthly P&I
- —
- Monthly cashflow
- —
- DSCR
- —
- Eligible?
- —
Personal DTI + credit; lowest rate.
DSCR
20% down · 8.5% · 30yr
- Down + closing
- —
- Monthly P&I
- —
- Monthly cashflow
- —
- DSCR
- —
- Eligible?
- —
No personal income docs; deal must DSCR.
Hard money
10% down · 12.0% · 12mo
- Down + closing
- —
- Monthly P&I
- —
- Monthly cashflow
- —
- DSCR
- —
- Eligible?
- —
Short-term bridge; refi at stabilization.
Listing history 16 events
-
2026-06-19days on market $78,000 Active 51 DOM
-
2026-06-18days on market $78,000 Active 50 DOM
-
2026-06-17days on market $78,000 Active 49 DOM
-
2026-06-16days on market $78,000 Active 48 DOM
-
2026-06-15days on market $78,000 Active 47 DOM
-
2026-06-14days on market $78,000 Active 45 DOM
-
2026-06-12days on market $78,000 Active 44 DOM
-
2026-06-09days on market $78,000 Active 41 DOM
-
2026-06-08days on market $78,000 Active 40 DOM
-
2026-06-07days on market $78,000 Active 39 DOM
-
2026-06-04days on market $78,000 Active 35 DOM
-
2026-06-02days on market $78,000 Active 34 DOM
-
2026-06-01days on market $78,000 Active 33 DOM
-
2026-05-31days on market $78,000 Active 32 DOM
-
2026-05-31days on market $78,000 Active 31 DOM
-
2026-04-28$78,000 Active
ⓘ Source: listings_history table (triggers on properties + properties_extension) + one-shot
backfill from property_details.listing_events for pre-trigger history.
Climate risk First Street
- Flood 1/10 Low FEMA zone X (unshaded) · 0% chance over 30 yrs
- Wildfire 7/10 Severe
- Heat 3/10 Moderate 7 d/yr ≥87°F today · 17 d/yr by 30 yrs out
- Wind 1/10 Low
- Air quality 10/10 Extreme 24 unhealthy d/yr today · 26 by 30 yrs out
Nearby sold comps map
Loading sold comps map…
Walkable amenities ~0.75 mi
Loading nearby amenities…
Taxation est. · year 1
- Rental income
- $17,409
- − Mortgage interest
- −$4,369
- − Property taxes
- −$1,170
- − Insurance
- −$390
- − Repairs & maintenance
- −$1,393
- − Management
- −$1,393
- − Depreciation
- −$2,269
- Taxable income
- $6,425
- Est. tax owed @ 24.0%
- −$1,542
- After-tax cash flow
- $5,742/yr
For passive investors: Depreciation is non-cash, so a rental often shows a tax loss while cash-flowing — sheltering income. Rental losses are passive: they offset passive income freely, and up to $25,000/yr can offset ordinary (W-2) income if you actively participate and your MAGI is under $100k (phasing out to $0 by $150k); unused losses carry forward. On sale, claimed depreciation is recaptured at up to 25%, and gains may owe capital-gains tax (a 1031 exchange can defer both). Figures are a year-1 estimate at your 24.0% rate — not tax advice; consult a CPA.
Condition & rehab AI · 13 photos
The home requires extensive repairs and maintenance, including roof, exterior siding, flooring, interior walls, landscaping, and HVAC system. These improvements would significantly increase its resale and rental value.
Repairs flagged
- Major roof — The roof appears to be in poor condition, with visible wear and tear.
- Major exterior siding — The siding is peeling and the paint is chipping.
- Major flooring — The flooring in the interior appears to be carpeted and in poor condition.
- Major interior walls/paint — The interior walls and paint appear to be in poor condition.
- Major landscaping — The landscaping is sparse and the curb appeal is low.
- Major fencing — The fencing appears to be in poor condition and may need repair or replacement.
- Major HVAC system — The HVAC system appears to be old and may need replacement.
Value-add opportunities
- Both painting the exterior and interior — Painting the exterior and interior can improve the curb appeal and the overall condition of the home.
- Both landscaping and curb appeal improvements — Landscaping and curb appeal improvements can enhance the home's appearance and increase its value.
- Both HVAC system replacement — Replacing the HVAC system can improve the comfort and energy efficiency of the home, which can increase its value.
- Both roof repair or replacement — Repairing or replacing the roof can improve the home's structural integrity and increase its value.
- Both exterior siding and paint repair — Repairing or replacing the exterior siding and paint can improve the home's curb appeal and increase its value.
- Both flooring replacement — Replacing the flooring can improve the home's condition and increase its value.
- Both interior wall and paint repair — Repairing or repainting the interior walls and paint can improve the home's condition and increase its value.
- Both fencing repair or replacement — Repairing or replacing the fencing can improve the home's curb appeal and increase its value.
Renovation cost estimate screening
| Repair item | Severity | Est. cost |
|---|---|---|
| roof · The roof appears to be in poor condition, with visible wear and tear. | Major | $15,000–50,000 |
| exterior siding · The siding is peeling and the paint is chipping. | Major | $15,000–50,000 |
| flooring · The flooring in the interior appears to be carpeted and in poor condition. | Major | $15,000–50,000 |
| interior walls/paint · The interior walls and paint appear to be in poor condition. | Major | $15,000–50,000 |
| landscaping · The landscaping is sparse and the curb appeal is low. | Major | $15,000–50,000 |
| fencing · The fencing appears to be in poor condition and may need repair or replacement. | Major | $15,000–50,000 |
| HVAC system · The HVAC system appears to be old and may need replacement. | Major | $15,000–50,000 |
| Total estimated repair cost · 7 items | $105,000–350,000 |
Value-add ROI direction
- Both painting the exterior and interior — Painting the exterior and interior can improve the curb appeal and the overall condition of the home. ↑
- Both landscaping and curb appeal improvements — Landscaping and curb appeal improvements can enhance the home's appearance and increase its value. ↑
- Both HVAC system replacement — Replacing the HVAC system can improve the comfort and energy efficiency of the home, which can increase its value. ↑
- Both roof repair or replacement — Repairing or replacing the roof can improve the home's structural integrity and increase its value. ↑
- Both exterior siding and paint repair — Repairing or replacing the exterior siding and paint can improve the home's curb appeal and increase its value. ↑
- Both flooring replacement — Replacing the flooring can improve the home's condition and increase its value. ↑
- Both interior wall and paint repair — Repairing or repainting the interior walls and paint can improve the home's condition and increase its value. ↑
- Both fencing repair or replacement — Repairing or replacing the fencing can improve the home's curb appeal and increase its value. ↑
ⓘ Cost ranges are severity-bucket heuristics (US national rule-of-thumb). Get contractor quotes + a written scope before underwriting a rehab budget.
Schools (NCES district)
- District
- Westwood Unified
- NCES district ID
- 0642300
- Math proficiency
- 30% ▬ 0.00%
- Reading proficiency
- 35% ▼ -10.00%
- Median HH income
- $38,831
- Composite
- 29.93/100
- National rank
- #11664
- State rank
- #995 of 1400 in CA
Livability — Westwood
- Score
- 61/100
- State rank
- #547
- US rank
- #18201
Category grades
Schools grade is shown separately in the Schools card above.
Census & demographics
- Census place
- Westwood, CA
- Population (ZIP)
- 2,717
Population outlook (Lassen County) Hauer SSP2
- Today (2025)
- 27,112 people
- By 2030
- 26,732 · -1.4%
- By 2040
- 25,536 · -5.8%
- By 2050
- 23,262 · -14.2%
- By 2075
- 18,620 · -31.3%
- By 2100
- 14,679 · -45.9%
Race, ethnicity, and origin ACS 2023
- Neighborhood character
- Predominantly White (81%)
- Race & ethnicity
- White 81% Hispanic / Latino 10% Two or more races 8% Native American 4%
- Hispanic origin (detail)
- Mexican 5%
- Common ancestry
- Slovak 4% Lithuanian 3% Italian 2%
- Foreign-born
- 4% · Canada
- Languages at home
- 93% English-only · Spanish 5% Other Indo-European 1%
Political lean MEDSL · Lassen
- 2024 margin
- Solid R (+54.0) · D 21.8% · R 75.8% · Other 2.4%
- 2008→2024 swing
- -19.8pp toward R · 2008: -34.2pp · 2024: -54.0pp
- All cycles
- 2024: R+54.0 2020: R+51.5 2016: R+51.3 2012: R+39.8 2008: R+34.2
Not yet ingested
- Civics
- —
Market trends
- HPI YoY
- ▲ 1.38%
- Current HPI
- 153.1005
- Rent YoY
- —
- Metro
- —
- State GDP YoY
- ▲ 3.21%
- F500 in state
- 116
Industry mix (Fortune 500 HQ in CA)
| Industry | F500 HQs | Revenue |
|---|---|---|
| Technology | 27 | $1,492B |
|
||
| Financial Services | 3 | $174B |
|
||
| Retail | 3 | $44B |
|
||
| Insurance | 3 | $26B |
|
||
| Media / Entertainment | 2 | $115B |
|
||
| Pharmaceuticals / Biotech | 2 | $62B |
|
||
Price history
1 event — show timeline
- 2026-04-28 Listed $78,000 PAR
Cash-flow waterfall
monthlySold comps — $/sqft
last 12 mo · ≤1 miLoading sold comps…