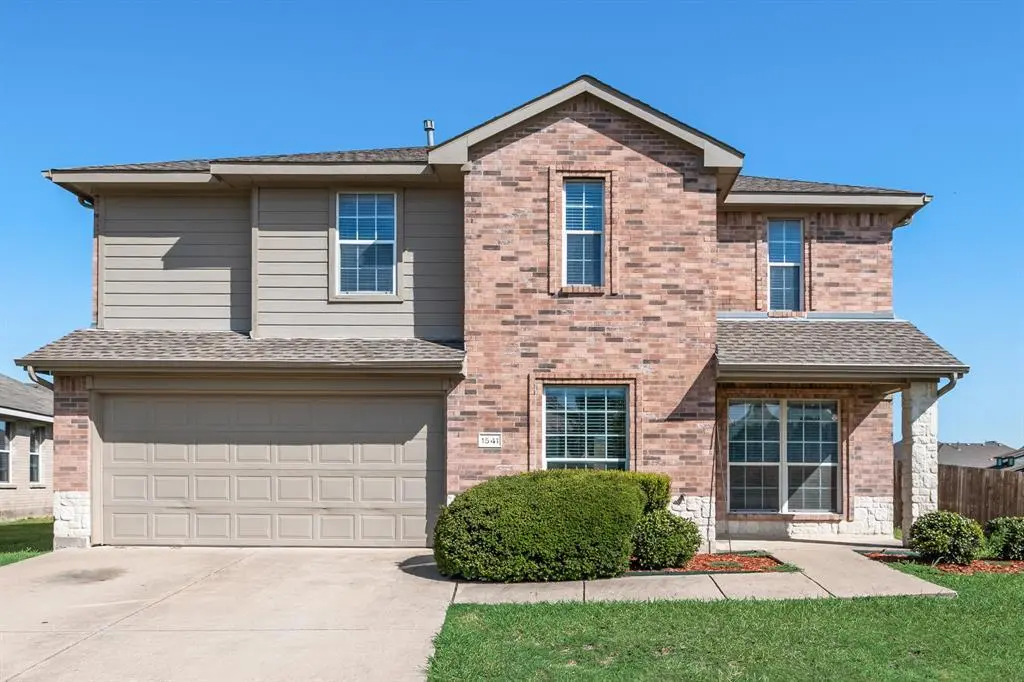
1541 Fairfield Dr · Forney, TX
Flood risk 1/10 · Minimal
- FEMA flood zone
- X (unshaded)
- Chance of flooding over 30 yrs
- 0.0%
- Est. flood insurance / yr
- $507 – $1,088
Fire risk 5/10 · Moderate
- Est. fire insurance / yr
- $1,222 – $2,270
Heat risk 8/10 · Major
- Hot days now (above 110°F)
- 7 days/yr
- Hot days in 30 yrs
- 25 days/yr
Wind risk 6/10 · Moderate
- Chance of severe wind over 30 yrs
- 27.0%
Air-quality risk 2/10 · Minimal
- Unhealthy air days now
- 1 days/yr
- Unhealthy air days in 30 yrs
- 1 days/yr
Risk factors via First Street. Map © Google.
Why this score? — see what drove the D grade
The composite is a weighted blend of 9 inputs, each scored 0–100. Each bar is that input's sub-score; the figure is the points it added to the 100-point composite (weight × sub-score).
- ARV discount +15.0/15.0
- Cash flow +7.8/30.0
- Schools +4.0/10.0
- Livability +3.8/5.0
- 1% rule +3.3/10.0
- Rent growth +2.9/5.0
- Condition / age +2.5/5.0
- DSCR +1.9/10.0
- Appreciation +0.0/10.0
$299,000
🖨 Deal sheet (PDF) 📄 Offer letter ✓ Due diligence
Listing remarks MLS
This beautifully updated corner lot home offers a LARGER lot than most other homes in the neighborhood! This home features a bright and modern interior with fresh paint and luxury vinyl plank flooring in the main areas, complemented by plush carpet in the bedrooms and upstairs retreat. The kitchen has updated cabinetry, sleek granite countertops, and stainless-steel appliances, providing for a light and bright feel. Enjoy multiple spacious living areas, ideal for relaxation or hosting guests. The bedrooms are generously sized with ceiling fans and walk in closets! The primary suite includes a private bath with a large walk-in shower and a dual-sink vanity. You'll love the oversized laundry room with built-in shelving and hanging space and additional living on the second floor! Do not miss the expansive fully fenced backyard! All of this in a well-established neighborhood with nearby community amenities that include a community pool and playground!
Key facts
- Larger lot
- Updated cabinetry
- Granite countertops
Tags
Neighborhood map
What this means for you Summary
Snapshot
- This is a 3-bed/2.5-bath single-family listed at $299k.
Deal economics
- At list price, monthly cash flow is $-330 ($-4k/yr) — negative.
- To cash-flow at today's rent, offer at most $241k (19.5% below list).
- To meet the 1% rule (rent ≥ 1% of price), the offer needs to be $248k (17.1% below list).
- Recommended offer: $241k (19.5% below list) — sets the bar for cash-flow.
- Cap rate 5.0% vs local median 4.1% in Forney — meaningfully above typical; check what's discounted (condition, days-on-market, listing class) to confirm the premium yield is real.
Location & tenants
- Location reads 76/100 on livability (#98 in TX, #3,339 nationally) — a middle-class / working-renter tenant base. Strengths: crime A+, employment A+, cost of living A+; Watch: amenities C-, commute F.
- Forney ISD (rural): math 41% / reading 44% proficiency, ranked #234 of 826 in TX (top 28%) — families likely to look elsewhere, expect single-tenant / working-renter base with shorter leases.
- Zoned schools: Crosby El (math 37% / reading 36%, grade F, #1,883 of 4,322 statewide, top 44%, 682 students, 59% FRL); Brown Middle (math 29% / reading 39%, grade F, #892 of 1,662 statewide, top 55%, 673 students, 56% FRL); North Forney H S (math 32% / reading 45%, grade F, #866 of 1,632 statewide, top 54%, 2,502 students, 49% FRL) — zoned schools average 55% FRL vs 26% district-wide (28 pts higher); higher-poverty schools than district average — tighter screening recommended.
- Market conditions: Rents rising (+1.4%/yr); 2200 active listings in the ZIP; 40 comparable units currently listed for rent nearby; rentals at typical pace (median 22d on market — plan ~3-4 weeks tenant-placement turnaround); solid renter incomes; 1,747 units permitted in Kaufman County in 2024 (180 in 5+ unit buildings).
Forward outlook
- Local home prices are declining (-3.0%/yr); year-one equity from $2k of loan paydown is wiped out by about $9k of value loss. Plan a longer hold.
- Kaufman County population projected at +43% by 2050 — long-run rental-demand tailwind backs the buy-and-hold thesis.
Negotiation context
- It's been on market 116 days — a 9% lower offer ($272k) is reasonable based on typical stale-listing flexibility.
- 8 sale attempts since 14y ago with the ask held roughly flat each time — persistent listings suggest the price (not the market) is what's stuck; bring a comps-based counter.
Risks & watch-outs
- Climate carrying-cost: major wind risk, 27% chance of damaging wind over 30y; moderate wildfire risk; extreme-heat days projected 7→25/yr by 2055 (HVAC capex compounding) — expect insurance premiums to compound above CPI over the hold.
Questions for the listing agent
- What do current leases actually rent for vs. the listed asking? Can we see a recent rent roll and the last 12 months of T-12 income?
- It's been on market 116 days. Have you received any prior offers? Is the seller open to a 20% concession, seller financing, or rate buy-down credit?
- What does the HOA fee cover, when was the last increase, and are there any pending special assessments or reserve-fund shortfalls?
- Why hasn't it sold? Are there any deal-killer items the seller is aware of (foundation, flood, title, zoning, code violations)?
- Is there a deadline driving the sale (1031 exchange, divorce, estate, relocation)? That informs how much negotiation room exists.
- Schools are B-rated — typically a magnet for longer-tenancy family renters. What's the average tenant stay here, and is there a school-zone premium baked into asking?
- The area grade is low — what's the realistic commute time and amenity access for the typical tenant pool here? Any planned neighborhood developments (good or bad) we should know about?
- What's the average days-on-market for RENTAL listings here right now (not sales)? A rising rental-DOM trend means longer vacancies and softer asking-rent achievability than the comps imply.
- What's the recent tenant-quality profile in this submarket — average credit score on applications, eviction rate, late-payment / NSF rate, and stable-employment percentage? A property-management company in the area should have these aggregated.
- How much new for-sale + rental construction is in the pipeline within 1–3 miles? Heavy new supply typically softens prices + rents 12–24 months out; constrained supply supports both.
Investment metrics
- 1% rule
- 0.83% ✗
- Cap rate
- 4.97%
- Cash-on-cash
- -4.73%
- DSCR
- 0.79
- GRM
- 10.0
CMA / ARV
- ARV (median comp)
- $382,351
- List price
- $299,000
- Delta
- -21.80%
- Verdict
- UNDERPRICED
- Comps
- 20 within 1.0 mi
Show comp detail 12 sales within ~0.75 mi
| Address | Dist | Beds/Ba | Sqft | Sold | Price | $/sf | Match |
|---|---|---|---|---|---|---|---|
| 605 Marlee Dr | 0.23mi | 3/2.0 | 2,054 (-9%) | 2mo | $300,000 | $146 | 71 |
| 534 Tuscany Dr | 0.15mi | 4/2.0 (+1) | 2,069 (-8%) | 2mo | $344,989 | $167 | 70 |
| 1913 Flaxen Dr | 0.41mi | 4/2.5 (+1) | 2,194 (-3%) | 1mo | $369,000 | $168 | 70 |
| 1210 Haggetts Pond Rd | 0.24mi | 4/2.0 (+1) | 2,062 (-9%) | 1mo | $300,999 | $146 | 66 |
| 1106 Redcoat Dr | 0.44mi | 4/2.5 (+1) | 2,389 (+6%) | 2mo | $329,090 | $138 | 63 |
| 1514 Flannagan Pond Rd | 0.39mi | 3/2.0 | 2,042 (-10%) | 3mo | $359,970 | $176 | 62 |
| 2210 Walden Pond Blvd | 0.49mi | 4/3.0 (+1) | 2,370 (+5%) | 2mo | $399,970 | $169 | 60 |
| 2103 Martins Pond Rd | 0.45mi | 4/2.0 (+1) | 2,044 (-10%) | 1mo | $275,000 | $135 | 55 |
| 104 Acadia Ln | 0.47mi | 4/2.0 (+1) | 1,996 (-12%) | 1mo | $294,900 | $148 | 51 |
| 2009 Brackett Pond Rd | 0.40mi | 4/2.0 (+1) | 1,952 (-14%) | 1mo | $306,949 | $157 | 50 |
| 221 Wolf Dr | 0.64mi | 4/2.5 (+1) | 2,510 (+11%) | 1mo | $320,000 | $127 | 46 |
| 124 Antler Trl | 0.62mi | 4/2.0 (+1) | 1,994 (-12%) | 1mo | $300,000 | $150 | 44 |
Match score weights: distance 35% · size 25% · config 20% · recency 20%. Top-matched comps best support the ARV.
Projected returns pro-forma
-3.0% appreciation · 1.42% rent growth · sell at horizon
- IRR
- -26.2%
- Equity multiple
- 0.13×
- Total profit
- $-73,194
- Equity at exit
- $44,582
- IRR
- -30.0%
- Equity multiple
- -0.26×
- Total profit
- $-105,543
- Equity at exit
- $25,852
Cash invested: $83,720 (down + closing). Projections, not guarantees.
Landlord ↔ Tenant lean methodology
- Overall (STATE)
- 87 Strongly Landlord-Friendly
- State Texas
- 87 Strongly Landlord-Friendly · R+5
- County
- — inherits STATE
- City
- — inherits STATE
ZIP-level market 75126
- Rents YoY
- 1.4%
- Active inventory
- 2200
- Price-to-rent
- 10.0×
Monthly cashflow live
- Estimated rent
- $2,479 high interval (Pro) →
- Mortgage (P&I)
- −$1,568
- Tax from tax record
- −$569 /mo · $6,833/yr
- Insurance
- −$125
- HOA
- −$27
- Vacancy / Maint / Mgmt
- −$521
- Net cashflow
- $-330
Break-even live
Sensitivity live
| Price | -10% $-161 | -5% $-246 | +0% $-330 | +5% $-415 | +10% $-500 |
|---|---|---|---|---|---|
| Rent | -10% $-526 | -5% $-428 | +0% $-330 | +5% $-232 | +10% $-134 |
| Rate | -1.0pp $-180 | -0.5pp $-254 | base $-330 | +0.5pp $-408 | +1.0pp $-487 |
UW: 25.0% down · 7.5% · 30yr · 1.5% tax · 5.0% vac · 8.0% maint · 8.0% mgmt
Financing live
Cash to close
- Down payment
- $74,750
- Closing costs
- $8,970
- Reserves months
- —
- Total cash needed
- —
Loan-product check · same deal, 3 products live
Conventional
25% down · 7.5% · 30yr
- Down + closing
- —
- Monthly P&I
- —
- Monthly cashflow
- —
- DSCR
- —
- Eligible?
- —
Personal DTI + credit; lowest rate.
DSCR
20% down · 8.5% · 30yr
- Down + closing
- —
- Monthly P&I
- —
- Monthly cashflow
- —
- DSCR
- —
- Eligible?
- —
No personal income docs; deal must DSCR.
Hard money
10% down · 12.0% · 12mo
- Down + closing
- —
- Monthly P&I
- —
- Monthly cashflow
- —
- DSCR
- —
- Eligible?
- —
Short-term bridge; refi at stabilization.
Rent comps 40 comps
| Address | Beds | Baths | Sqft | Rent | $/sqft | DOM | Units | Dist |
|---|---|---|---|---|---|---|---|---|
| 525 Ardsley Ln Forney, TX | 4.0 | 2.0 | 1775 | $2,395 | $1.35 | 0d | 1 | 0.09mi |
| 2127 Pecan Ridge Dr Forney, TX | 3.0 | 2.0 | 2113 | $2,100 | $0.99 | 45d | 1 | 0.13mi |
| 534 Tuscany Dr Forney, TX | 4.0 | 2.0 | 2069 | $2,500 | $1.21 | 45d | 1 | 0.18mi |
| 1412 Grove Pond Rd Forney, TX | 4.0 | 2.0 | 1708 | $2,500 | $1.46 | 20d | 1 | 0.28mi |
| 1408 Grove Pond Rd Forney, TX | 4.0 | 3.5 | 2543 | $3,095 | $1.22 | 45d | 1 | 0.28mi |
| 209 Chesapeake Dr Forney, TX | 4.0 | 3.5 | 2950 | $3,400 | $1.15 | 45d | 1 | 0.33mi |
| 2105 Cardinal Dr Forney, TX | 4.0 | 2.0 | 1763 | $2,200 | $1.25 | 24d | 1 | 0.36mi |
| 2201 Woodberry Dr Forney, TX | 3.0 | 2.0 | 1839 | $2,050 | $1.11 | 45d | 1 | 0.38mi |
| 236 Pennridge Dr Forney, TX | 3.0 | 2.0 | 1871 | $2,295 | $1.23 | 26d | 1 | 0.42mi |
| 1108 Redcoat Dr , TX | 3.0 | 2.0 | 1800 | $2,250 | $1.25 | 6d | 1 | 0.48mi |
| 108 Antler Trl Forney, TX | 4.0 | 2.0 | 2250 | $2,449 | $1.09 | 26d | 1 | 0.55mi |
| 293 Arbury Dr Forney, TX | 4.0 | 3.5 | 2928 | $2,590 | $0.88 | 9d | 1 | 0.57mi |
| 293 Arbury Dr Forney, TX | 4.0 | 3.5 | 2928 | $2,801 | $0.96 | 26d | 1 | 0.57mi |
| 236 Archer Way Forney, TX | 3.0 | 2.0 | 2016 | $2,300 | $1.14 | 20d | 1 | 0.63mi |
| 2213 Heaton Forney, TX | 3.0 | 2.0 | 2146 | $2,395 | $1.12 | 9d | 1 | 0.65mi |
| 2213 Heaton Forney, TX | 3.0 | 2.0 | 2146 | $2,395 | $1.12 | 18d | 1 | 0.65mi |
| 2225 Heaton Forney, TX | 3.0 | 2.0 | 1909 | $2,150 | $1.13 | 45d | 1 | 0.68mi |
| 106 Painted Trl Forney, TX | 4.0 | 2.0 | 2926 | $2,725 | $0.93 | 14d | 1 | 0.69mi |
| 106 Painted Trl Forney, TX | 4.0 | 2.5 | 2926 | $2,395 | $0.82 | 45d | 1 | 0.69mi |
| 213 Long Prairie Dr Forney, TX | 4.0 | 2.5 | 1964 | $2,025 | $1.03 | 18d | 1 | 0.75mi |
| 120 Garner Ct Forney, TX | 3.0 | 2.0 | 2214 | $2,500 | $1.13 | 45d | 1 | 0.77mi |
| 2902 Hanscom St Forney, TX | 4.0 | 3.5 | 2657 | $3,200 | $1.20 | 45d | 1 | 0.82mi |
| 507 Thunder Trl Forney, TX | 3.0 | 2.0 | 1800 | $2,300 | $1.28 | 0d | 1 | 0.84mi |
| 1421 Kirkhill Ln Unit 1421 Heath, TX | 4.0 | 3.0 | 2545 | $3,500 | $1.38 | 22d | 1 | 0.86mi |
| 1421 Kirkhill Ln Forney, TX | 4.0 | 3.0 | 2545 | $3,600 | $1.41 | 26d | 1 | 0.86mi |
| 501 Branch St Forney, TX | 3.0 | 2.0 | 2130 | $2,270 | $1.07 | 0d | 1 | 0.89mi |
| 1012 Barkers Pond Ave Forney, TX | 4.0 | 2.0 | 1710 | $2,295 | $1.34 | 4d | 1 | 0.92mi |
| 2016 Croftbank St Forney, TX | 3.0 | 2.5 | 1920 | $2,600 | $1.35 | 0d | 1 | 1.00mi |
| 102 Galloping Trl Forney, TX | 3.0 | 2.0 | 1663 | $1,999 | $1.20 | 9d | 1 | 1.04mi |
| 1410 Crossford Trl Forney, TX | 3.0 | 2.5 | 2707 | $2,650 | $0.98 | 3d | 1 | 1.08mi |
| 2023 Avondown Rd Forney, TX | 3.0 | 2.0 | 1640 | $2,191 | $1.34 | 0d | 1 | 1.09mi |
| 110 Meadow Ct Forney, TX | 3.0 | 2.0 | 1840 | $1,783 | $0.97 | 0d | 1 | 1.09mi |
| 1750 Gleasondale Pl Forney, TX | 3.0 | 2.0 | 1633 | $2,200 | $1.35 | 45d | 1 | 1.11mi |
| 635 Brockwell Bnd Forney, TX | 4.0 | 3.0 | 2506 | $3,300 | $1.32 | 21d | 1 | 1.11mi |
| 1759 Gleasondale Pl Forney, TX | 3.0 | 2.0 | 1726 | $2,050 | $1.19 | 26d | 1 | 1.12mi |
| 2121 Juniper Dr Forney, TX | 4.0 | 2.0 | 1935 | $2,249 | $1.16 | 4d | 1 | 1.17mi |
| 1025 Dunhill Ln Forney, TX | 4.0 | 2.0 | 2273 | $2,450 | $1.08 | 3d | 1 | 1.18mi |
| 1124 Longhorn Ln Forney, TX | 4.0 | 2.5 | 2093 | $2,500 | $1.19 | 26d | 1 | 1.19mi |
| 315 Forestwood Dr Forney, TX | 4.0 | 2.0 | 2102 | $2,085 | $0.99 | 26d | 1 | 1.21mi |
| 204 Freedom Trl Forney, TX | 3.0 | 2.0 | 1596 | $1,925 | $1.21 | 3d | 1 | 1.22mi |
HOA detail
- Monthly dues
- $27 · $324/yr
- Likely covers
- pool
Listing history 36 events
-
2026-06-21days on market $299,000 Active 116 DOM
-
2026-06-18days on market $299,000 Active 113 DOM
-
2026-06-17days on market $299,000 Active 112 DOM
-
2026-06-16days on market $299,000 Active 111 DOM
-
2026-06-15days on market $299,000 Active 110 DOM
-
2026-06-13days on market $299,000 Active 108 DOM
-
2026-06-13days on market $299,000 Active 107 DOM
-
2026-06-09days on market $299,000 Active 104 DOM
-
2026-06-08days on market $299,000 Active 103 DOM
-
2026-06-07days on market $299,000 Active 102 DOM
-
2026-06-04days on market $299,000 Active 99 DOM
-
2026-06-03days on market $299,000 Active 98 DOM
-
2026-06-02days on market $299,000 Active 97 DOM
-
2026-06-01days on market $299,000 Active 96 DOM
-
2026-05-31days on market $299,000 Active 95 DOM
-
2026-05-20price $299,000 961-char remark
Show marketing remark (961 chars)
This beautifully updated corner lot home offers a LARGER lot than most other homes in the neighborhood! This home features a bright and modern interior with fresh paint and luxury vinyl plank flooring in the main areas, complemented by plush carpet in the bedrooms and upstairs retreat. The kitchen has updated cabinetry, sleek granite countertops, and stainless-steel appliances, providing for a light and bright feel. Enjoy multiple spacious living areas, ideal for relaxation or hosting guests. The bedrooms are generously sized with ceiling fans and walk in closets! The primary suite includes a private bath with a large walk-in shower and a dual-sink vanity. You'll love the oversized laundry room with built-in shelving and hanging space and additional living on the second floor! Do not miss the expansive fully fenced backyard! All of this in a well-established neighborhood with nearby community amenities that include a community pool and playground!
-
2026-02-25$310,000 Active 961-char remark
Show marketing remark (961 chars)
This beautifully updated corner lot home offers a LARGER lot than most other homes in the neighborhood! This home features a bright and modern interior with fresh paint and luxury vinyl plank flooring in the main areas, complemented by plush carpet in the bedrooms and upstairs retreat. The kitchen has updated cabinetry, sleek granite countertops, and stainless-steel appliances, providing for a light and bright feel. Enjoy multiple spacious living areas, ideal for relaxation or hosting guests. The bedrooms are generously sized with ceiling fans and walk in closets! The primary suite includes a private bath with a large walk-in shower and a dual-sink vanity. You'll love the oversized laundry room with built-in shelving and hanging space and additional living on the second floor! Do not miss the expansive fully fenced backyard! All of this in a well-established neighborhood with nearby community amenities that include a community pool and playground!
-
2026-01-01historical
-
2025-12-04price $360,000
-
2025-09-08price $365,000
-
2025-08-01$375,000 Active
-
2013-06-12soldstatus Closed
-
2013-05-09status Pending
-
2013-05-01historical Active Contingent
-
2013-04-15status Active
-
2013-04-09historical
-
2013-04-09$129,900 Active
-
2013-02-02historical
-
2012-12-03status Active
-
2012-12-01historical
-
2012-10-26status Active
-
2012-10-26historical
-
2012-10-09status Active
-
2012-10-05historical
-
2012-07-26price $139,000
-
2012-05-29$149,000 Active
ⓘ Source: listings_history table (triggers on properties + properties_extension) + one-shot
backfill from property_details.listing_events for pre-trigger history.
Tax reassessment forecast TX · Resets to sale price
- Current annual tax
- $6,833 · $569/mo
- Projected year-2 tax
- $6,833 · $569/mo
- Expected delta
- $0/yr ($0/mo · 0.0%)
ⓘ Screening estimate from a state-policy table — verify with the county assessor before closing.
Climate risk First Street
- Flood 1/10 Low FEMA zone X (unshaded) · 0% chance over 30 yrs
- Wildfire 5/10 Major
- Heat 8/10 Severe 7 d/yr ≥110°F today · 25 d/yr by 30 yrs out
- Wind 6/10 Major 27% chance of damaging wind over 30 yrs
- Air quality 2/10 Low 1 unhealthy d/yr today · 1 by 30 yrs out
Nearby sold comps map
Loading sold comps map…
Walkable amenities ~0.75 mi
Loading nearby amenities…
Taxation est. · year 1
- Rental income
- $29,753
- − Mortgage interest
- −$16,749
- − Property taxes
- −$6,833
- − Insurance
- −$1,495
- − Repairs & maintenance
- −$2,380
- − Management
- −$2,380
- − HOA
- −$324
- − Depreciation
- −$8,698
- Taxable loss
- −$9,107
- Est. tax savings @ 24.0%
- +$2,186
- After-tax cash flow
- $-1,778/yr
For passive investors: Depreciation is non-cash, so a rental often shows a tax loss while cash-flowing — sheltering income. Rental losses are passive: they offset passive income freely, and up to $25,000/yr can offset ordinary (W-2) income if you actively participate and your MAGI is under $100k (phasing out to $0 by $150k); unused losses carry forward. On sale, claimed depreciation is recaptured at up to 25%, and gains may owe capital-gains tax (a 1031 exchange can defer both). Figures are a year-1 estimate at your 24.0% rate — not tax advice; consult a CPA.
Schools (NCES district)
- District
- Forney ISD
- NCES district ID
- 4819560
- Math proficiency
- 41% ▼ -20.00%
- Reading proficiency
- 44% ▼ -12.00%
- Median HH income
- $86,679
- Composite
- 40.07/100
- National rank
- #3812
- State rank
- #234 of 826 in TX
Livability — Forney
- Score
- 76/100
- State rank
- #98
- US rank
- #3339
Category grades
Schools grade is shown separately in the Schools card above.
Census & demographics
- Census place
- Forney, TX
- County
- Kaufman County · 122,338 people
- City population
- 84,799
- Metro
- Dallas-Fort Worth-Arlington, TX
- Population (ZIP)
- 84,799
- Household income
- $103,673
- Rent vs Own
- Severe rent burden
- 1306.0
Population outlook (Kaufman County) Hauer SSP2
- Today (2025)
- 138,716 people
- By 2030
- 150,815 · +8.7%
- By 2040
- 174,877 · +26.1%
- By 2050
- 198,020 · +42.8%
- By 2075
- 251,908 · +81.6%
- By 2100
- 285,325 · +105.7%
Race, ethnicity, and origin ACS 2023
- Neighborhood character
- Diverse neighborhood (Simpson 0.68)
- Race & ethnicity
- White 45% Black 25% Hispanic / Latino 23% Two or more races 14% Asian 3%
- Hispanic origin (detail)
- Mexican 18% Puerto Rican 1%
- Common ancestry
- Italian 2% Slovak 1% Portuguese 1%
- Foreign-born
- 12% · Canada, Vietnam
- Languages at home
- 79% English-only · Spanish 14% Arabic 1% Vietnamese 1%
Political lean MEDSL · Kaufman
- 2024 margin
- Strong R (+27.9) · D 35.6% · R 63.5%
- 2008→2024 swing
- +7.9pp toward D · 2008: -35.8pp · 2024: -27.9pp
- All cycles
- 2024: R+27.9 2020: R+33.9 2016: R+47.0 2012: R+44.4 2008: R+35.8
Not yet ingested
- Civics
- —
Market trends
- HPI YoY
- ▼ -102.93%
- Current HPI
- 148.5749
- Rent YoY
- ▲ 1.42%
- Metro
- Dallas-Fort Worth-Arlington, TX
- State GDP YoY
- ▲ 3.95%
- F500 in state
- 110
Industry mix (Fortune 500 HQ in TX)
| Industry | F500 HQs | Revenue |
|---|---|---|
| Energy | 16 | $1,198B |
|
||
| Technology | 5 | $198B |
|
||
| Engineering / Construction | 4 | $72B |
|
||
| Energy Services | 3 | $60B |
|
||
| Utilities | 3 | $41B |
|
||
| Healthcare | 2 | $330B |
|
||
Price history
+100.7% since first listed21 events — show timeline
- 2026-05-20 Price Changed $299,000 NTREIS
- 2026-02-25 Listed $310,000 NTREIS
- 2026-01-01 Listing Removed — NTREIS
- 2025-12-04 Price Changed $360,000 NTREIS
- 2025-09-08 Price Changed $365,000 NTREIS
- 2025-08-01 Listed $375,000 NTREIS
- 2013-06-12 Sold (MLS) — NTREIS
- 2013-05-09 Pending — NTREIS
- 2013-05-01 Contingent — NTREIS
- 2013-04-15 Relisted — NTREIS
- 2013-04-09 Listing Removed — NTREIS
- 2013-04-09 Listed $129,900 NTREIS
- 2013-02-02 Listing Removed — NTREIS
- 2012-12-03 Relisted — NTREIS
- 2012-12-01 Listing Removed — NTREIS
- 2012-10-26 Relisted — NTREIS
- 2012-10-26 Listing Removed — NTREIS
- 2012-10-09 Relisted — NTREIS
- 2012-10-05 Listing Removed — NTREIS
- 2012-07-26 Price Changed $139,000 NTREIS
- 2012-05-29 Listed $149,000 NTREIS
Property tax history
+3.4%/yrLatest (2025): $6,833 · +12.3% YoY. Source: county tax records.
Cash-flow waterfall
monthlySold comps — $/sqft
last 12 mo · ≤1 miLoading sold comps…