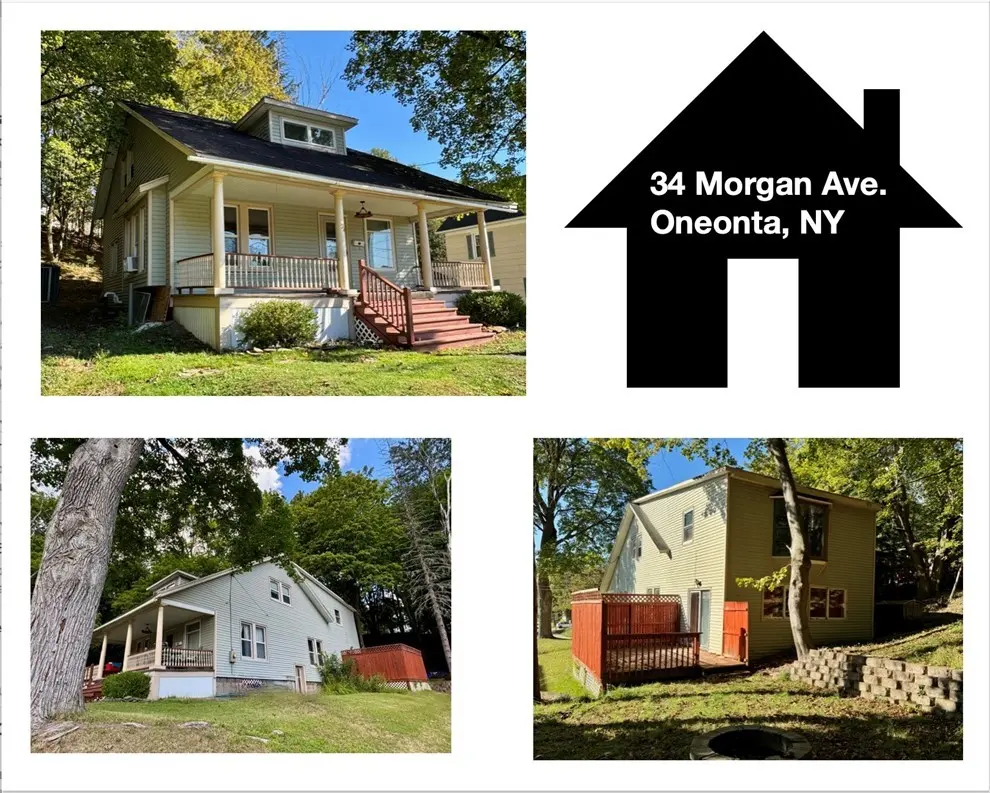
34 Morgan Ave · Oneonta, NY
Flood risk 1/10 · Minimal
- FEMA flood zone
- X (unshaded)
- Chance of flooding over 30 yrs
- 0.0%
- Est. flood insurance / yr
- $473 – $860
Fire risk 1/10 · Minimal
- Est. fire insurance / yr
- $691 – $1,283
Heat risk 2/10 · Minimal
- Hot days now (above 93°F)
- 7 days/yr
- Hot days in 30 yrs
- 17 days/yr
Wind risk 2/10 · Minimal
- Chance of severe wind over 30 yrs
- 1.0%
Air-quality risk 1/10 · Minimal
- Unhealthy air days now
- 0 days/yr
- Unhealthy air days in 30 yrs
- 0 days/yr
Risk factors via First Street. Map © Google.
Why this score? — see what drove the C grade
The composite is a weighted blend of 9 inputs, each scored 0–100. Each bar is that input's sub-score; the figure is the points it added to the 100-point composite (weight × sub-score).
- ARV discount +15.0/15.0
- Cash flow +10.9/30.0
- Appreciation +10.0/10.0
- 1% rule +4.5/10.0
- Schools +4.3/10.0
- Livability +3.8/5.0
- DSCR +3.2/10.0
- Rent growth +2.5/5.0
- Condition / age +2.5/5.0
$174,900
🖨 Deal sheet (PDF) 📄 Offer letter ✓ Due diligence
Listing remarks
West End Oneonta 5 BR Home! First time on the market in over 25 years. Are you looking for a spacious home or investment? Close to Cooperstown All Star Village baseball camp. There are 2 Full bathrooms, one on each level. There is even a first floor bedroom AND first floor laundry. First floor also includes a LR, DR, family room and nice kitchen with island. Yes it needs updating but at this price you can afford to do the updates and make it your own. Private backyard and deck for relaxing. It is very close to Greater Plains Elementary School. If you work from home you will be happy to know Spectrum Cable and Hi Speed Internet are available here.
Key facts
- Deck for relaxing
- Private backyard
- First floor laundry
Tags
Property features AI
Exterior
- Parking: No garage
- Utilities: Electricity connected; Public water connected; Sewer connected; High-speed internet available; Cable available
- Home design: Two-story home; Existing (established) construction
- Construction: Frame construction; Asphalt shingle roof; Stone foundation
- Exterior features: Deck; Open porch; Dirt driveway; Rectangular residential lot; City street frontage; Lot dimensions approximately 90 x 120
Interior
- Kitchen: Dishwasher; Free-standing range; Microwave; Oven; Refrigerator; Kitchen island
- Bedrooms: One main-level bedroom
- Flooring: Carpet; Hardwood; Tile; Vinyl; Varies
- Bathrooms: Two full bathrooms; One bathroom on the main level
- Heating & cooling: Gas forced-air heating
- Interior features: Separate/formal dining room; Separate/formal living room; Kitchen island; Bedroom on main level; See remarks / other
- Laundry & utility: Washer and dryer; Laundry located on the main level; Gas water heater
Neighborhood map
What this means for you Summary
Snapshot
- This is a 3-bed/2.0-bath single-family listed at $175k.
Deal economics
- At list price, monthly cash flow is $-76 ($-909/yr) — negative.
- To cash-flow at today's rent, offer at most $162k (7.7% below list).
- To meet the 1% rule (rent ≥ 1% of price), the offer needs to be $167k (4.5% below list).
- Recommended offer: $154k (12.0% below list) — sets the bar for market timing.
Location & tenants
- Location reads 75/100 on livability (#253 in NY, #4,021 nationally) — a middle-class / working-renter tenant base. Strengths: housing A+, health & safety A+, cost of living B+; Watch: amenities C-, crime F, commute F.
- Oneonta City School District (town): math 46% / reading 57% proficiency, ranked #374 of 590 in NY (top 63%) — acceptable for families but not a draw, mixed tenant base, ~2y average lease.
- Zoned schools: Greater Plains Elementary School (math 37% / reading 57%, grade D-, #1,195 of 2,108 statewide, top 60%, 284 students, 40% FRL); Oneonta Middle School (math 28% / reading 56%, grade D-, #379 of 729 statewide, top 54%, 378 students, 44% FRL); Oneonta Senior High School (math 92% / reading 75%, grade A, #409 of 1,100 statewide, top 39%, 502 students, 37% FRL).
- Market conditions: 119 active listings in the ZIP; 133 units permitted in Otsego County in 2024 (10 in 5+ unit buildings).
- This rent runs 30% of the median local income ($66k/yr) — at the standard rent-burdened threshold; future hikes will face affordability resistance.
Forward outlook
- In year one you build about $19k of equity ($1k loan paydown + $17k appreciation (10.0% local appreciation)).
- Otsego County population projected at -21% by 2050 — secular population decline; favor cash flow + early exit over multi-decade hold.
- At projected returns (10.0% appreciation + 3.0% rent growth), your $49k cash investment doubles in ~3 years — after that, you're playing with house money.
- By year 2, paydown + projected appreciation supports a ~$30k cash-out refi (75% LTV) — recoverable capital for the next deal without selling this one.
Negotiation context
- It's been on market 198 days — a 12% lower offer ($154k) is reasonable based on typical stale-listing flexibility.
- 2 sale attempts; this cycle's ask has dropped $40k (19%) from the opening price — seller is motivated, your offer sets the floor, not the list.
- Current owner paid $93k; list at $175k implies a 89% gain — meaningful room to come down on a strong offer.
Risks & watch-outs
- Watch-outs: property tax is 2.8% of price; built in 1912 — expect roof / HVAC / electrical / plumbing capex.
Questions for the listing agent
- What do current leases actually rent for vs. the listed asking? Can we see a recent rent roll and the last 12 months of T-12 income?
- It's been on market 198 days. Have you received any prior offers? Is the seller open to a 12% concession, seller financing, or rate buy-down credit?
- Built in 1912 — when were the roof, HVAC, electrical panel, plumbing, and water heater last replaced?
- Property tax is high relative to price — has the assessment been appealed recently, and will the sale trigger a re-assessment?
- Why hasn't it sold? Are there any deal-killer items the seller is aware of (foundation, flood, title, zoning, code violations)?
- Is there a deadline driving the sale (1031 exchange, divorce, estate, relocation)? That informs how much negotiation room exists.
- Crime grade is F in this area — have there been break-ins, vandalism, or insurance claims at this property in the last 3 years? What carrier currently insures it and at what premium?
- What's the average days-on-market for RENTAL listings here right now (not sales)? A rising rental-DOM trend means longer vacancies and softer asking-rent achievability than the comps imply.
- What's the recent tenant-quality profile in this submarket — average credit score on applications, eviction rate, late-payment / NSF rate, and stable-employment percentage? A property-management company in the area should have these aggregated.
- How much new for-sale + rental construction is in the pipeline within 1–3 miles? Heavy new supply typically softens prices + rents 12–24 months out; constrained supply supports both.
Investment metrics
- 1% rule
- 0.95% ✗
- Cap rate
- 5.77%
- Cash-on-cash
- -1.86%
- DSCR
- 0.92
- GRM
- 8.7
CMA / ARV
- ARV (on-the-fly)
- $274,664
- Comps found
- 6
Show comp detail 6 sales within ~0.75 mi
| Address | Dist | Beds/Ba | Sqft | Sold | Price | $/sf | Match |
|---|---|---|---|---|---|---|---|
| 15 Schoolhouse Ln | 0.29mi | 3/2.0 | 1,899 (-4%) | 9mo | $370,000 | $195 | 72 |
| 11 West End Ave | 0.14mi | 4/2.0 (+1) | 2,163 (+10%) | 7mo | $300,000 | $139 | 67 |
| 5 Canal St | 0.30mi | 4/2.5 (+1) | 1,992 (+1%) | 17mo | $425,000 | $213 | 63 |
| 23 Orchard St | 0.39mi | 3/2.0 | 1,932 (-2%) | 21mo | $202,500 | $105 | 60 |
| 2 Thorn St | 0.48mi | 3/2.5 | 1,888 (-4%) | 13mo | $175,000 | $93 | 58 |
| 303 Chestnut St | 0.33mi | 4/1.5 (+1) | 1,795 (-9%) | 7mo | $226,000 | $126 | 56 |
Match score weights: distance 35% · size 25% · config 20% · recency 20%. Top-matched comps best support the ARV.
Projected returns pro-forma
10.0% appreciation · 3.0% rent growth · sell at horizon
- IRR
- 23.0%
- Equity multiple
- 2.85×
- Total profit
- $90,568
- Equity at exit
- $157,564
- IRR
- 20.5%
- Equity multiple
- 6.53×
- Total profit
- $270,783
- Equity at exit
- $339,792
Cash invested: $48,972 (down + closing). Projections, not guarantees.
Landlord ↔ Tenant lean methodology
- Overall (STATE)
- 15 Strongly Tenant-Friendly
- State New York
- 15 Strongly Tenant-Friendly · D+10
- County
- — inherits STATE
- City
- — inherits STATE
ZIP-level market 13820
- Home prices YoY
- 22.7%
- Active inventory
- 119
- Price-to-rent
- 8.7×
Monthly cashflow live
- Estimated rent
- $1,670 medium interval (Pro) →
- Mortgage (P&I)
- −$917
- Tax from tax record
- −$405 /mo · $4,862/yr
- Insurance
- −$73
- HOA
- −$0
- Vacancy / Maint / Mgmt
- −$351
- Net cashflow
- $-76
Break-even live
Sensitivity live
| Price | -10% $23 | -5% $-26 | +0% $-76 | +5% $-125 | +10% $-175 |
|---|---|---|---|---|---|
| Rent | -10% $-208 | -5% $-142 | +0% $-76 | +5% $-10 | +10% $56 |
| Rate | -1.0pp $12 | -0.5pp $-31 | base $-76 | +0.5pp $-121 | +1.0pp $-167 |
UW: 25.0% down · 7.5% · 30yr · 1.5% tax · 5.0% vac · 8.0% maint · 8.0% mgmt
Financing live
Cash to close
- Down payment
- $43,725
- Closing costs
- $5,247
- Reserves months
- —
- Total cash needed
- —
Loan-product check · same deal, 3 products live
Conventional
25% down · 7.5% · 30yr
- Down + closing
- —
- Monthly P&I
- —
- Monthly cashflow
- —
- DSCR
- —
- Eligible?
- —
Personal DTI + credit; lowest rate.
DSCR
20% down · 8.5% · 30yr
- Down + closing
- —
- Monthly P&I
- —
- Monthly cashflow
- —
- DSCR
- —
- Eligible?
- —
No personal income docs; deal must DSCR.
Hard money
10% down · 12.0% · 12mo
- Down + closing
- —
- Monthly P&I
- —
- Monthly cashflow
- —
- DSCR
- —
- Eligible?
- —
Short-term bridge; refi at stabilization.
Listing history 22 events
-
2026-06-21days on market $174,900 Active 198 DOM
-
2026-06-19days on market $174,900 Active 196 DOM
-
2026-06-18days on market $174,900 Active 195 DOM
-
2026-06-17days on market $174,900 Active 194 DOM
-
2026-06-16days on market $174,900 Active 193 DOM
-
2026-06-15days on market $174,900 Active 192 DOM
-
2026-06-14days on market $174,900 Active 190 DOM
-
2026-06-12days on market $174,900 Active 189 DOM
-
2026-06-09days on market $174,900 Active 186 DOM
-
2026-06-08days on market $174,900 Active 185 DOM
-
2026-06-07days on market $174,900 Active 184 DOM
-
2026-06-07days on market $174,900 Active 183 DOM
-
2026-06-02days on market $174,900 Active 179 DOM
-
2026-06-01days on market $174,900 Active 178 DOM
-
2026-05-31days on market $174,900 Active 177 DOM
-
2026-05-31days on market $174,900 Active 176 DOM
-
2026-05-23status Active
-
2026-05-15historical Active Under Contract
-
2026-05-06price $174,900
-
2026-02-01price $190,000
-
2025-12-04$215,000 Active
-
1998-08-03soldstatus $92,598
ⓘ Source: listings_history table (triggers on properties + properties_extension) + one-shot
backfill from property_details.listing_events for pre-trigger history.
Tax reassessment forecast NY · Partial reset (capped growth)
- Current annual tax
- $4,862 · $405/mo
- Projected year-2 tax
- $4,862 · $405/mo
- Expected delta
- $0/yr ($0/mo · 0.0%)
ⓘ Screening estimate from a state-policy table — verify with the county assessor before closing.
Climate risk First Street
- Flood 1/10 Low FEMA zone X (unshaded) · 0% chance over 30 yrs
- Wildfire 1/10 Low
- Heat 2/10 Low 7 d/yr ≥93°F today · 17 d/yr by 30 yrs out
- Wind 2/10 Low 100% chance of damaging wind over 30 yrs
- Air quality 1/10 Low 0 unhealthy d/yr today · 0 by 30 yrs out
Nearby sold comps map
Loading sold comps map…
Walkable amenities ~0.75 mi
Loading nearby amenities…
Taxation est. · year 1
- Rental income
- $20,043
- − Mortgage interest
- −$9,797
- − Property taxes
- −$4,862
- − Insurance
- −$874
- − Repairs & maintenance
- −$1,603
- − Management
- −$1,603
- − Depreciation
- −$5,088
- Taxable loss
- −$3,786
- Est. tax savings @ 24.0%
- +$909
- After-tax cash flow
- $-1/yr
For passive investors: Depreciation is non-cash, so a rental often shows a tax loss while cash-flowing — sheltering income. Rental losses are passive: they offset passive income freely, and up to $25,000/yr can offset ordinary (W-2) income if you actively participate and your MAGI is under $100k (phasing out to $0 by $150k); unused losses carry forward. On sale, claimed depreciation is recaptured at up to 25%, and gains may owe capital-gains tax (a 1031 exchange can defer both). Figures are a year-1 estimate at your 24.0% rate — not tax advice; consult a CPA.
Schools (NCES district)
- District
- Oneonta City School District
- NCES district ID
- 3621780
- Math proficiency
- 46% ▼ -2.00%
- Reading proficiency
- 57% ▲ 14.00%
- Median HH income
- $41,631
- Composite
- 43.19/100
- National rank
- #3066
- State rank
- #374 of 590 in NY
Livability — Oneonta
- Score
- 75/100
- State rank
- #253
- US rank
- #4021
Category grades
Schools grade is shown separately in the Schools card above.
Census & demographics
- Census place
- Oneonta, NY
- County
- Otsego County · 23,056 people
- City population
- 23,056
- Metro
- Oneonta, NY
- Population (ZIP)
- 23,056
- Household income
- $65,953
- Rent vs Own
- Severe rent burden
- 662.0
Population outlook (Otsego County) Hauer SSP2
- Today (2025)
- 57,987 people
- By 2030
- 55,403 · -4.5%
- By 2040
- 50,336 · -13.2%
- By 2050
- 45,715 · -21.2%
- By 2075
- 38,769 · -33.1%
- By 2100
- 33,468 · -42.3%
Race, ethnicity, and origin ACS 2023
- Neighborhood character
- Predominantly White (84%)
- Race & ethnicity
- White 84% Hispanic / Latino 6% Black 5% Two or more races 5% Asian 2%
- Hispanic origin (detail)
- Puerto Rican 2%
- Common ancestry
- Romanian 4% Slovak 2% Lithuanian 2%
- Foreign-born
- 5% · Canada, China
- Languages at home
- 94% English-only · Spanish 3% Russian/Polish/Slavic 1% Other Indo-European 1%
Political lean MEDSL · Otsego
- 2024 margin
- Lean R (+7.9) · D 46.1% · R 53.9%
- 2008→2024 swing
- -13.8pp toward R · 2008: 5.9pp · 2024: -7.9pp
- All cycles
- 2024: R+7.9 2020: R+5.0 2016: R+13.0 2012: D+2.0 2008: D+5.9
Not yet ingested
- Civics
- —
Market trends
- HPI YoY
- ▲ 67.86%
- Current HPI
- 366.3391
- Rent YoY
- —
- Metro
- Oneonta, NY
- State GDP YoY
- ▲ 2.60%
- F500 in state
- 92
Industry mix (Fortune 500 HQ in NY)
| Industry | F500 HQs | Revenue |
|---|---|---|
| Financial Services | 10 | $950B |
|
||
| Consumer Goods | 9 | $162B |
|
||
| Insurance | 4 | $225B |
|
||
| Telecommunications | 2 | $144B |
|
||
| Pharmaceuticals | 2 | $112B |
|
||
| Media / Entertainment | 2 | $69B |
|
||
Price history
+88.9% since first listed6 events — show timeline
- 2026-05-23 Relisted — UNYREIS
- 2026-05-15 Contingent — UNYREIS
- 2026-05-06 Price Changed $174,900 UNYREIS
- 2026-02-01 Price Changed $190,000 UNYREIS
- 2025-12-04 Listed $215,000 UNYREIS
- 1998-08-03 Sold (Public Records) $92,598 Public Records
Property tax history
+2.8%/yrLatest (2025): $4,862 · +5.5% YoY. Source: county tax records.
Cash-flow waterfall
monthlySold comps — $/sqft
last 12 mo · ≤1 miLoading sold comps…