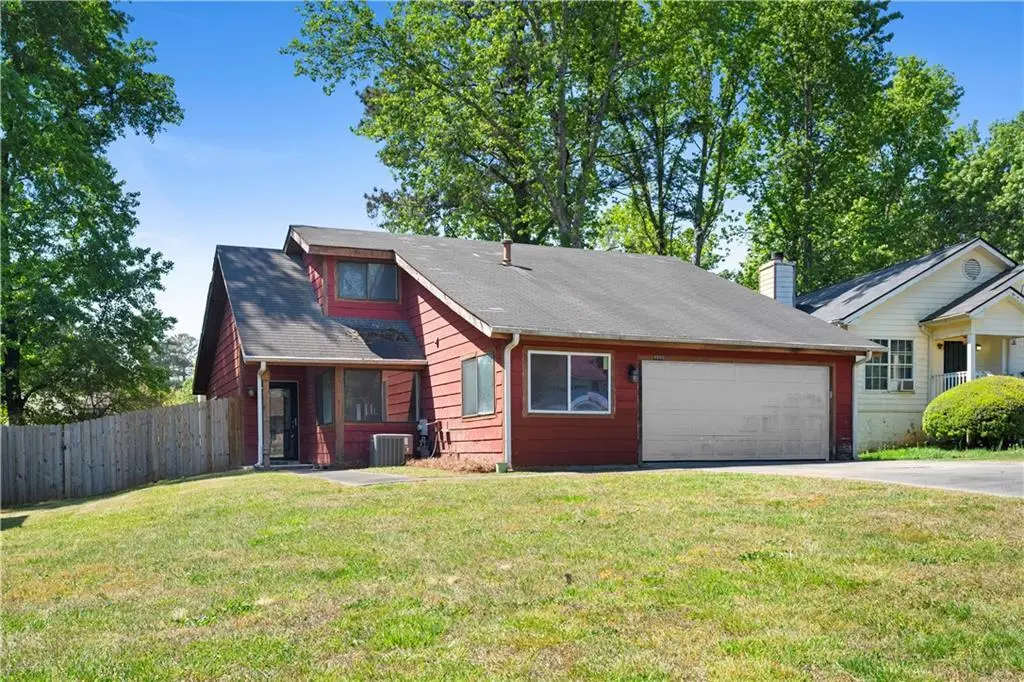
4660 Tartan Ct · Union City, GA
Flood risk 1/10 · Minimal
- FEMA flood zone
- X (unshaded)
- Chance of flooding over 30 yrs
- 0.0%
- Est. flood insurance / yr
- $507 – $1,088
Fire risk 2/10 · Minimal
- Est. fire insurance / yr
- $963 – $1,789
Heat risk 6/10 · Moderate
- Hot days now (above 104°F)
- 7 days/yr
- Hot days in 30 yrs
- 18 days/yr
Wind risk 5/10 · Moderate
- Chance of severe wind over 30 yrs
- 25.0%
Air-quality risk 4/10 · Minor
- Unhealthy air days now
- 4 days/yr
- Unhealthy air days in 30 yrs
- 6 days/yr
Risk factors via First Street. Map © Google.
Why this score? — see what drove the B grade
The composite is a weighted blend of 9 inputs, each scored 0–100. Each bar is that input's sub-score; the figure is the points it added to the 100-point composite (weight × sub-score).
- Cash flow +22.0/30.0
- ARV discount +15.0/15.0
- Appreciation +10.0/10.0
- 1% rule +7.6/10.0
- DSCR +7.0/10.0
- Schools +4.5/10.0
- Rent growth +3.1/5.0
- Livability +2.9/5.0
- Condition / age +2.5/5.0
$170,000
🖨 Deal sheet 📄 Offer letter ✓ Due diligence
Listing remarks
4 bed, 2 bath home in Union City. This home sits on a quiet cul de sac and is walkable to Gullatt Elementary School. The main floor features the living area with high lofted ceilings, creating a spacious and open feel. You will also find two bedrooms and one full bath on the main level. Upstairs, you will find the remaining two bedrooms and full bathroom. Additional highlights include a two car garage, rear patio, and fenced in backyard.
Key facts
- Fenced in backyard
- Rear patio
- Quiet cul de sac
Tags
Property features AI
Finance
- HOA & community: Near schools; Close to shopping; Near trails/greenway
Exterior
- Parking: Two-car garage; Driveway parking; Open parking available
- Utilities: Public water; Public sewer; Electric service (other)
- Home design: Two levels; Fixer condition; Slab foundation; Composition roof; Wood siding construction
- Construction: Wood siding exterior; Composition roof; Slab foundation
- Exterior features: Private yard; Back yard fencing; Patio
Interior
- Kitchen: Kitchen with included appliances (other)
- Bedrooms: Two main-level bedrooms; Two upper-level bedrooms; Primary bedroom located on the main level
- Flooring: Carpet; Laminate
- Bathrooms: Two full bathrooms; One main-level bathroom; One upper-level full bathroom; Master bath with tub/shower combination
- Heating & cooling: Central heating; Central air conditioning
- Interior features: Vaulted ceilings; No shared/common walls
- Laundry & utility: Laundry area (other)
Neighborhood map
What this means for you Summary
Snapshot
- This is a 4-bed/2.0-bath single-family listed at $170k.
Deal economics
- At list price, monthly cash flow is $272 ($3k/yr) — positive.
- The deal already cash-flows at list — no discount required.
- Meets the 1% rule at list price ($2k rent vs $170k).
- Recommended offer: $165k (3.0% below list) — sets the bar for market timing.
- Cap rate 8.2% vs local median 5.4% in Union City — top-decile yield for the area; either an underpriced asset or a hidden risk that comps aren't pricing in. Stress-test before assuming the spread holds.
Location & tenants
- Location reads 58/100 on livability (#443 in GA) — a working-class tenant base; expect higher turnover. Strengths: cost of living A+, housing A+; Watch: crime D+, schools F, amenities F.
- Fulton County (suburban): math 49% / reading 53% proficiency, ranked #12 of 174 in GA (top 7%) — acceptable for families but not a draw, mixed tenant base, ~2y average lease.
- Market conditions: Rents rising (+2.2%/yr); 167 active listings in the ZIP; 19 comparable units currently listed for rent nearby; rentals at typical pace (median 22d on market — plan ~3-4 weeks tenant-placement turnaround); 11,565 units permitted in Fulton County in 2024 (8,159 in 5+ unit buildings).
- At $2,141/mo this rent would consume 53% of the median local household income ($48k/yr) (locally 1778% of renters already pay >50% of income on rent) — very limited rent-growth headroom before tenants either downsize or default.
Forward outlook
- In year one you build about $18k of equity ($1k loan paydown + $17k appreciation (10.0% local appreciation)).
- Fulton County population projected at +38% by 2050 — long-run rental-demand tailwind backs the buy-and-hold thesis.
- At projected returns (10.0% appreciation + 2.2% rent growth), your $48k cash investment doubles in ~3 years — after that, you're playing with house money.
- By year 3, paydown + projected appreciation supports a ~$46k cash-out refi (75% LTV) — recoverable capital for the next deal without selling this one.
Negotiation context
- It's been on market 47 days — a 3% lower offer ($165k) is reasonable based on typical stale-listing flexibility.
- Current owner paid $125k; 36% above their basis — modest negotiation headroom, anchor on the comps not their cost.
Risks & watch-outs
- Watch-outs: property tax is 3.2% of price.
- Climate carrying-cost: moderate wind risk, 25% chance of damaging wind over 30y; extreme-heat days projected 7→18/yr by 2055 (HVAC capex compounding) — expect insurance premiums to compound above CPI over the hold.
Questions for the listing agent
- It's been on market 47 days. Have you received any prior offers? Is the seller open to a 3% concession, seller financing, or rate buy-down credit?
- Built in 1976 — when were the roof, HVAC, electrical panel, plumbing, and water heater last replaced?
- Property tax is high relative to price — has the assessment been appealed recently, and will the sale trigger a re-assessment?
- Is there a deadline driving the sale (1031 exchange, divorce, estate, relocation)? That informs how much negotiation room exists.
- Schools are F-rated, which usually means shorter tenancies and higher turnover. Who's the typical renter profile here, and what's been the actual vacancy rate?
- Crime grade is D in this area — have there been break-ins, vandalism, or insurance claims at this property in the last 3 years? What carrier currently insures it and at what premium?
- What's the average days-on-market for RENTAL listings here right now (not sales)? A rising rental-DOM trend means longer vacancies and softer asking-rent achievability than the comps imply.
- What's the recent tenant-quality profile in this submarket — average credit score on applications, eviction rate, late-payment / NSF rate, and stable-employment percentage? A property-management company in the area should have these aggregated.
- How much new for-sale + rental construction is in the pipeline within 1–3 miles? Heavy new supply typically softens prices + rents 12–24 months out; constrained supply supports both.
Investment metrics
- 1% rule
- 1.26% ✓
- Cap rate
- 8.21%
- Cash-on-cash
- 6.85%
- DSCR
- 1.30
- GRM
- 6.6
CMA / ARV
- ARV (median comp)
- $300,285
- List price
- $170,000
- Delta
- -43.39%
- Verdict
- UNDERPRICED
- Comps
- 20 within 1.0 mi
Projected returns pro-forma
10.0% appreciation · 2.2% rent growth · sell at horizon
- IRR
- 28.9%
- Equity multiple
- 3.28×
- Total profit
- $108,369
- Equity at exit
- $153,149
- IRR
- 24.9%
- Equity multiple
- 7.36×
- Total profit
- $302,523
- Equity at exit
- $330,273
Cash invested: $47,600 (down + closing). Projections, not guarantees.
Landlord ↔ Tenant lean methodology
- Overall (STATE)
- 90 Strongly Landlord-Friendly
- State Georgia
- 90 Strongly Landlord-Friendly · R+3
- County
- — inherits STATE
- City
- — inherits STATE
ZIP-level market 30291
- Home prices YoY
- 11.1%
- Rents YoY
- 2.2%
- Active inventory
- 167
- Price-to-rent
- 6.6×
Monthly cashflow live
- Estimated rent
- $2,141 high interval (Pro) →
- Mortgage (P&I)
- −$891
- Tax from tax record
- −$457 /mo · $5,486/yr
- Insurance
- −$71
- HOA
- −$0
- Vacancy / Maint / Mgmt
- −$450
- Net cashflow
- $272
Break-even live
UW: 25.0% down · 7.5% · 30yr · 1.5% tax · 5.0% vac · 8.0% maint · 8.0% mgmt
Financing live
Cash to close
- Down payment
- $42,500
- Closing costs
- $5,100
- Reserves months
- —
- Total cash needed
- —
Loan-product check · same deal, 3 products live
Conventional
25% down · 7.5% · 30yr
- Down + closing
- —
- Monthly P&I
- —
- Monthly cashflow
- —
- DSCR
- —
- Eligible?
- —
Personal DTI + credit; lowest rate.
DSCR
20% down · 8.5% · 30yr
- Down + closing
- —
- Monthly P&I
- —
- Monthly cashflow
- —
- DSCR
- —
- Eligible?
- —
No personal income docs; deal must DSCR.
Hard money
10% down · 12.0% · 12mo
- Down + closing
- —
- Monthly P&I
- —
- Monthly cashflow
- —
- DSCR
- —
- Eligible?
- —
Short-term bridge; refi at stabilization.
Rent comps 19 comps
| Address | Beds | Baths | Sqft | Rent | $/sqft | DOM | Units | Dist |
|---|---|---|---|---|---|---|---|---|
| 4659 Shannon Ct Union City, GA | 3.0 | 2.5 | 2030 | $1,945 | $0.96 | 43d | 1 | 0.07mi |
| 4701 Flat Shoals Rd Union City, GA | 3.0 | 2.5–3.0 | 1600 | $1,775 | $1.11 | 2d | 1 | 0.13mi |
| 4500 Shannon Blvd Unit 7A Union City, GA | 3.0 | 2.5 | 2205 | $1,750 | $0.79 | 24d | 1 | 0.49mi |
| 4500 Shannon Blvd Unit 7A Union City, GA | 3.0 | 2.5 | 2205 | $2,000 | $0.91 | 43d | 1 | 0.49mi |
| 6340 Westbrook Ave Union City, GA | 3.0 | 2.0 | 1800 | $2,100 | $1.17 | 43d | 1 | 0.67mi |
| 6350 Oakley Rd Union City, GA | 3.0 | 2.0–2.5 | 1472 | $1,796 | $1.22 | 1d | 4 | 0.69mi |
| 610 Dot Dr Atlanta, GA | 4.0 | 2.5 | 3202 | $2,656 | $0.83 | 43d | 1 | 0.72mi |
| 6150 Mallory Rd Atlanta, GA | 3.0 | 2.0 | 1681 | $1,695 | $1.01 | 10d | 1 | 0.84mi |
| 6596 Woodwell Dr Union City, GA | 3.0 | 2.5 | 1804 | $2,215 | $1.23 | 12d | 1 | 0.86mi |
| 3791 Shenfield Dr Union City, GA | 3.0 | 2.5 | 1784 | $2,086 | $1.17 | 10d | 1 | 0.92mi |
| 3505 Creekview Dr Union City, GA | 3.0 | 3.0 | 2774 | $2,395 | $0.86 | 1d | 1 | 0.92mi |
| 6120 Longino Dr Union City, GA | 4.0 | 2.0 | 1608 | $1,835 | $1.14 | 12d | 1 | 0.96mi |
| 3855 Shenfield Dr Union City, GA | 3.0 | 2.5 | 1626 | $1,895 | $1.17 | 43d | 1 | 1.07mi |
| 3859 Shenfield Dr Union City, GA | 4.0 | 2.5 | 1850 | $2,000 | $1.08 | 5d | 1 | 1.08mi |
| 6225 Shenfield Ln Union City, GA | 3.0 | 2.5 | 1821 | $2,000 | $1.10 | 43d | 1 | 1.11mi |
| 4014 Carisbrook Dr Union City, GA | 4.0 | 2.5 | 1795 | $2,295 | $1.28 | 21d | 1 | 1.12mi |
| 4014 Carisbrook Dr Union City, GA | 4.0 | 2.5 | 1795 | $2,195 | $1.22 | 5d | 1 | 1.12mi |
| 4014 Carisbrook Dr Union City, GA | 4.0 | 2.5 | 1795 | $2,295 | $1.28 | 24d | 1 | 1.12mi |
| 5573 Rock Lake Dr Atlanta, GA | 4.0 | 2.5 | 2690 | $2,350 | $0.87 | 24d | 1 | 1.45mi |
Listing history 12 events
-
2026-06-09days on market $170,000 Active 47 DOM
-
2026-06-08pricedays on market $170,000 Active 46 DOM
-
2026-06-07days on market $179,900 Active 45 DOM
-
2026-06-04days on market $179,900 Active 42 DOM
-
2026-06-03days on market $179,900 Active 41 DOM
-
2026-06-01days on market $179,900 Active 39 DOM
-
2026-05-31days on market $179,900 Active 38 DOM
-
2026-04-23$189,900 New 441-char remark
-
2026-04-23$189,900 Active 441-char remark
-
2002-08-13soldstatus $89,000
-
1986-02-10soldstatus $66,500
-
1976-08-01soldstatus $46,100
ⓘ Source: listings_history table (triggers on properties + properties_extension) + one-shot
backfill from property_details.listing_events for pre-trigger history.
Tax reassessment forecast GA · Resets to sale price
- Current annual tax
- $5,486 · $457/mo
- Projected year-2 tax
- $5,486 · $457/mo
- Expected delta
- $0/yr ($0/mo · 0.0%)
ⓘ Screening estimate from a state-policy table — verify with the county assessor before closing.
Climate risk First Street
- Flood 1/10 Low FEMA zone X (unshaded) · 0% chance over 30 yrs
- Wildfire 2/10 Low
- Heat 6/10 Major 7 d/yr ≥104°F today · 18 d/yr by 30 yrs out
- Wind 5/10 Major 25% chance of damaging wind over 30 yrs
- Air quality 4/10 Moderate 4 unhealthy d/yr today · 6 by 30 yrs out
Nearby sold comps map
Loading sold comps map…
Walkable amenities ~0.75 mi
Loading nearby amenities…
Taxation est. · year 1
- Rental income
- $25,690
- − Mortgage interest
- −$9,523
- − Property taxes
- −$5,486
- − Insurance
- −$850
- − Repairs & maintenance
- −$2,055
- − Management
- −$2,055
- − Depreciation
- −$4,945
- Taxable income
- $776
- Est. tax owed @ 24.0%
- −$186
- After-tax cash flow
- $3,075/yr
For passive investors: Depreciation is non-cash, so a rental often shows a tax loss while cash-flowing — sheltering income. Rental losses are passive: they offset passive income freely, and up to $25,000/yr can offset ordinary (W-2) income if you actively participate and your MAGI is under $100k (phasing out to $0 by $150k); unused losses carry forward. On sale, claimed depreciation is recaptured at up to 25%, and gains may owe capital-gains tax (a 1031 exchange can defer both). Figures are a year-1 estimate at your 24.0% rate — not tax advice; consult a CPA.
Schools (NCES district)
- District
- Fulton County
- NCES district ID
- 1302280
- Math proficiency
- 49% ▼ -2.00%
- Reading proficiency
- 53% ▬ 0.00%
- Median HH income
- $68,035
- Composite
- 45.33/100
- National rank
- #2640
- State rank
- #12 of 174 in GA
Livability — Union City
- Score
- 58/100
- State rank
- #443
- US rank
- #21281
Category grades
Schools grade is shown separately in the Schools card above.
Census & demographics
- Census place
- Union City, GA
- County
- Fulton County · 1,094,430 people
- City population
- 25,130
- Metro
- Atlanta-Sandy Springs-Alpharetta, GA
- Population (ZIP)
- 25,130
- Household income
- $48,184
- Rent vs Own
- Severe rent burden
- 1778.0
Population outlook (Fulton County) Hauer SSP2
- Today (2025)
- 1,203,707 people
- By 2030
- 1,299,706 · +8.0%
- By 2040
- 1,488,256 · +23.6%
- By 2050
- 1,664,580 · +38.3%
- By 2075
- 2,036,072 · +69.2%
- By 2100
- 2,222,402 · +84.6%
Race, ethnicity, and origin ACS 2023
- Neighborhood character
- Predominantly Black (86%)
- Race & ethnicity
- Black 86% Hispanic / Latino 7% Two or more races 6% White 3%
- Hispanic origin (detail)
- Mexican 4%
- Common ancestry
- Italian 1%
- Foreign-born
- 5% · Canada
- Languages at home
- 92% English-only · Spanish 6%
Political lean MEDSL · Fulton
- 2024 margin
- Solid D (+44.9) · D 71.9% · R 27.0% · Other 1.1%
- 2008→2024 swing
- +9.8pp toward D · 2008: 35.0pp · 2024: 44.9pp
- All cycles
- 2024: D+44.9 2020: D+46.4 2016: D+42.1 2012: D+29.6 2008: D+35.0
Not yet ingested
- Civics
- —
Market trends
- HPI YoY
- ▲ 23.98%
- Current HPI
- 239.3471
- Rent YoY
- ▲ 2.20%
- Metro
- Atlanta-Sandy Springs-Alpharetta, GA
- State GDP YoY
- ▲ 2.66%
- F500 in state
- 28
Industry mix (Fortune 500 HQ in GA)
| Industry | F500 HQs | Revenue |
|---|---|---|
| Paper / Packaging | 2 | $29B |
|
||
| Retail | 1 | $160B |
|
||
| Transportation / Logistics | 1 | $91B |
|
||
| Airlines | 1 | $62B |
|
||
| Consumer Goods | 1 | $47B |
|
||
| Utilities | 1 | $25B |
|
||
Price history
+268.8% since first listed8 events — show timeline
- 2026-06-11 Listing Removed — GAMLS
- 2026-06-08 Price Changed $170,000 GAMLS
- 2026-05-27 Price Changed $179,900 GAMLS
- 2026-04-27 Sold (Public Records) $125,000 Public Records
- 2026-04-23 Listed $189,900 GAMLS
- 2002-08-13 Sold (Public Records) $89,000 Public Records
- 1986-02-10 Sold (Public Records) $66,500 Public Records
- 1976-08-01 Sold (Public Records) $46,100 Public Records
Property tax history
+8.4%/yrLatest (2025): $5,486 · +44.2% YoY. Source: county tax records.
Cash-flow waterfall
monthlySold comps — $/sqft
last 12 mo · ≤1 miLoading sold comps…