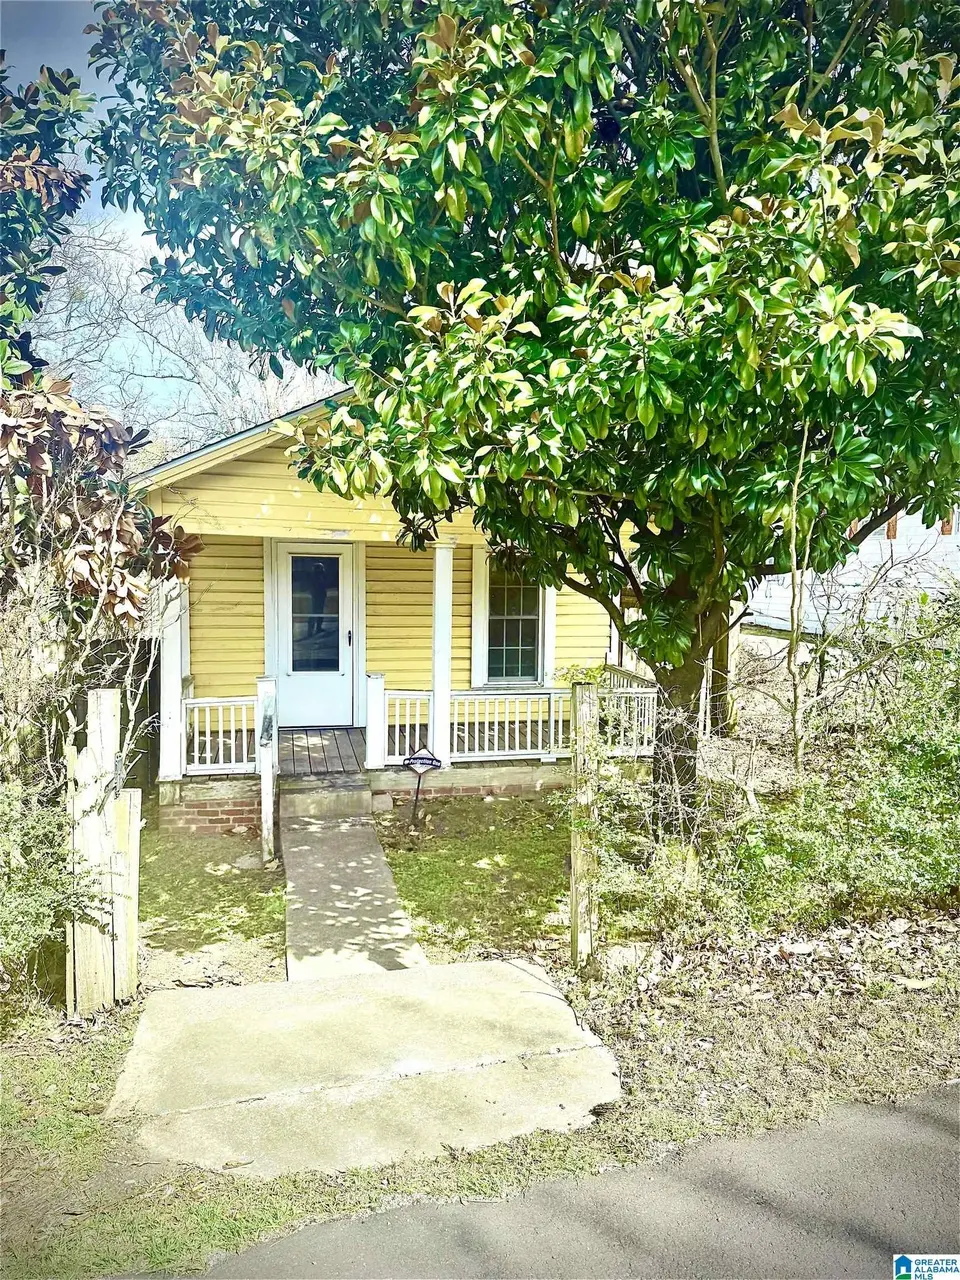
611 S 48th St S · Birmingham, AL
Flood risk 1/10 · Minimal
- FEMA flood zone
- X (unshaded)
- Chance of flooding over 30 yrs
- 0.0%
- Est. flood insurance / yr
- $507 – $1,088
Fire risk 1/10 · Minimal
- Est. fire insurance / yr
- $916 – $1,700
Heat risk 6/10 · Moderate
- Hot days now (above 106°F)
- 7 days/yr
- Hot days in 30 yrs
- 19 days/yr
Wind risk 6/10 · Moderate
- Chance of severe wind over 30 yrs
- 27.0%
Air-quality risk 4/10 · Minor
- Unhealthy air days now
- 6 days/yr
- Unhealthy air days in 30 yrs
- 8 days/yr
Risk factors via First Street. Map © Google.
Why this score? — see what drove the C- grade
The composite is a weighted blend of 9 inputs, each scored 0–100. Each bar is that input's sub-score; the figure is the points it added to the 100-point composite (weight × sub-score).
- Cash flow +15.1/30.0
- ARV discount +15.0/15.0
- Rent growth +5.0/5.0
- DSCR +4.6/10.0
- 1% rule +3.5/10.0
- Livability +3.4/5.0
- Condition / age +2.5/5.0
- Schools +0.9/10.0
- Appreciation +0.0/10.0
$180,000
🖨 Deal sheet 📄 Offer letter ✓ Due diligence
Listing remarks MLS
Its all about the Lokation!!!! This charming home is close to everything Birmingham has to offer! In a quite neighborhood! Truly the best of both worlds to enjoy the city life then go home to peacefulness.
Key facts
- 5,227 sq ft lot
- Built 1996
- Listed 111 days
Neighborhood map
What this means for you Summary
Snapshot
- This is a 2-bed/2.0-bath single-family listed at $180k.
Deal economics
- At list price, monthly cash flow is $58 ($702/yr) — positive.
- The deal already cash-flows at list — no discount required.
- To meet the 1% rule (rent ≥ 1% of price), the offer needs to be $153k (14.8% below list).
- Recommended offer: $153k (14.8% below list) — sets the bar for 1% rule.
Location & tenants
- Location reads 67/100 on livability (#78 in AL) — a middle-class / working-renter tenant base. Strengths: commute A+, cost of living A+, housing A+; Watch: amenities C-, schools F, crime F.
- Birmingham City (urban): math 4% / reading 20% proficiency, ranked #116 of 129 in AL (top 90%) — low school quality limits family demand, transient renter base, plan for 1-2y turnover; 82% free/reduced lunch — lower-income household profile, screen leases tightly.
- Market conditions: Rents rising fast (+14.8%/yr); 311 active listings in the ZIP; 40 comparable units currently listed for rent nearby; rentals at typical pace (median 24d on market — plan ~3-4 weeks tenant-placement turnaround); 40% of comp listings sitting > 30 days — soft ceiling on asking rent; solid renter incomes; 2,114 units permitted in Jefferson County in 2024 (556 in 5+ unit buildings).
Forward outlook
- Local home prices are declining (-3.0%/yr); year-one equity from $1k of loan paydown is wiped out by about $5k of value loss. Plan a longer hold.
- Jefferson County population projected to shrink 4% by 2050 — rents likely to lag national; underwrite the cash flow, not the appreciation.
Negotiation context
- It's been on market 111 days — a 9% lower offer ($164k) is reasonable based on typical stale-listing flexibility.
- Current owner paid $100k; list at $180k implies a 80% gain — meaningful room to come down on a strong offer.
Risks & watch-outs
- Climate carrying-cost: major wind risk, 27% chance of damaging wind over 30y; extreme-heat days projected 7→19/yr by 2055 (HVAC capex compounding) — expect insurance premiums to compound above CPI over the hold.
Questions for the listing agent
- It's been on market 111 days. Have you received any prior offers? Is the seller open to a 15% concession, seller financing, or rate buy-down credit?
- Why hasn't it sold? Are there any deal-killer items the seller is aware of (foundation, flood, title, zoning, code violations)?
- Is there a deadline driving the sale (1031 exchange, divorce, estate, relocation)? That informs how much negotiation room exists.
- Schools are F-rated, which usually means shorter tenancies and higher turnover. Who's the typical renter profile here, and what's been the actual vacancy rate?
- Crime grade is F in this area — have there been break-ins, vandalism, or insurance claims at this property in the last 3 years? What carrier currently insures it and at what premium?
- What's the average days-on-market for RENTAL listings here right now (not sales)? A rising rental-DOM trend means longer vacancies and softer asking-rent achievability than the comps imply.
- What's the recent tenant-quality profile in this submarket — average credit score on applications, eviction rate, late-payment / NSF rate, and stable-employment percentage? A property-management company in the area should have these aggregated.
- How much new for-sale + rental construction is in the pipeline within 1–3 miles? Heavy new supply typically softens prices + rents 12–24 months out; constrained supply supports both.
Investment metrics
- 1% rule
- 0.85% ✗
- Cap rate
- 6.68%
- Cash-on-cash
- 1.39%
- DSCR
- 1.06
- GRM
- 9.8
CMA / ARV
- ARV (median comp)
- $281,947
- List price
- $180,000
- Delta
- -36.16%
- Verdict
- UNDERPRICED
- Comps
- 20 within 1.0 mi
Show comp detail 12 sales within ~0.75 mi
| Address | Dist | Beds/Ba | Sqft | Sold | Price | $/sf | Match |
|---|---|---|---|---|---|---|---|
| 539 47th St S | 0.26mi | 2/2.0 | 1,136 (+4%) | 1mo | $345,000 | $304 | 80 |
| 4910 3rd Ave S | 0.19mi | 3/1.0 (+1) | 1,088 (0%) | 3mo | $219,900 | $202 | 80 |
| 4453 7th Ave S | 0.49mi | 2/2.0 | 1,033 (-5%) | 2mo | $349,900 | $339 | 67 |
| 4400 6th Ave S | 0.59mi | 2/2.0 | 1,115 (+2%) | 2mo | $369,900 | $332 | 67 |
| 4405 5th Ave S | 0.52mi | 2/1.0 | 1,126 (+4%) | 2mo | $250,000 | $222 | 64 |
| 5112 8th Ter S | 0.32mi | 2/1.0 | 926 (-15%) | 3mo | $280,000 | $302 | 54 |
| 4713 9th Ave S | 0.57mi | 3/1.5 (+1) | 1,008 (-7%) | 2mo | $239,900 | $238 | 52 |
| 942 S 53rd St | 0.36mi | 3/1.0 (+1) | 1,225 (+13%) | 2mo | $315,000 | $257 | 52 |
| 5327 7th Ave S | 0.59mi | 3/1.0 (+1) | 1,159 (+6%) | 3mo | $296,900 | $256 | 50 |
| 605 55th Pl S | 0.73mi | 3/2.0 (+1) | 1,214 (+12%) | 4mo | $290,000 | $239 | 38 |
| 5405 6th Ct S | 0.62mi | 3/1.0 (+1) | 1,238 (+14%) | 4mo | $328,750 | $266 | 36 |
| 208 52nd Pl N | 0.71mi | 2/1.0 | 926 (-15%) | 3mo | $62,500 | $67 | 36 |
Match score weights: distance 35% · size 25% · config 20% · recency 20%. Top-matched comps best support the ARV.
Projected returns pro-forma
-3.0% appreciation · 8.0% rent growth · sell at horizon
- IRR
- -9.0%
- Equity multiple
- 0.66×
- Total profit
- $-17,368
- Equity at exit
- $26,839
- IRR
- 5.8%
- Equity multiple
- 1.52×
- Total profit
- $26,435
- Equity at exit
- $15,563
Cash invested: $50,400 (down + closing). Projections, not guarantees.
Landlord ↔ Tenant lean methodology
- Overall (STATE)
- 90 Strongly Landlord-Friendly
- State Alabama
- 90 Strongly Landlord-Friendly · R+15
- County
- — inherits STATE
- City
- — inherits STATE
ZIP-level market 35022
- Home prices YoY
- -20.2%
- Rents YoY
- 14.8%
- Active inventory
- 311
- Price-to-rent
- 9.8×
Monthly cashflow live
- Estimated rent
- $1,534 high interval (Pro) →
- Mortgage (P&I)
- −$944
- Tax from tax record
- −$134 /mo · $1,612/yr
- Insurance
- −$75
- HOA
- −$0
- Vacancy / Maint / Mgmt
- −$322
- Net cashflow
- $58
Break-even live
UW: 25.0% down · 7.5% · 30yr · 1.5% tax · 5.0% vac · 8.0% maint · 8.0% mgmt
Financing live
Cash to close
- Down payment
- $45,000
- Closing costs
- $5,400
- Reserves months
- —
- Total cash needed
- —
Loan-product check · same deal, 3 products live
Conventional
25% down · 7.5% · 30yr
- Down + closing
- —
- Monthly P&I
- —
- Monthly cashflow
- —
- DSCR
- —
- Eligible?
- —
Personal DTI + credit; lowest rate.
DSCR
20% down · 8.5% · 30yr
- Down + closing
- —
- Monthly P&I
- —
- Monthly cashflow
- —
- DSCR
- —
- Eligible?
- —
No personal income docs; deal must DSCR.
Hard money
10% down · 12.0% · 12mo
- Down + closing
- —
- Monthly P&I
- —
- Monthly cashflow
- —
- DSCR
- —
- Eligible?
- —
Short-term bridge; refi at stabilization.
Rent comps 40 comps
| Address | Beds | Baths | Sqft | Rent | $/sqft | DOM | Units | Dist |
|---|---|---|---|---|---|---|---|---|
| 712 47th Way S Birmingham, AL | 2.0 | 1.0 | 1042 | $1,725 | $1.66 | 19d | 1 | 0.16mi |
| 724 47th Way S Unit 1019289P Birmingham, AL | 2.0 | 1.0 | 1044 | $8,438 | $8.08 | 43d | 1 | 0.19mi |
| 620 52nd St S Birmingham, AL | 3.0 | 2.0 | 1346 | $2,750 | $2.04 | 23d | 1 | 0.38mi |
| 936 54th St S Birmingham, AL | 3.0 | 1.5 | 1317 | $1,950 | $1.48 | 2d | 1 | 0.45mi |
| 4345 2nd Ave S Birmingham, AL | 3.0 | 2.0 | 988 | $1,800 | $1.82 | 23d | 1 | 0.59mi |
| 1410 46th St S Birmingham, AL | 3.0 | 1.0 | 1200 | $1,000 | $0.83 | 43d | 1 | 0.61mi |
| 4243 4th Ave S Birmingham, AL | 2.0 | 1.0 | 805 | $1,150 | $1.43 | 43d | 1 | 0.74mi |
| 233 52nd St N Birmingham, AL | 2.0 | 1.0 | 1430 | $1,200 | $0.84 | 43d | 1 | 0.74mi |
| 4237 5th Ave S Unit 4241-H Birmingham, AL | 2.0 | 1.0 | 725 | $1,115 | $1.54 | 43d | 1 | 0.75mi |
| 4237 5th Ave S Unit 4241-F Birmingham, AL | 2.0 | 1.0 | 725 | $1,098 | $1.51 | 43d | 1 | 0.75mi |
| 4237 5th Ave S Unit 4237-E Birmingham, AL | 2.0 | 1.0 | 725 | $1,135 | $1.57 | 2d | 1 | 0.75mi |
| 236 48th St N Birmingham, AL | 3.0 | 2.0 | 1318 | $1,750 | $1.33 | 2d | 1 | 0.75mi |
| 821 50th St N Birmingham, AL | 3.0 | 1.5 | 1416 | $1,523 | $1.08 | 1d | 1 | 0.75mi |
| 4233 3rd Ave S Birmingham, AL | 2.0 | 1.0 | 750 | $1,150 | $1.53 | 43d | 1 | 0.79mi |
| 737 47th St N Unit B Birmingham, AL | 2.0 | 1.0 | 706 | $750 | $1.06 | 23d | 1 | 0.84mi |
| 941 47th Pl N Birmingham, AL | 3.0 | 1.0 | 879 | $950 | $1.08 | 23d | 1 | 0.98mi |
| 972 53rd St N Birmingham, AL | 2.0 | 1.0 | 841 | $900 | $1.07 | 43d | 1 | 1.01mi |
| 934 47th St N Birmingham, AL | 3.0 | 1.0 | 972 | $1,000 | $1.03 | 23d | 1 | 1.03mi |
| 5102 Station Dr Unit 2422 Birmingham, AL | 2.0 | 2.0 | 1051 | $2,850 | $2.71 | 1d | 1 | 1.04mi |
| 5102 Station Dr Unit 2122 Birmingham, AL | 2.0 | 2.0 | 1051 | $2,575 | $2.45 | 1d | 1 | 1.04mi |
| 5102 Station Dr Birmingham, AL | 1.0–2.0 | 1.0–2.0 | 876 | $3,150 | $3.60 | 1d | 10 | 1.05mi |
| 4108 7th Ave N Birmingham, AL | 3.0 | 1.0 | 1100 | $1,350 | $1.23 | 23d | 1 | 1.11mi |
| 3833 6th Ave S Birmingham, AL | 2.0 | 1.0 | 725 | $1,100 | $1.52 | 43d | 1 | 1.13mi |
| 3827 6th Ave S Birmingham, AL | 2.0 | 1.0 | 725 | $1,100 | $1.52 | 43d | 1 | 1.16mi |
| 4019 Glenwood Ave #1 Birmingham, AL | 2.0 | 2.0 | 868 | $1,635 | $1.88 | 15d | 1 | 1.16mi |
| 573 61st St S Birmingham, AL | 2.0 | 1.0 | 800 | $850 | $1.06 | 43d | 1 | 1.17mi |
| 813 42nd Pl N Birmingham, AL | 3.0 | 2.0 | 1424 | $1,285 | $0.90 | 43d | 1 | 1.17mi |
| 809 39th Pl S Unit 4 Birmingham, AL | 1.0 | 1.0 | 927 | $1,099 | $1.19 | 14d | 1 | 1.22mi |
| 6107 Crest Green Rd Birmingham, AL | 2.0 | 1.5 | 1273 | $995 | $0.78 | 43d | 1 | 1.22mi |
| 1101 47th St N Birmingham, AL | 3.0 | 2.0 | 1296 | $1,200 | $0.93 | 23d | 1 | 1.23mi |
| 5811 2nd Ave N Birmingham, AL | 2.0 | 1.0 | 1000 | $1,200 | $1.20 | 3d | 1 | 1.23mi |
| 559 63rd St S Birmingham, AL | 3.0 | 1.0 | 930 | $1,000 | $1.08 | 3d | 1 | 1.24mi |
| 137 59th St N Apt 6 Birmingham, AL | 2.0 | 1.0 | 800 | $725 | $0.91 | 43d | 1 | 1.27mi |
| 137 59th St N Unit 3 Birmingham, AL | 2.0 | 1.0 | 800 | $725 | $0.91 | 23d | 1 | 1.27mi |
| 901 38th St S Apt 2 Birmingham, AL | 2.0 | 2.0 | 990 | $1,930 | $1.95 | 3d | 1 | 1.31mi |
| 3630 Clairmont Ave Unit 3632-2 Birmingham, AL | 1.0 | 1.0 | 750 | $945 | $1.26 | 23d | 1 | 1.37mi |
| 1117 42nd Pl N Birmingham, AL | 3.0 | 1.0 | 1026 | $900 | $0.88 | 43d | 1 | 1.37mi |
| 532 Athens Ct Birmingham, AL | 3.0 | 1.0 | 1138 | $1,125 | $0.99 | 43d | 1 | 1.40mi |
| 6241 Crest Green Rd Birmingham, AL | 3.0 | 2.0 | 1380 | $1,210 | $0.88 | 23d | 1 | 1.40mi |
| 1601 48th St N Birmingham, AL | 3.0 | 1.0 | 1313 | $1,200 | $0.91 | 23d | 1 | 1.40mi |
Listing history 17 events
-
2026-06-18days on market $180,000 Active 111 DOM
-
2026-06-17days on market $180,000 Active 110 DOM
-
2026-06-16days on market $180,000 Active 109 DOM
-
2026-06-15days on market $180,000 Active 108 DOM
-
2026-06-13days on market $180,000 Active 106 DOM
-
2026-06-10days on market $180,000 Active 103 DOM
-
2026-06-09days on market $180,000 Active 102 DOM
-
2026-06-08days on market $180,000 Active 101 DOM
-
2026-06-07days on market $180,000 Active 100 DOM
-
2026-06-03days on market $180,000 Active 96 DOM
-
2026-06-02days on market $180,000 Active 95 DOM
-
2026-06-01days on market $180,000 Active 94 DOM
-
2026-05-31days on market $180,000 Active 93 DOM
-
2026-04-15price $180,000 205-char remark
Show marketing remark (205 chars)
Its all about the Lokation!!!! This charming home is close to everything Birmingham has to offer! In a quite neighborhood! Truly the best of both worlds to enjoy the city life then go home to peacefulness.
-
2026-03-10price $190,000 205-char remark
Show marketing remark (205 chars)
Its all about the Lokation!!!! This charming home is close to everything Birmingham has to offer! In a quite neighborhood! Truly the best of both worlds to enjoy the city life then go home to peacefulness.
-
2026-02-27$220,000 Active 205-char remark
Show marketing remark (205 chars)
Its all about the Lokation!!!! This charming home is close to everything Birmingham has to offer! In a quite neighborhood! Truly the best of both worlds to enjoy the city life then go home to peacefulness.
-
2010-06-30soldstatus $99,900
ⓘ Source: listings_history table (triggers on properties + properties_extension) + one-shot
backfill from property_details.listing_events for pre-trigger history.
Tax reassessment forecast AL · Resets to sale price
- Current annual tax
- $1,612 · $134/mo
- Projected year-2 tax
- $1,612 · $134/mo
- Expected delta
- $0/yr ($0/mo · 0.0%)
ⓘ Screening estimate from a state-policy table — verify with the county assessor before closing.
Climate risk First Street
- Flood 1/10 Low FEMA zone X (unshaded) · 0% chance over 30 yrs
- Wildfire 1/10 Low
- Heat 6/10 Major 7 d/yr ≥106°F today · 19 d/yr by 30 yrs out
- Wind 6/10 Major 27% chance of damaging wind over 30 yrs
- Air quality 4/10 Moderate 6 unhealthy d/yr today · 8 by 30 yrs out
Nearby sold comps map
Loading sold comps map…
Walkable amenities ~0.75 mi
Loading nearby amenities…
Taxation est. · year 1
- Rental income
- $18,406
- − Mortgage interest
- −$10,083
- − Property taxes
- −$1,612
- − Insurance
- −$900
- − Repairs & maintenance
- −$1,473
- − Management
- −$1,473
- − Depreciation
- −$5,236
- Taxable loss
- −$2,370
- Est. tax savings @ 24.0%
- +$569
- After-tax cash flow
- $1,271/yr
For passive investors: Depreciation is non-cash, so a rental often shows a tax loss while cash-flowing — sheltering income. Rental losses are passive: they offset passive income freely, and up to $25,000/yr can offset ordinary (W-2) income if you actively participate and your MAGI is under $100k (phasing out to $0 by $150k); unused losses carry forward. On sale, claimed depreciation is recaptured at up to 25%, and gains may owe capital-gains tax (a 1031 exchange can defer both). Figures are a year-1 estimate at your 24.0% rate — not tax advice; consult a CPA.
Schools (NCES district)
- District
- Birmingham City
- NCES district ID
- 0100390
- Math proficiency
- 4% ▼ -17.00%
- Reading proficiency
- 20% ▼ -4.00%
- Median HH income
- $31,988
- Composite
- 9.49/100
- National rank
- #9850
- State rank
- #116 of 129 in AL
Livability — Birmingham
- Score
- 67/100
- State rank
- #78
- US rank
- #10412
Category grades
Schools grade is shown separately in the Schools card above.
Census & demographics
- Census place
- Birmingham, AL
- County
- Jefferson County · 527,445 people
- City population
- 210,422
- Metro
- Birmingham-Hoover, AL
- Population (ZIP)
- 23,126
- Household income
- $81,846
- Rent vs Own
- Severe rent burden
- 554.0
Population outlook (Jefferson County) Hauer SSP2
- Today (2025)
- 669,185 people
- By 2030
- 669,694 · +0.1%
- By 2040
- 661,388 · -1.2%
- By 2050
- 643,086 · -3.9%
- By 2075
- 577,267 · -13.7%
- By 2100
- 474,758 · -29.1%
Race, ethnicity, and origin ACS 2023
- Neighborhood character
- Diverse neighborhood (Simpson 0.56)
- Race & ethnicity
- Black 53% White 41% Hispanic / Latino 3% Two or more races 2% Asian 1%
- Common ancestry
- Italian 1% Slovak 1% Iranian 1%
- Foreign-born
- 4% · Canada, China
- Languages at home
- 96% English-only · Spanish 3% Chinese 1%
Political lean MEDSL · Jefferson
- 2024 margin
- D (+10.4) · D 54.6% · R 44.2% · Other 1.2%
- 2008→2024 swing
- +5.4pp toward D · 2008: 5.1pp · 2024: 10.4pp
- All cycles
- 2024: D+10.4 2020: D+13.2 2016: D+7.2 2012: D+6.0 2008: D+5.1
Not yet ingested
- Civics
- —
Market trends
- HPI YoY
- ▼ -55.40%
- Current HPI
- 219.3839
- Rent YoY
- ▲ 14.80%
- Metro
- Birmingham-Hoover, AL
- State GDP YoY
- ▲ 2.94%
- F500 in state
- 4
Industry mix (Fortune 500 HQ in AL)
| Industry | F500 HQs | Revenue |
|---|---|---|
| Financial Services | 1 | $8B |
|
||
| Healthcare | 1 | $5B |
|
||
Price history
+80.2% since first listed4 events — show timeline
- 2026-04-15 Price Changed $180,000 Greater Alabama MLS
- 2026-03-10 Price Changed $190,000 Greater Alabama MLS
- 2026-02-27 Listed $220,000 Greater Alabama MLS
- 2010-06-30 Sold (Public Records) $99,900 Public Records
Property tax history
+8.5%/yrLatest (2025): $1,612 · +0.0% YoY. Source: county tax records.
Cash-flow waterfall
monthlySold comps — $/sqft
last 12 mo · ≤1 miLoading sold comps…